


Abstract
Background The widely observed association between birth size and risk of later coronary heart disease (CHD) has not been examined in an impoverished pre-20th century birth cohort.
Methods Birth weights and maternal characteristics, for births between 1857 and 1900 in a charity hospital, were recorded from preserved ledgers. Names were linked to death certificates to determine age and cause of death. Death with CHD was coded using specific criteria, and survival analysis methods were used to relate risk of CHD to birth weight, allowing for competing causes of death and adjusting for potentially confounding maternal factors.
Results Death certificates were traced for 8584 (53%) of 16 272 registered live-births. Survival analyses were confined to 2938 subjects (1572 male, 1366 female) who survived beyond age 40, since none of the 486 CHD cases was recorded earlier. CHD risk increased with time, but there was no evidence that it was related to birth weight, in men or women.
Conclusions We did not replicate findings in more recent cohorts. This may represent a true lack of association in a historical cohort who we believe remained impoverished through their early life. However, we acknowledge the strong possibility of misclassification of cause of death by the person filling in the death certificate and/or our coding criteria, and temporal change in diagnostic criteria for CHD. We cannot exclude the possibility that low birth weight babies ‘programmed’ in utero for later CHD were more likely to die in infancy, in this cohort with a high infant mortality rate.
There has been much interest in the widely observed association between size at birth and risk of later cardiovascular disease.1,2 More recently it has been proposed that it is the transition from an ‘impoverished’ intrauterine environment (leading to low birth weight) to affluence in infancy and/or childhood that increases risk of coronary heart disease (CHD).3,4 However, to our knowledge there are no such studies on 19th century cohorts and few historical cohorts have data on maternal factors, socioeconomic status at the time of birth, and information about cause of death.
We have access to an unusually rich source of data. Birth record ledgers at the Royal Women's Hospital in Melbourne (formerly the Lying-In Hospital and Infirmary for Diseases Peculiar to Women and Children) contain details about maternal country of birth, age, marital status, and parity as well as information about their infant's delivery and birth weight. We previously used these data to examine temporal changes in birth weight over the period 1857–83, for which there were complete birth records.5,6
William Henry Archer, the statistician who established the Colony of Victoria's system of vital registration in 1856, endowed the state with what are among the most detailed birth, marriage, and death certificates in the world.7 Birth certificates included information about a person's parentage and paternal occupation and, on the death certificates, causes of death ranged from the immediate ones to long-standing illness and their duration. Data from people who died up to 1985 have been made available on CD-ROM.
We have linked birth records at the hospital to death certificates, to construct the first cradle-to-grave dataset of 19th century Australian life courses. Moreover these span the rise and decline of the modern epidemic in CHD.
In this study we have investigated the hypothesis that there is an association between birth weight and CHD, and that this is not independent of maternal factors and socioeconomic factors at birth.
Methods
Maternal name, country of birth, parity, age at the time of delivery, and marital status were recorded from birth registers still kept at the hospital, along with infant sex, birth weight and mode of delivery, and in most cases birth length and length of labour.
We searched contemporary birth and death certificates, using the CD-ROM indices to find those who changed their name through marriage or adoption. We were only able to pursue those live-births that were fully recorded in surviving ledgers and subsequently registered.
Maternal marital status was coded as married (and supported) vs single (or unsupported, so including those widowed or divorced). Socioeconomic status at birth was initially coded into seven groups on the basis of mother's marital status, whether the father was named on the birth certificate, and recorded paternal occupation. The seven groups were: (i) unmarried mother, father unnamed (ii) unmarried mother, father named (iii) married mother, father's occupation not stated (iv) married mother, father's occupation unskilled (v) married mother, father's occupation semi-skilled, (vi) married mother, father's occupation skilled manual (vii) married mother, father's occupation non-manual, or professional/managerial. Some groups proved small so we subsequently collapsed these into three groups, combining (i) with (ii), (iii) with (iv), and (v) and (vi) with (vii).
Number of births was relatively small for some years, particularly the first few, so we coded year of birth into eight categories; 1857–65, 1866–70, 1871–75, 1876–80, 1881–85, 1886–90, 1891–95, and 1896–1900.
People were coded as having CHD when the words ‘angina’, ‘heart attack’, ‘myocardial infarction’, ‘cardiac infarction’, ‘ischaemic heart disease’, or ‘myocardial ischaemia’ were found on the death certificate. ‘Coronary thrombosis’ or ‘coronary occlusion’ were also coded as CHD if either was the immediate cause of death. In many other cases the words ‘coronary atherosclerosis’ or ‘coronary thrombosis’ appeared on the death certificate, but the primary cause of death was, for example, cancer, injury, or dissecting aneurysm. In these cases it is possible that coronary artery disease (commonly seen in otherwise ‘healthy’ people8–11) was observed and described at post-mortem examination. Apart from those recorded as having inquests, we do not know which people were examined post-mortem, so these cases were not categorized as having CHD.
Coding, according to the criteria above, was undertaken manually by R.M. Data were then checked by computer searching for specific words (e.g. coronary, angina, heart, myocardial) and a variety of possible spelling errors, and by manually re-checking all of those coded as CHD.
t-Test and chi-squared tests were used to compare characteristics according to whether a death certificate was traced, and linear regression analysis was used to assess the relationship between birth weight and year group and maternal factors. Survival analysis methods were used to assess the relationship between the risk of CHD and birth weight while allowing for competing causes of death over the lifespan under consideration. To facilitate comparison with data from other cohorts we converted birth weight to kilograms for these analyses. Age at death with CHD was the analysis endpoint, with ages at death for people dying of other causes treated as censored observations. Proportional hazards (Cox) regression models were used to adjust for potential confounding factors with respect to birth weight, the exposure of interest.
Results
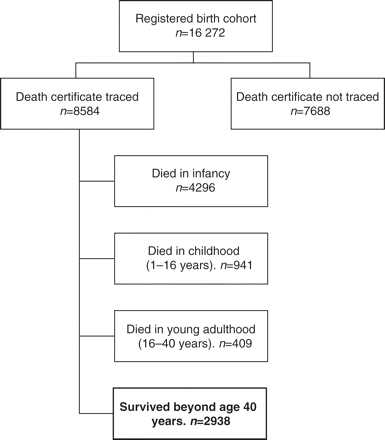
We traced 16 272 registered live-birth records between the beginning of 1857 and end of 1900. Death certificates were traced for 8584 (53%): 4296 (50%) of the traced cohort died in infancy (before their first birthday) and 941 between age 1 and 16 years, so there were 3347 people who survived to adulthood (≥16 years) and 2938 of these (88%) survived beyond age 40 years (Figure 1).
Subjects in the birth cohort
In Figure 2 we show survival curves for males and females separately. Initial analyses demonstrated that there were no cases of CHD up to age 40 years. Birth characteristics according to whether a death certificate was found are shown in Table 1.
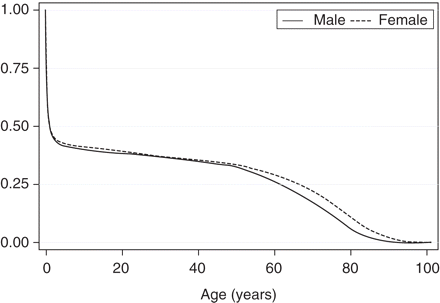
Survival estimates (Kaplan–Meier) for males and females (n = 4589 males and 3998 females)
Birth weight and maternal factors according to whether subjects' death certificates were traced
| Death certificate not traced | Death certificate traced | 95% CI for differencea | |||||
|---|---|---|---|---|---|---|---|
| Mean (SD) birth weight in pounds | n = 7659 | 7.5 (1.2) | n = 8568 | 7.2 (1.4) | 0.2–0.3 | ||
| Mean (SD) maternal age in years | n = 7675 | 24 (6) | n = 8566 | 25 (6) | −0.9 to −0.5 | ||
| % (n) male | n = 7648 | 50% (3811) | n = 8583 | 54% (4588) | −5 to −2% | ||
| % (n) first baby | n = 7688 | 54% (4133) | n = 8578 | 49% (4210) | 3–7% | ||
| % (n) mothers married and supportedb | n = 7688 | 45% (3473) | n = 8584 | 54% (4662) | −1 to −7% | ||
a For all comparisons, by t-test or chi-squared as appropriate, P < 0.0001.
b Not single, widowed, or divorced.
Maternal characteristics of those without traced death certificates more closely resembled those of the group dying in infancy or childhood than those surviving beyond age 40 (data not shown) though they had higher mean birth weight (7.5 vs 7.0 pounds, respectively, 95% CI for difference 0.4–0.5 pounds; P < 0.001 by t-test).
Among those with traced certificates there was a strong relationship between birth weight and survival beyond age 40 years; 14% of those weighing <6 pounds (<2.7 kg) at birth survived to this age, 31% weighing 6–7 pounds, 38% weighing 7–8 pounds, and 41% weighing over 8 pounds (P < 0.001 by chi-squared).
In subsequent analyses we included only the 2938 subjects whose death certificates indicated that they survived beyond age 40 years.
Birth weight
Temporal trends in mean birth weight are shown in Table 2. Mean birth weight fell during the 1870s (as we reported previously5,6) and fell again in the late 1890s.
Birth weight according to year of birth and maternal country of birth, socioeconomic status, age and parity, among those who survived beyond age 40 years
| n | Mean birth weight in pounds (SD) | P* | |
|---|---|---|---|
| Total | 2937 | 7.6 (1.2) | |
| Year of birth | 0.1 | ||
| 1857–65 | 221 | 8.0 (1.3) | |
| 1866–70 | 196 | 7.6 (1.1) | |
| 1871–75 | 234 | 7.2 (1.2) | |
| 1876–80 | 307 | 7.3 (1.2) | |
| 1881–85 | 280 | 8.0 (1.2) | |
| 1886–90 | 272 | 7.6 (1.2) | |
| 1891–95 | 434 | 7.9 (1.0) | |
| 1896–1900 | 993 | 7.5 (1.1) | |
| Mother's birth place | 0.04 | ||
| Australia | 1756 | 7.6 (1.1) | |
| Elsewhere | 1120 | 7.7 (1.3) | |
| Socioeconomic status at birtha | <0.001 | ||
| Group 1 | 785 | 7.4 (1.1) | |
| Group 2 | 1244 | 7.6 (1.2) | |
| Group 3 | 908 | 7.7 (1.2) | |
| Maternal age | 0.3 | ||
| <21 years | 569 | 7.6 (1.1) | |
| 21–30 years | 1686 | 7.6 (1.2) | |
| >30 years | 675 | 7.6 (1.2) | |
| Maternal parity | <0.001 | ||
| Pregnancy 1 | 1139 | 7.3 (1.1) | |
| Pregnancy 2–6 | 1424 | 7.7 (1.2) | |
| Pregnancy 7+ | 311 | 8.1 (1.3) |
a Group 1 = unmarried mother, father unnamed or named, Group 2 = married mother, father's occupation not stated, unskilled or semi-skilled, Group 3 = married mother, father's occupation skilled manual or non-manual, or professional/managerial.
*P from linear trend (regression) analysis.
In Table 2 we also show that mean birth weight increased with maternal parity and with increasing socioeconomic status at birth, and was slightly higher among those whose mothers were born overseas vs born in Australia. There was no relationship between birth weight and maternal age.
Coronary heart disease
Altogether 486 people (16.5%) fulfilled the criteria for CHD. Risk of CHD differed between males and females; 293 (18.5%) men died with CHD vs 193 (14%) women; P = 0.01 by chi-squared.
In Figure 3 we show that over the time period studied, the proportion of deaths ascribed to CHD, according to year of birth, increased sharply in both males and females (P < 0.001, from logistic regression models). Further insight was obtained by analysing data according to year of death (Figure 4, including only those dying between age 50 and 59 to avoid differences in age distribution after 1940). The proportion dying with CHD rose sharply after 1930 and then again after 1949.
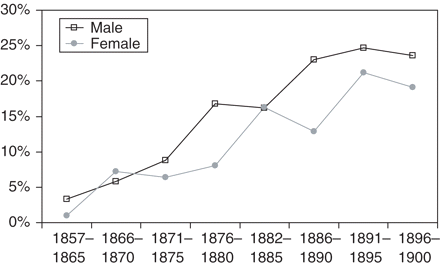
Proportion of men and women who died with CHD according to year of birth, among those who survived to age 40
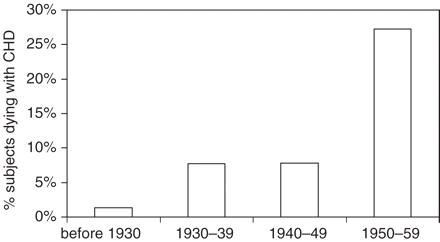
Death with CHD by year of death. Data confined to subjects dying between 50 and 59 years of age
Relationship with birth weight
Survival analysis (Table 3) showed no evidence of an association between birth weight and CHD, in either males or females, before or after adjusting for potentially confounding maternal factors. We also examined various categorical splits (e.g. at 3, 3.5, and 4 kg), and there was no evidence of a non-linear association between CHD risk and birth weight category. We also repeated all these analyses after excluding subjects who were recorded as being born preterm or from a multiple birth, and this did not materially alter our findings.
Hazard ratios indicating relative risk of death with CHD according to birth weight and maternal factors, from multivariable Cox regression model
| Males (n = 1571) | Females (n = 1366) | |||||||
|---|---|---|---|---|---|---|---|---|
| Hazard ratio | 95% CI | Hazard ratio | 95% CI | |||||
| Birth weight | ||||||||
| Per kg increase | 0.9 | 0.7–1.1 | 1.0 | 0.8–1.4 | ||||
| Year of birth | ||||||||
| 1857–65 | 1 | 1 | ||||||
| 1866–70 | 2.1 | 0.6–7.2 | 8.8 | 1.1–71.7 | ||||
| 1871–75 | 2.4 | 0.7–7.6 | 7.1 | 0.9–58.6 | ||||
| 1876–80 | 5.2 | 1.8–15.5 | 6.9 | 0.9–53.7 | ||||
| 1881–85 | 4.6 | 1.5–13.7 | 11.5 | 1.5–87.5 | ||||
| 1886–90 | 6.8 | 2.3–20.4 | 9.4 | 1.2–73.1 | ||||
| 1891–95 | 8.8 | 2.8–23.1 | 23.1 | 3.1–172.4 | ||||
| 1896–1900 | 8.5 | 3.0–24.0 | 26.6 | 3.6–197.8 | ||||
| Mother's birth place | ||||||||
| Australia | 1 | 1 | ||||||
| Elsewhere | 0.9 | 0.6–1.2 | 0.7 | 0.5–1.1 | ||||
| Socioeconomic status at birtha | ||||||||
| Group 1 | 1 | 1 | ||||||
| Group 2 | 1 | 0.7–1.3 | 1.1 | 0.9–2.0 | ||||
| Group 3 | 1.2 | 0.8–1.6 | 1.3 | 0.7–1.5 | ||||
| Maternal age | ||||||||
| <21 years | 1 | 1 | ||||||
| 21–30 years | 0.8 | 0.6–1.1 | 1.0 | 0.7–1.5 | ||||
| >30 years | 0.6 | 0.4–0.9 | 0.7 | 0.5–1.1 | ||||
| Maternal parity | ||||||||
| Pregnancy 1 | 1 | 1 | ||||||
| Pregnancy 2–6 | 1.1 | 0.8–1.4 | 1.1 | 0.8–1.5 | ||||
| Pregnancy 7+ | 1.3 | 0.8–2.0 | 1.0 | 0.6–1.8 | ||||
a Group 1 = unmarried mother, father unnamed or named, Group 2 = married mother, father's occupation not stated, unskilled or semi-skilled, Group 3 = married mother, father's occupation skilled manual or non-manual, or professional/managerial.
A strong temporal trend to higher rates of CHD was evident, consistent with Figure 3. There was no evidence that maternal country of birth, socioeconomic status, or parity was associated with offspring CHD risk, but there was a weak indication that having an older mother may have been protective, especially for males.
Discussion
To our knowledge, this is the first study of birth weight and CHD in a birth cohort from the 19th century and, therefore, the first cohort study where almost all subjects had already died. It is also a cohort among whom almost all would have been impoverished in early life and the majority would have been impoverished at least until the age of 40.
When we examined the relationship between birth weight and CHD in survival analyses among people who lived to at least age 40 years, we found no evidence of an association between CHD and birth weight in either males or females, unlike studies on early 20th century birth cohorts.12–14 Results were unaffected by exclusion of earlier deaths because there was no CHD before this age.
We found weak evidence that increasing maternal age may be protective against CHD, independently of maternal parity and especially in men, but this has not been reported previously and may be a chance finding or reflect unidentified confounding.
We are confident that the variations over time in mean birth weight in the hospital were not an artefact of measurement technique,6 but these fluctuations were not reflected in temporal changes in CHD risk (Figure 3).
However, we fully recognize the limitations of our data. All subjects were born at a single charity hospital. They were not representative of the population of Melbourne at that time but came from the most underprivileged groups, with only 50% of their mothers married and supported. Within the birth cohort, we were only able to trace death certificates for 8584/16 272 (53%). Those we failed to discover may have been a biased group. In terms of maternal characteristics they more closely resembled those who died in childhood than those who died as adults, and we suspect that a proportion of them died in early childhood but their deaths were not registered. People whose death certificates were traced were more likely to be male than those not traced (54% vs 50%), probably because males retained their birth family name and were thus easier to trace than females, who had to be traced on the basis of family name at birth, rather than family name at death.
Other likely reasons for loss to follow-up are: (i) some single women were believed to give false names when admitted, so nominal linkage would have failed, (ii) illegitimate children were often fostered or adopted and thereby died under different names, (iii) some people assumed aliases as adults, (iv) our study is probably biased against those with common names like ‘Smith’ and ‘Kelly’, since they were more difficult to identify positively, (v) there was always some out-migration from Victoria to other Australian states or overseas, especially during the 1890s depression, and (vi) we could not access death certificates for people who died after 1985 so data will be censored for a few of those born in the late 1800s.
Nevertheless, a representative sample is not essential for testing aetiological hypotheses, and the high loss rate would only bias our results if lower birth weight babies who had been ‘programmed’ by their in utero experience for high risk of later CHD, and/or higher birth weight babies who had been ‘programmed’ for lower risk, were selectively not traced. We see no reason why this should be the case.
We also considered the possibility that low birth weight babies who had been ‘programmed’ to develop CHD in adulthood might have been more likely to die in infancy or childhood than other low birth weight babies, in this cohort with an extremely high infant mortality rate. This is an interesting possibility that we cannot exclude.
Misclassification of cause of death is a strong possibility and could relate to our coding criteria for CHD or the person filling in the death certificate. Our coding was undertaken according to very specific criteria but we are aware that use of the terms on which we coded may have changed over time and that diagnoses were of variable reliability.
It has been reported that the pathology and clinical features of myocardial infarction were first recognized in 1912,15 though others have suggested this was not understood fully until decades later.16 In 1946 a leading physician in the UK stated that ‘Looking through my notes of patients seen 20 or 30 years ago, I come across cases where I failed to recognize the coronary thrombosis, which now, on paper, is the obvious diagnosis’.17 Thus there appears to have been a change in the way physicians interpreted groups of symptoms that were later recognized as CHD. The first recording showing acute myocardial infarction in a human was published in 192018 and Einthoven won the Nobel prize in 1924 for inventing the electrocardiograph. From the mid-1950s measurement of the rise in serum enzymes resulting from myocardial infarction further improved diagnostic precision.19 In this cohort we saw that CHD only appeared as a substantial cause of death after 1930, with a further increase after 1949 (Figure 4).
From other information on the death certificates, it is clear that most of these individuals died as poor people. Few would have been seen by specialist doctors, and many died as ‘anonymous’ charity patients in public teaching hospitals. Some people may have had a history of CHD that was not recorded on their death certificate because the doctor completing the death certificate did not know their history and they were unable to provide one. Others would have been certified by a family doctor who knew their history. Thus the quality of information on death certificates would have been variable and possibly related to socioeconomic status at the time of death. However, this should not affect our findings here because socioeconomic status at death (inferred from address at the time of death) was unrelated to birth weight (data not shown).
The increase in death with CHD seen in Figures 3 and 4 may represent a change in the medical profession's understanding of heart disease (above), but it could represent the beginning of the CHD ‘epidemic’ as the general standard of living among this disadvantaged group increased, in the same way that a CHD ‘epidemic’ is emerging in developing countries as they become more affluent.20 Between 1912 and 1926, factory production increased and the general standard of living improved. After 1938 Melbourne experienced the first sustained economic growth since the 1890s21,22 with increased consumption of meat (mostly mutton) and dairy products.
It has recently been suggested that risk of cardiovascular disease increases when there is a mismatch between intrauterine nutrition and nutrition post-natally, such that people who are in an environment with sparse nutritional supplies in utero are less healthy when exposed to plentiful supplies post-natally than those with an optimal nutritional supply in utero.4 The temporal trend in CHD according to year of birth, (Figure 3), could relate to general improvements in nutrition over time, so that babies who had been compromised in utero were exposed to plenty in post-natal life. It could also relate to increasing availability of cigarettes in the later years, though we see a sharp rise in lung cancer and chronic obstructive pulmonary disease in men born after the mid-1880s, rather than a gradual increase as for CHD (data not shown).
The rise in CHD in this sample of poor Australians may or may not be real, but, if it is real, the explanation lies with factors other than birth weight or maternal characteristics that were recorded at the time of birth.23
20th century studies have found an inverse association between birth weight and risk of coronary heart disease (CHD).
In an impoverished 19th century birth cohort with a high infant mortality rate we did not find this association. This could be because:
Most people in our study remained impoverished for most or all of their lives.
Deaths in this historical cohort were misclassified.
Individuals with low birth weight who were ‘programmed’ for CHD were more likely to die in infancy.
We thank the Australian Research Council for funding this study. R.M. has been supported by VicHealth (Victorian Health Promotion Foundation) and is now supported by the Australian National Health and Medical Research Council. We thank Shurlee Swain and Joanne Townsend, and especially thank Cecile Trioli for painstaking work tracing birth and death certificates and extracting, recording, and checking data for this study.
References
Barker DJP. Programming the baby. In: Mothers, babies and health in later life. Edinburgh: Churchill Livingstone,
Kramer MS. Association between Restricted Fetal Growth and Adult Chronic Disease: Is It Causal? Is It Important?
Singhal A, Lucas A. Early origins of cardiovascular disease: is there a unifying hypothesis?
Gluckman PD, Hanson MA. Living with the past: evolution, development, and patterns of disease.
McCalman J, Morley R. Mothers' health and babies' weights: the biology of poverty at the Melbourne Lying-in Hospital, 1857–83.
Morley R, McCalman J, Carlin JB. Trends in birthweight between 1857 and 1883, in Melbourne, Australia.
Hopper JL. The Contribution of W. H. Archer to Vital Statistics in the Colony of Victoria.
Emos WF, Holmes RH, Beyer J. Coronary disease among United States soldiers killed in action in Korea; preliminary report.
McNamara JJ, Molot MA, Stremple JF, Cutting RT. Coronary artery disease in combat casualties in Vietnam.
Berenson GS, Wattigney WA, Tracy RE, Newman WP. 3rd, Srinivasan SR, Webber LS et al. Atherosclerosis of the aorta and coronary arteries and cardiovascular risk factors in persons aged 6 to 30 years and studied at necropsy (The Bogalusa Heart Study).
Joseph A, Ackerman D, Talley JD, Johnstone J, Kupersmith J. Manifestations of coronary atherosclerosis in young trauma victims—an autopsy study.
Leon DA, Lithell HO, Vagero D, Koupilova I, Mohsen R, Berglund L et al. Reduced fetal growth rate and increased risk of death from ischaemic heart disease: cohort study of 15 000 Swedish men and women born 1915–29.
Rich-Edwards JW, Stampfer MJ, Manson JE, Rosner B, Hankinson SE, Colditz GA et al. Birth weight and risk of cardiovascular disease in a cohort of women followed up since 1976.
Lawlor DA, Davey Smith G, Ebrahim S. Birth weight is inversely associated with coronary heart disease in post-menopausal women: findings from the British women's heart and health study.
Lawrence C. ‘Definite and Material’: Coronary thrombosis and cardiologists in the 1920s. In: Rosenberg CE, Golden J (Eds). Framing Disease; Studies in Cultural History. New Jersey: Rutgers University Press,
Pardee HE. 50 years ago—a classic description. Postero-inferior myocardial infarction in a 38-year-old man with electrocardiograms. Initial transient heart block—early atrial fibrillation. 1920.
Siegel A, Bing RJ. Plasma enzyme activity in myocardial infarction in dog and man.
Reddy KS. Cardiovascular diseases in the developing countries: dimensions, determinants, dynamics and directions for public health action.
McLean IW. Consumer prices and expenditure patterns in Australia 1850–1914.
Whitwell G, Nicholas S.

