


Abstract
Myopia prevalence has increased in the past 20 years, with many studies linking the increase to reduced time spent outdoors. A number of recent observational studies have shown an inverse association between vitamin D [25(OH)D] serum levels and myopia. However, in such studies it is difficult to separate the effects of time outdoors and vitamin D levels. In this work we use Mendelian randomization (MR) to assess if genetically determined 25(OH)D levels contribute to the degree of myopia.
We performed MR using results from a meta-analysis of refractive error (RE) genome-wide association study (GWAS) that included 37 382 and 8 376 adult participants of European and Asian ancestry, respectively, published by the Consortium for Refractive Error And Myopia (CREAM). We used single nucleotide polymorphisms (SNPs) in the DHCR7, CYP2R1, GC and CYP24A1 genes with known effects on 25(OH)D concentration as instrumental variables (IV). We estimated the effect of 25(OH)D on myopia level using a Wald-type ratio estimator based on the effect estimates from the CREAM GWAS.
Using the combined effect attributed to the four SNPs, the estimate for the effect of 25(OH)D on refractive error was −0.02 [95% confidence interval (CI) −0.09, 0.04] dioptres (D) per 10 nmol/l increase in 25(OH)D concentration in Caucasians and 0.01 (95% CI −0.17, 0.19) D per 10 nmol/l increase in Asians.
The tight confidence intervals on our estimates suggest the true contribution of vitamin D levels to degree of myopia is very small and indistinguishable from zero. Previous findings from observational studies linking vitamin D levels to myopia were likely attributable to the effects of confounding by time spent outdoors.
Multiple observational studies have shown an inverse association between 25(OH)D level and degree of myopia.
Results from this study suggest that vitamin D is not causally related to the degree of myopia.
Association estimates in observational studies are likely to be confounded by time spent outdoors.
Introduction
Myopia is the most common type of refractive error (RE). Its prevalence has notably increased worldwide in the past two decades, particularly in East Asian populations.1,2 Despite many international efforts, because of its complex nature the causes of myopia are not yet well understood.3,4 Numerous studies5–11 have found that time spent outdoors is inversely associated with myopia development, and a number of mechanisms have been proposed to explain this potential protective effect. One hypothesis is that time spent outdoors translates into less time performing close-work activities, which may promote eye elongation as a compensatory mechanism to accommodation-induced defocus.12–14 However, some studies have shown that the effect of time outdoors in the development of myopia is independent of the effect of close-work activities.15–17 Another hypothesis suggests that bright light enhances retinal dopamine release, which may suppress axial elongation.18,19 More recently, some studies have proposed that higher vitamin D level [measured as the concentration of 25(OH)D] in serum or plasma reduces the risk of myopia.20–23 However, studies from the British Avon Longitudinal Study of Parents and Children (ALSPAC) and the European Eye Study found no evidence of an independent association between 25(OH)D levels and myopia.19,24,25 The null findings from these large studies suggest that the previously documented association between serum 25(OH)D level and myopia was potentially confounded by time spent outdoors and/or the degree of sun exposure.
In this work, we aimed to clarify the role of 25(OH)D levels on myopia development. To this end, we carried out a Mendelian randomization (MR) analysis. MR is an approach used to test and estimate the causal effect between an exposure and an outcome.26 The approach has been used to examine the link between 25(OH)D levels and other complex diseases.27–29 MR uses an instrumental variable (IV) built from genetic variants with known effect on the risk factor, to make a causal inference. This approach is considered to be equivalent to a ‘natural’ randomized controlled trial (RCT), as genotypes are segregated randomly from parent to offspring. Because of this random transmission of alleles, the genotypes are not related to any of the factors (e.g. sex, age or environmental factors such as time outdoors) that commonly confound associations in traditional epidemiological studies.30 Here we used genetic variants that are known to affect 25(OH)D concentrations as an IV to evaluate the relationship between 25(OH)D levels and myopia (measured by RE).
Methods
Instrumental variables
As IVs we used SNPs in DHCR7 (rs12785878 and rs7944926), CYP2R1 (rs10741657 and rs12794714), CYP24A1 (rs6013897) and GC (rs2282679) which have been consistently reported to influence 25(OH)D levels.27,28,31–33 We used these variants in preference to others in the same genes since these are in linkage disequilibrium (LD), and we can use their estimated effects on vitamin D concentrations reported in Afzal et al. (rs7944926, rs12794714) from 30 792 individuals of Danish descent,27 and in Mokry et al. (rs12785878, rs10741657, rs6013897 and rs2282679) from 2 347 individuals of European descent.28 Nevertheless, in Supplementary Table 1 (available as Supplementary data at IJE online) we show the association between RE and genotype for other SNPs in all four genes (DHCR7, CYP2R1, GC and CYP24A1).
Beta coefficients and standard errors quantifying the association between RE and genotype for the SNPs of interest were obtained from a published genome-wide association study (GWAS) meta-analysis from the Consortium for Refractive Error And Myopia (CREAM). Full details of this meta-analysis are described elsewhere.34 In brief, the meta-analysis included 37 382 of European ancestry from 27 studies and 8376 Asian participants from five studies. All participants were aged 25 or older; mean age and RE (measured as spherical equivalent) in the European ancestry population were 55.7 (SD = 12.3) and −0.1 (SD = 0.76), respectively, and in the Asian ancestry population 55.8 (SD = 5.54) and −0.34 (SD = 1.52). Descriptions of each study cohort included in the CREAM GWAS are in Supplementary Table 2, available as Supplementary data at IJE online. In our association analysis we regressed RE on each SNP of interest, with age, sex and principal components included as covariates (number of principal components included varied between studies). LD-score regression analysis35 found little evidence of population stratification (LD-score intercept = 1.04). Each of the relevant SNPs was present in 25 or more of the European ancestry studies and in all the Asian studies. Measurements of 25(OH)D level, vitamin D supplementation and of outdoor behaviour were not available on most participants. Not having direct 25(OH)D measurements available is not a limitation because we intentionally used genetically determined 25(OH)D levels. Although being able to correct for confounding factors such as outdoor behaviour would slightly reduce the confidence intervals on our estimates, not having this information is not of major importance in our MR analysis because, subject to the MR assumptions (discussed below), any confounders (such as time spent outdoors) are randomized with respect to genetically predicted 25(OH)D levels.
Due to hyperopic shifts in older individuals, and to be able to better compare our results with those from Yazar et al.,20 we also performed this analysis using data from three younger cohorts: the Brisbane Adolescent Twin Study (BATS), the Twin Eye Study in Tasmania (TEST) and ALSPAC. We included 3732 individuals from the BATS and TEST cohorts (mean age = 16.90) and 3791 individuals from ALSPAC whose RE was measured at age 15. The genotyping and phenotyping procedures are detailed elsewhere for ALSPAC,19,36 BATS37 and TEST.38
In order to test the MR assumptions (described in the next section), we used individual-level data from the TwinsUK cohort. The TwinsUK adult twin registry, based at St Thomas' Hospital in London, comprises over 12 000 predominantly female European ancestry twins, from throughout the UK.39 Twins who volunteered were largely unaware of the eye studies at the time of enrolment and gave fully informed consent under a protocol reviewed by the local research ethics committee (EC04/015), in accordance with the Helsinki Declaration. Non-cycloplegic measures of refraction were used and the mean of the two eyes was considered. Other phenotypes were not necessarily measured at the same time as RE. The concentration of 25(OH)D was measured in serum (units = nmol/l). Smoking status (never = 0, ex-smoker = 1, current smoker = 2), years of education, and vitamin D supplementation were assessed through questionnaire. Body mass index (BMI) was measured during clinical assessment. Socioeconomic status was graded from 1 to 5, using the Index of Multiple Deprivation score which is based on the individual’s place of residence in the UK. Genotyping was carried out using two genotyping platforms: the HumanHap300k-Duo for part of the TwinsUK Cohort and the HumanHap610-Quad for the rest of the TwinsUK Cohort. Imputation was conducted with reference to HapMap 2 CEU population using IMPUTE2. Only 484 individuals from the TwinsUK cohort had all the relevant variables.
Statistical analysis
Afzal et al.27 reported precise effect estimates for rs7944926 in DHCR7 and rs12794714 in CYP2R1, showing that each SNP is estimated to reduce the concentrations of 25(OH)D by 2–3 nmol/l per risk allele and to explain between 0.3% and 0.6% of the total variance in 25(OH)D concentrations. Similarly, Mokry et al.28 reported effect estimates of rs10741657 in CYP2R1, rs12785878 in DHCR7, rs2282679 in GC and rs6013897 in CYP24A1 on natural-log-transformed 25(OH)D level. In order to make the effect sizes comparable to those reported by Afzal et al., we transformed the effect estimates from natural logarithm to the natural scale using an intercept at e4 (∼54.59) nmol/l of 25(OH)D.29 Based on these effect parameters and those from the myopia GWAS meta-analysis, we estimated the effect of 25(OH)D on RE using a Wald-type ratio estimator.30 The standard error from this ratio estimate was approximated using the delta method.40 We present separately the estimated effect of 25(OH)D on RE using (i) the variants with effect estimates extracted from Afzal et al. and (ii) the four variants used in Mokry et al.
Where possible, we tested the three fundamental MR assumptions to ensure the validity of the IV:26, 30 (i) the IV must be strongly associated with the exposure variable; (ii) the IV is not associated with potential confounders; and (iii) the IV is only associated with the outcome variable (RE) via the exposure (25(OH)D levels) (Figure 1). For assumption (i), there is very strong evidence that the four SNPs we selected are robustly associated with 25(OH)D levels.27,31,32 Additionally, in the TwinsUK Study, where individual data were available, we showed a clearer association between an allele score containing these four SNPs and the 25(OH)D level. To test assumption (ii), we performed a series of linear regressions between the aggregated allele score and smoking, BMI, education and socioeconomic status. Assumption (iii) is difficult to test directly–however, the SNPs chosen play clear roles in vitamin D synthesis in the skin and metabolism in the liver and yet have no obvious biological link to the development of RE other than through vitamin D.
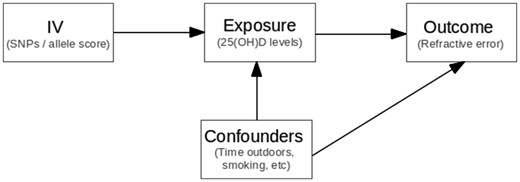
Mendelian randomization assumptions. (i) SNPs (instrumental variable) are robustly associated with 25(OH)D concentrations (exposure variable); (ii) SNPs are not associated with the confounders; (iii) SNPs are associated with refractive error (outcome variable) through their effect on 25(OH)D concentrations.
Results
Based on the effects of the SNPs in DHCR7, CYP2R1, GC and CYP24A1 on 25(OH)D concentrations27,28 and their effects reported in the CREAM GWAS of RE in adults aged over 25 (N = 37 382 for Europeans and N = 8376 for Asians),34 the association between 25(OH)D concentration and RE was not statistically significantly different from 0 (i.e. the estimates for Europeans βiv varied from -0.09 to 0.06 dioptres (D) per 10 nmol/l and from -0.09 to 0.22 for Asians, and confidence intervals overlapped with 0) (Table 1). Likewise, the estimates based on the effects of the SNPs in RE in three younger cohorts of European descent [TEST, BATS and ALSPAC (N = 7523), mean age ∼ 16] ranged from -0.12 to 0.19 with wider standard errors (Table 1).
Effect estimates (β) and standard errors (SE) of the instrumental variables (SNPs) on 25(OH)D concentrations and refractive error (RE)
| Effect on 25(OH)D (10 nmol/l)a | RE Europeans N = 37382b | RE Europeans young cohorts N = 7523c | RE Asians N = 8376b | |||||||||||||||
|---|---|---|---|---|---|---|---|---|---|---|---|---|---|---|---|---|---|---|
| SNP (gene) | EA/ NEA | βzx | SEzx | R2 | βzy | SEzy | βiv | SEiv | βzy | SEzy | βiv | SEiv | βzy | SEzy | βiv | SEiv | ||
| Based on SNPs used in Afzal et al.27 | ||||||||||||||||||
| rs7944926 (DHCR7) | A/G | −0.20 | 0.019 | 0.4% | −0.011 | 0.018 | 0.06 | 0.09 | −0.038 | 0.025 | 0.19 | 0.13 | 0.020 | 0.042 | −0.1 | 0.21 | ||
| rs12794714 (CYP2R1) | A/G | −0.30 | 0.022 | 0.6% | −0.015 | 0.016 | 0.05 | 0.05 | 0.036 | 0.021 | −0.12 | 0.07 | 0.015 | 0.042 | −0.05 | 0.14 | ||
| Combined | − | − | − | 1% | − | − | 0.05 | 0.05 | − | − | −0.05 | 0.06 | − | − | −0.06 | 0.12 | ||
| Based on SNPs used in Mokry et al.28 | ||||||||||||||||||
| rs10741657 (CYP2R1) | C/T | −0.28 | 0.07 | 0.6% | 0.007 | 0.017 | −0.02 | 0.06 | 0.034 | 0.021 | −0.12 | 0.08 | 0.024 | 0.050 | −0.09 | 0.18 | ||
| rs12785878 (DHCR7) | G/T | −0.31 | 0.07 | 0.6% | −0.009 | 0.019 | 0.03 | 0.06 | −0.035 | 0.028 | 0.12 | 0.09 | 0.025 | 0.042 | −0.08 | 0.14 | ||
| rs2282679 (GC) | C/A | −0.26 | 0.07 | 0.5% | 0.021 | 0.018 | −0.09 | 0.07 | −0.044 | 0.023 | 0.17 | 0.09 | −0.038 | 0.039 | 0.15 | 0.15 | ||
| rs6013897 (CYP24A1) | A/T | −0.15 | 0.08 | 0.1% | 0.012 | 0.020 | −0.08 | 0.13 | 0.008 | 0.027 | −0.05 | 0.19 | −0.032 | 0.042 | 0.22 | 0.29 | ||
| Combined | − | − | − | 1.8% | − | − | −0.02 | 0.03 | − | − | 0.03 | 0.05 | − | − | 0.01 | 0.09 | ||
βzx refers to the effect of the SNP on 25(OH)D, βzy refers to the effect on RE and βiv shows the causal effect estimates [dioptres (D) per 10 nmol/l 25(OH)D increase].
EA/NEA: effect allele/non-effect allele.
aEffect estimates were extracted from Azfal et al.27 or Mokry et al.28, respectively. Standard errors and R2 estimates based on Mokry et al. were computed from the reported F-statistics.
bEffect estimates are based on those from the large RE GWAS meta-analysis from CREAM.34
cEffect estimates were computed using data from young individuals from the TEST, BATS and ALSPAC cohorts (mean age 16).
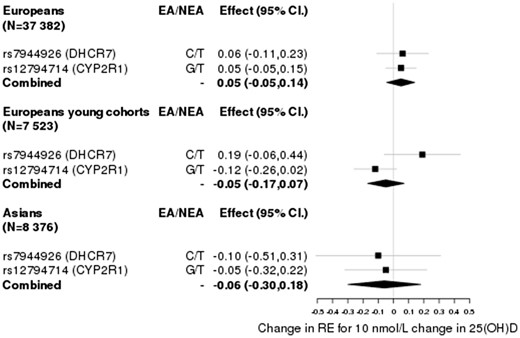
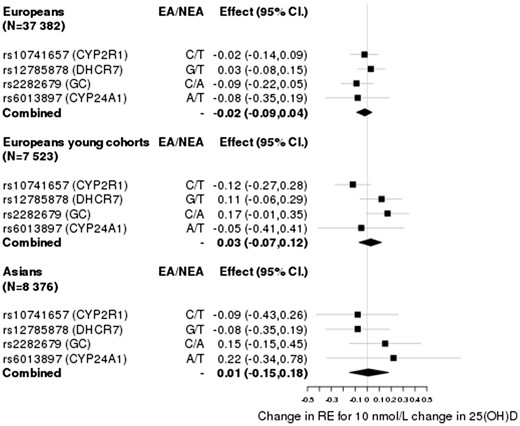
Given that each of the SNPs explain just a small fraction of the variance in 25(OH)D levels (0.3–0.6%), we investigated if their aggregated effect had an effect on RE. We computed an inverse-variance weighted estimate of the effect, combining the ratio estimate of rs7944826 and rs12794714 based on effects on vitamin D from Afzal et al., and obtained estimates of = 0.05 ± 0.05 (P > 0.05) for Europeans, = −0.05 ± 0.06 (P > 0.05) for the young Europeans and = −0.06 ± 0.12 (P > 0.05) for Asians (Figure 2). Similarly, based on the effects for rs10741657, rs12785878, rs2282679 and rs6013897 from Mokry et al., we obtained estimates of = −0.02 ± 0.03 (P > 0.05) for Europeans, = 0.03 ± 0.05 (P > 0.05) for the young Europeans and = 0.01 ± 0.09 (P > 0.05) for Asians (Figure 3). Given that the DHCR7 locus has been shown to be influenced by population stratification41 and that the SNP in CYP24A1 may be regarded as a weak instrument, we estimated the causal effect by excluding each or both of these loci from the analysis as a robustness check. These yielded similar estimates with confidence intervals overlapping with 0 [Supplementary Figures 1–3, available as Supplementary data at IJE online].
Using individual-level data from the TwinsUK study (N = 484) (individual-level data were not available within the wider CREAM study) we tested the MR assumptions (Figure 1). Table 2 shows the effect estimates and partial correlations between the relevant SNPs and 25(OH)D level, including age, sex, vitamin D supplementation, smoking, BMI, education and socioeconomic status as covariates. Overall, the SNPs were clearly associated with 25(OH)D concentrations with the exception of rs6013897; the strongest association was observed for rs10741657 (R2 = 2.13%; P = 1.2 × 10⁻³). The SNPs were not associated with any of the potential confounders (i.e. BMI, smoking, socioeconomic status or vitamin D supplementation). Multivariable linear regression showed no statistically significant association between 25(OH)D levels and RE (βvitD = 0.03 ± 0.03; P = 0.35)–however, this estimate was not statistically significantly different from Yazar et al. (Pdiff = 0.28). As expected, education was negatively associated with RE (P = 0.001). Socioeconomic status, vitamin D supplementation, smoking and BMI were not associated with RE (P > 0.05).
Association between the IVs and 25(OH)D concentrations after adjusting for potential confounders (vitamin D supplementation, sex, age, smoking, BMI, education and socioeconomic status) in the TwinsUK cohort
| TwinsUK (N = 484) 25(OH)D | |||
|---|---|---|---|
| SNP (IV) | βzx | SEzx | R2 |
| rs11234027 A/G | −6.35 | 3.46 | 0.70% |
| rs7944926 A/G | −3.81 | 2.85 | 0.40% |
| rs10741657 C/T | −8.47 | 2.59 | 2.10% |
| rs12794714 A/G | −5.4 | 2.49 | 0.90% |
| rs2282679 C/A | −3.72 | 1.38 | 0.36% |
| rs6013897 A/T | −1.79 | 1.59 | 0.02% |
We assessed the possibility of pleiotropy further by examining GWAS summary statistics of BMI,42 smoking43 and education44 from very large samples. We found that none of the SNPs was associated with these traits after correcting by four tests (four loci) (Supplementary Table 3, available as Supplementary data at IJE online).
Discussion
In this work, we presented an MR study assessing the relationship between 25(OH)D levels and RE. Our results showed no evidence of an association between genetically determined 25(OH)D levels and degree of RE. However, as it is difficult to prove that an exposure has no effect at all (e.g. the effect is too small to be detected), we show that if it exists it is likely to be in the range of: = −0.02 (95% CI -0.09, 0.04) dioptres (D) per 10 nmol/l increase in 25(OH)D concentrations in older Europeans; = 0.01 (95% CI -0.17, 0.19) in younger Europeans; and = 0.03 (95% CI -0.07, 0.12) in Asians. These results suggest that the association observed in previous studies20–23 is likely confounded by residual effects of increased time outdoors.
A study from Choi et al.21 involving 2038 adolescents from South Korea showed a statistically significant association between 25(OH)D concentrations and RE; however, time spent outdoors was not entirely accounted for (i.e. physical exercise and area of residence were investigated but not outdoor time). A subsequent study20 involving young adults from Western Australia also reported that participants with low 25(OH)D3 levels were more likely to be myopic even after accounting for the effect of time spent outdoors and conjunctival UV autofluorescence;20 nonetheless, 25(OH)D3 concentration is particularly affected by the amount of sun exposure, and given that time outdoors is hard to measure accurately, it is possible that there was residual confounding (i.e. in observational studies even if correction is made for confounders, confounding may remain if the confounders are inaccurately measured). More recently, another study involving 2666 children (mean age = 6.12) found that low 25(OH)D level was associated with longer axial length and increased myopia risk. This association, although it remained statistically significant, was attenuated once time outdoors was fit into the model.23 However, two larger studies failed to show an independent association between 25(OH)D and myopia. A study of 3677 participants from ALSPAC19,24 found no independent association between incident myopia and either 25(OH)D2 (derived from fortified foods and vitamin supplements) or 25(OH)D3, after adjusting for time outdoors and year and season of blood sample collection. Similarly, the European Eye Study found no independent association between 25(OH)D3 and degree of myopia.25
Whether 25(OH)D concentrations cause myopia could be investigated via an RCT. However, this is costly and not always feasible. Instead here we use MR, which is considered as a natural ‘RCT’ in up to 34 000 individuals, to test whether vitamin D has a role in RE. A strength of MR is that it allow us to measure differences in lifetime exposure, whereas an RCT just describes the effect during the time of the study. Since we demonstrate no relationship over the lifetime, it is unlikely that an RCT over a shorter period would draw different conclusions (for this to happen, an unlikely series of events is required, e.g. the effect of vitamin D increases cause X units of increase in myopia for ages 5–9, followed by the effect of vitamin D increases causing exactly X units of decrease in myopia for some later time period, such that over the lifetime any causal events exactly cancel out).
One of the strengths of our study is that the genetic variants we used are a robust proxy for 25(OH)D levels and have well understood roles in vitamin D synthesis and metabolic pathway. Although these SNPs have a small effect on 25(OH)D levels, the underlying principle with instrumental variable analysis is that one intentionally carves out a small component of the overall trait variation that is not affected by confounding. Providing that the overall sample size of individuals with genotype and myopia data available is high, our overall power will be high, even when the effect of each SNP on 25(OH)D is small. Instrumental variable estimates in our first analysis took advantage of the large samples sizes (37 382 Europeans and 8376 Asians) of the CREAM GWAS meta-analyses and an extra sample of 7523 young Europeans, allowing us to estimate effect sizes with tight confidence intervals. These confidence intervals are evidence that our study is well powered to detect very small effects.45
To the maximum extent possible, we have tested the MR assumptions using individual-level data from the TwinsUK study and publicly available GWAS summary statistics, and followed the MR reporting checklist.46 We found no evidence for the SNPs we used being associated with measured confounding variables. In the unlikely event that there is confounding due to 25(OH)D-associated SNPs being associated with an unmeasured confounding variable [MR assumption (ii)], for us to reach the conclusion we did (zero effect), there would have to be a true effect of 25(OH)D levels on RE which was exactly cancelled out by a confounding variable acting in the opposite direction and of the same magnitude.47 Nevertheless, a number of limitations must be acknowledged. In the first part of our analysis, we did not have the actual effect estimates of the relevant genetic variants on the 25(OH)D levels of CREAM participants. Instead, the effects were computed using an approximation based on the effects estimated by Afzal et al.27 and Mokry et al.28 It must be noted that any inaccuracy in estimates of the effect of each SNP may have caused a variation in the magnitude of our MR estimates. However, our conclusions regarding the significance of the effect remain valid providing that the SNPs for 25(OH)D level constitute a strong instrument [i.e. if the SNPs are unambiguously associated with 25(OH)D level]. Although the estimates of the effect size for each of our SNPs on 25(OH)D levels vary across different published studies (across different ancestries), the SNPs are clearly statistically significantly associated with 25(OH)D level, with the main determinant of the variation in effect size estimates being the small sample size in most studies (compared with the highly precise estimates from the 30 792 individuals in Afzal et al.27). Another limitation is that it is not possible to completely rule out a very small but genuine effect of 25(OH)D level on myopia, particularly in the case of the Asian ancestry group or the young European ancestry group.
In addition to the three primary MR assumptions listed above, an additional MR assumption is required if one wishes to compute a specific estimate for the effect of a risk factor (vitamin D levels) on an outcome (degree of myopia); this assumption states that the effect of the risk factor on the outcome is linear. Whereas this may not be strictly true, especially in the case of very large or very small 25(OH)D values, our results would not change materially, because differences in scaling would still result in very small estimates for the effect of 25(OH)D level on degree of myopia.
In conclusion, our MR estimates do not support a direct involvement of vitamin D with myopic RE, as individuals genetically predisposed to lower 25(OH)D levels were not more myopic than expected. In contrast to observational studies, our estimates are very unlikely to be confounded by time outdoors, which is a consideration of substantial importance given the relation of time outdoors to myopic RE and 25(OH)D levels.
Supplementary Data
Supplementary data are available at IJE online.
Funding
G.C.-P. is supported by scholarship from the University of Queensland and QIMR Berghofer Medical Research Institute. S.M. is supported by an Australian Research Council Future Fellowship. R.L. is supported by a National Health and Medical Research Career Development Fellowship. D.A.M. acknowledges support from NHMRC(grant APP1021105). K.M.W. acknowledges support from a Medical Research Council (UK) Clinical Research Training Fellowship. and P.G.H. a Fight for Sight Early Career Investigator Award. T.L.Y. is supported by National Institutes of Health/ National Eye Institute (NIH/NEI; 1R01EY018246‐01, NIH/ NEI R01 EY014685), Research to Prevent Blindness Inc. and University of Wisconsin School of Medicine and Public Health Centennial Scholars Fund. TwinsUK: the study was funded by the Wellcome Trust and European Community’s Seventh Framework Programme (FP7/2007‐2013). The study also receives support from the National Institute for Health Research (NIHR)-funded BioResource, Clinical Research Facility and Biomedical Research Centre based at Guy’s and St Thomas’ NHS Foundation Trust in partnership with King’s College London. SNP genotyping was performed by the Wellcome Trust Sanger Institute and National Eye Institute via NIH/CIDR. Funding support for SNP genotyping was also provided by the National Institutes of Health (1R01EY018246).
Acknowledgements
Data on refractive error GWAS was provided by the CREAM consortium. The list of members is included in the Supplementary material.
Conflict of interest: The authors have indicated they have no potential conflicts of interest to disclose.
References

