


Abstract
Physical activity is associated with reduced risk of colorectal cancer, but most epidemiological studies have focused on occupational and recreational physical activity. The evidence for other domains of activity, and for sedentary behaviour, is limited.
Medline, Embase and Web of Science were searched from inception to December 2015 for studies examining domain-specific physical activity or sedentary behaviour and the risk of colon and/or rectal cancer. We extracted maximally adjusted relative risks (RRs) except when RRs not adjusted for body mass index, were also presented. We used random-effects meta-analysis to compute pooled RRs comparing the highest versus the lowest level of exposure. We used meta-regression to assess sources of heterogeneity in estimates.
We identified 17 cohort and 21 case-control studies, of which 17 had occupational data, 23 had recreational data, three each had data on transport and household physical activity domains, and 6 studies had data on occupational sedentary behaviour. The pooled relative risks (RRs) for colon cancer were 0.74 (95% confidence interval (CI): 0.67, 0.82) for occupational activity, 0.80 (95% CI: 0.71, 0.89) for recreational activity, 0.66 (95% CI: 0.45, 0.98) for transport-related physical activity, 0.85 (95% CI: 0.71, 1.02) for household physical activity, and 1.44 (95% CI: 1.28, 1.62) for occupational sedentary behaviour. For rectal cancer, the pooled RRs were 0.88 (95% CI: 0.79, 0.98) for occupational activity, 0.87 (95% CI: 0.75, 1.01) for recreational activity, 0.88 (95% CI: 0.70, 1.12) for transport-related physical activity, 1.01 (95% CI: 0.80, 1.27) for household physical activity, and 1.02 (95% CI: 0.82, 1.28) for occupational sedentary behaviour.
In addition to increasing occupational and recreational physical activity, promoting physical activity during transport and reducing sedentary behaviour in the workplace may also be useful colorectal cancer prevention strategies.
Increasing the level of physical activity across multiple domains (occupation, transport, recreation) is associated with lower risk of colon cancer. Any benefit appears stronger for men than for women.
Reducing sitting time within the workplace could help lower the risk of colon cancer.
Further studies are needed to examine the relationships of sedentary behaviour in transport, household and recreation domains with the risk of colon and rectal cancers, in order to devise evidence-based preventive strategies.
Introduction
There is a convincing epidemiological evidence that physical activity reduces the risk of colon cancer but not rectal cancer.1,2 This evidence has been derived mostly from studies focused on recreational physical activity, or research that has broadly categorized occupations according to the level of physical activity involved. Evidence in relation to other domains of physical activity is limited. Household physical activity, in particular, has rarely been considered as a separate exposure in terms of colon and rectal cancer risk, despite activity in this domain being an important contributor to total physical activity in middle-aged men and women.3–5
Physical activity is a complex exposure, as patterns of accumulation (based on frequency, intensity and duration) vary across the life course; there are variations in the accrual of this exposure within different behaviour settings (domains) as well. Physical activity patterns are also linked to socioeconomic, cultural and environmental factors.6 The correlates of physical activity have been shown to vary across domains,7–9 suggesting that different domains will be differently confounded when examining associations with outcomes such as cancer risk. For example, age and gender are important correlates of household physical activity, whereas recreational activity is frequently correlated with educational attainment and household income. Thus, examining domain-specific physical activity may allow for better adjustment for confounding.
Studies have shown that among middle-aged and older adults, non-recreational physical activities account for more than 80% of overall daily activity energy expenditure.5,10 It is well recognized that recreational physical activity decreases with advancing age in adulthood.11–13 Therefore, it is important from a public health perspective to understand whether physical activity in non-recreational domains (occupational, transport and household) confers health benefits, such as reduced risk of colorectal cancer.
Sedentary behaviour is a distinct exposure that is often conceptualized as ‘sitting time’. Adults can achieve recommended levels of physical activity, yet spend a large proportion of their time in sedentary behaviours such as watching television or lying down.14 In the past, investigators often incorporated sedentary behaviours into physical activity measures, categorizing sedentary behaviours with low levels of physical activity as ‘sedentary’ or ‘insufficiently active’, rather than treating this exposure separately.3 Over the past decade, however, research interest in sedentary behaviour (as a distinct behavioural entity) and health outcomes has grown rapidly.
Previous meta-analyses of studies examining physical activity and sedentary behaviour in relation to colon and rectal cancer risk have reported relative risks (RRs) only for occupational and recreational domains of physical activity,15,16 and for total sedentary behaviour.17–19 Given the relatively small proportion of time reserved for recreation by working-aged adults, it is important to ascertain if, and by how much, activities in transport and household domains affect the risk of colon and rectal cancers. In this systematic review and meta-analysis, we examined the associations between physical activity, sedentary behaviour and the risk of colon and rectal cancers separately for occupational, recreational, transport and household domains. We also estimated dose-response relationships for these associations.
Methods
This systematic review and meta-analysis followed the Meta-analysis Of Observational Studies in Epidemiology (MOOSE) guidelines.20 A protocol was developed before starting the review and registered with the International Prospective Register Of Systematic Reviews–PROSPERO (Registration No. CRD42014015066).
Eligibility criteria
Eligibility criteria for studies included: (i) cohort and case control studies; (ii) studies of adults (men and/or women); (iii) studies investigating the risk of colon and/or rectal cancer; (iv) studies reporting domain-specific (one or more from occupational, recreational, transport-related and household domains) physical activity or sedentary behaviour; and (v) studies presenting adjusted relative risk (RR) in terms of risk ratios, hazard ratios or odds ratios with corresponding 95% confidence intervals (CIs), or providing sufficient data for us to calculate these measures of association.
We did not include studies where the exposure of interest was described as total physical activity, lifetime physical activity or total sitting time without mentioning a particular domain. We also excluded studies that combined physical activity and sedentary behaviour into a single exposure variable. We did not include editorials, letters, conference abstracts or proceedings.
Search strategy
We searched Medline (from 1946), Embase (from 1947), Web of Science (Science Citation Index Expanded and Social Sciences Citation Index, Conference Proceedings Citation Index-Science; from 1900) and CINAHL (Cumulative Index to Nursing and Allied Health Literature; from 1981) to 31 December 2015 for studies published in English that assessed associations between domain-specific physical activity and sedentary behaviour with the risk of colon or rectal cancers.
The search strategy comprised medical subject headings (MeSH) and keywords: (‘motor activity’ OR ‘exercise’ OR ‘physical activity’ OR ‘walking’ OR ‘sport’ OR ‘leisure-time activity’ OR ‘recreation’) AND (‘cancer’ OR ‘neoplasm’ OR ‘tumour’ OR ‘carcinoma’) AND (‘colon’ OR ‘rectal’ OR ‘bowel’ OR ‘colorectal’) AND (‘sedentary lifestyle’ OR ‘sedentary behaviour’ OR ‘sedentary time’ OR ‘screen time’ OR ‘television viewing’ OR ‘computer work’ OR ‘sitting time’). Physical activity and sedentary behaviour terms were separately explored with colon and rectal cancer search terms to identify relevant titles and abstracts. In addition, we manually searched the reference lists of retrieved papers and published systematic reviews,15–19 to find any further relevant studies. Auto-alert mechanisms available on these electronic databases were used to receive updates of the searches; no new paper on this topic was found. The first author (S.M.) screened titles and abstracts. Two authors (S.M. and B.M.L.) then independently read the full text of these initially selected articles and decided the final set for inclusion by consensus. If multiple publications from a continuing cohort study or on the same study population were found, the results from the most recent report were selected.
Data extraction
Data were independently extracted by S.M. and B.M.L. Differences were resolved by discussion with D.R.E. For each study, we extracted: the first author’s last name, year of publication, location from where the study population was recruited, total colon and rectal cancer cases, total controls, cohort size, age and sex of participants, study design, study settings (population or hospital-based), sources of the cohort, methods of exposure ascertainment, statistical techniques used, number of cases and total years of follow-up, person-years (cohort studies), numbers of cases and controls (case control studies), cancer type, unit of exposure measurement (in terms of frequency, duration and intensity) and categories used to measure the level of physical activity and sedentary behaviour, RRs and corresponding 95% CIs. We extracted the maximally adjusted RRs. Although body mass index (BMI) could potentially mediate associations between physical activity and sedentary behaviour in relation to colon and rectal cancer (and therefore should not be adjusted for in statistical analyses), most authors included it in their multivariate models. We included these studies in this review, but examined the effect of BMI on RRs in meta-regression analyses. The extracted information was tabulated based on physical activity and sedentary behaviour in the different domains (occupational, recreational, transport and household).
Statistical analysis
Primary meta-analyses
Random-effects meta-analysis was used to estimate summary RRs separately for colon and rectal cancers in relation to the level of physical activity and sedentary behaviour for each domain. We compared the highest versus the lowest level of exposure (reference) for each of the physical activity and sedentary behaviour measures. For studies that used the opposite reference categories, we calculated the reciprocals of the reported RRs and confidence intervals (CIs). We combined sex-specific RRs from each study before pooling. Statistical heterogeneity between studies was tested using the Q statistic and quantified by the I2 statistic.21 Publication bias was assessed by visual inspection of funnel plots and statistically using Egger’s regression asymmetry test.22
Meta-regression analyses
Random-effects meta-regression was used to investigate whether the RRs differed by sex, study design (cohort, case-control), cancer sub-site (colon, rectum), region (North America, Asia, Europe), publication period (before year 2000 or from year 2000) and whether the RRs were adjusted for BMI. We restricted the meta-regression analyses to occupation (n = 15 studies) and recreation (n = 17) domains, since only three studies each for transport and household domains, and six studies for the occupational sedentary behaviour domain, were available for such analyses. The change in τ2 (tau-squared) was used to assess the contribution to between-study heterogeneity of each covariate.23
Dose-response analyses
We estimated dose-response relationships for occupational and recreational physical activity; there were too few studies within the other domains of physical activity and of sedentary behaviour. These estimations were restricted to studies that: (i) had at least three categories of exposure, and (ii) presented estimates as metabolic equivalents (MET) h/week or provided sufficient information to allow us to compute MET h/week using the Compendium of Physical Activities.24 For occupational physical activity, we assumed a 35-h working week. We used the mid-points of each category of physical activity for the dose-response analyses.25 When the lowest category was open-ended (e.g. <7), we took the mid-point between zero and the upper boundary; and for the highest categories (e.g. ≥30), we added the width of the second highest category to the lower boundary. Summary RRs from random-effects dose-response meta-analyses26–28 are presented for increments of 210 MET h/week for occupational activity and 20 MET h/week for recreational activity. For occupational physical activity, the chosen value represents the average intensity level covering various occupations (using average MET value of 6 and assuming working for 35 h per week); whereas for recreation, this value corresponds to energy expenditure by walking for 40 min per day, or running for 30 min a day or bicycling (at speed of 15 km/h) for 30 min a day, all for at least 6 days a week.
We also examined potential nonlinear relationships of occupational and recreational physical activity with colon and rectal cancers. Physical activity in these domains was modelled using restricted cubic splines (three knots at fixed percentiles of 10%, 50% and 90% of the distribution) and these models were compared with linear models by using the likelihood-ratio test. We used random-effects meta-regression to investigate whether the dose-response relationships varied by sex and cancer sub-site. It was not possible to estimate τ2 in these analyses.
Results
Study selection
We identified 3351 articles from the electronic database search, and three39,42,62 from the manual search (Figure 1). All studies were published in English. Of these, 38 articles2,29–65 were deemed eligible for full-text review.
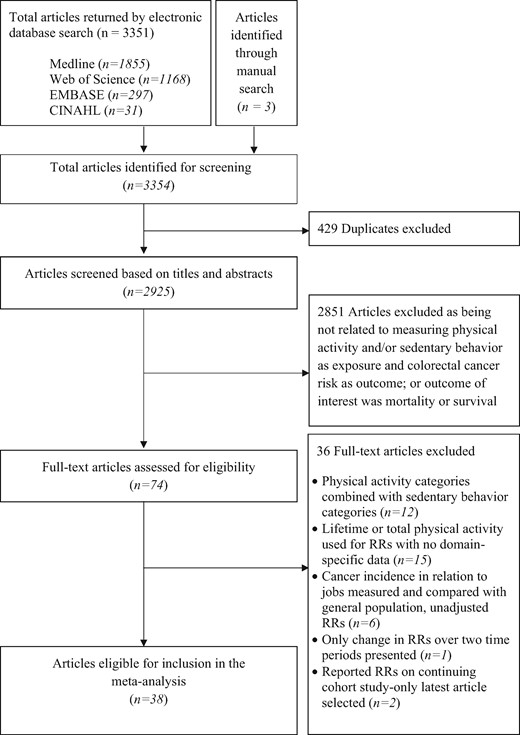
Flow diagram illustrating the process of study selection for systematic review and meta-analysis.
Study characteristics
Table 1 and Supplementary Table 1 (available as Supplementary data at IJE online) describe the salient characteristics of the 38 studies. There were 17 cohort and 21 case control studies, including approximately 3.5 million participants, of whom 37 207 had colon cancer and 21 115 had rectal cancer. Twenty studies examined occupational physical activity 31,36,38,40,46–52,55–57,59,64 and 23 studies looked at recreational physical activity,29,30,32–36,39,41–43,46–48,50,51,53–55,57–60 whereas only three studies each investigated transport29,37,51 and household35,36,59 physical activity. Six studies assessed occupational sedentary behaviour29,44–46, 62,65 and two assessed recreational sedentary behaviour,30,56 but no study was found that investigated sedentary behaviour for the transport and household domains.
Characteristics of studies on domain-specific physical activity and sedentary behaviour in relation to colon and rectal cancer risk
| First author, year | Location | Study setting | Cohort size/ controls | Age (years) | Sex | Number of Cases | Physical activity domains | Sedentary behaviour domains | Exposure ascertainment |
|---|---|---|---|---|---|---|---|---|---|
| Cohort Studies | |||||||||
| Simons, 201329 | Netherlands | Population | 120,852 | 55‐69 | M,W | C:2174,R:716 | Rec, Tpt | Occ | Self-reports |
| Howard, 200830 | United States | Retired persons | 488,720 | 50‐71 | M,W | C:3410,R:1312 | Rec | Rec | Self-reports |
| Moradi, 200831 | Sweden | Census records | 922,266 | 40‐85 | M,W | C:7900,R:5328 | Occ | – | Job titles |
| Nilsen, 200832 | Norway | Population | 59,369 | ≥20 | M,W | C:736,R:294 | Rec | – | Self-reports |
| Takahashi, 200737 | Japan | Population | 41,988 | 40‐64 | M,W | C:151,R:109 | Tpt | – | Self-reports |
| Wolin, 200733 | United States | Nurses | 79,295 | 40‐65 | W | C:547 | Rec | – | Self-reports |
| Friedenreich, 200635 | Europe | Population | 413,044 | 35‐70 | M,W | C:1094,R:599 | Rec, HH | – | Interviews |
| Larsson, 200636 | Sweden | Population | 45,906 | 45‐79 | M | C:309,R:190 | Rec, HH | – | Self-reports |
| Occ | – | ||||||||
| Chao, 200434 | United States | Population | 151,174 | 50‐74 | M,W | C:940,R:390 | Rec | – | Self-reports |
| Colbert, 200138 | Finland | Male smokers | 29,133 | 50‐69 | M | C:152,R:104 | Occ | – | Self-reports |
| Lee, 199739 | United States | Male physicians | 21,807 | 40‐84 | M | C:217 | Rec | – | Self-reports |
| Thune, 199640 | Norway | Population | 81,516 | 20‐69 | M,W | C:335,R:228 | Occ | – | Self-reports |
| Giovannucci, 199541 | United States | Health professionals | 47,723 | 40‐75 | M | C:203 | Rec | – | Self-reports |
| Albanes, 198942 | United States | Population | 12,554 | 25‐74 | M,W | CRC:128 | Rec | – | Self-reports |
| Wu, 198743 | United States | Retired persons | 11,644 | 64‐85 | M,W | CRC:126 | Rec | – | Self-reports |
| Gerharrdsson, 198645 | Sweden | Census records | 1,100,000 | 20‐64 | M | C:6972,R:5184 | – | Occ | Job titles |
| Garabrant, 198444 | United States | Cancer registry | NR | 20‐64 | M | C:2950,R:1213 | – | Occ | Job titles |
| Case Control Studies | |||||||||
| Boyle, 2011(2,46) | Australia | Population | 996 | 40‐79 | M,W | C:552,R:318 | Rec, Occ | Occ | Self-reports |
| Parent, 201147 | Canada | Population | 533 | 35‐70 | M | C:496, R:248 | Rec, Occ | – | Interviews |
| Boutron-Ruault, 200948 | France | Population | 309 | 30‐79 | M, W | CRC: 171 | Rec, Occ | – | Self-reports |
| Isomura, 200649 | Japan | Population | 767 | 20‐74 | M, W | C:438, R:340 | Occ | – | Job titles |
| Zhang, 200650 | United States | Driver’s license | 2,172 | 40‐85 | M, W | C: 685 | Rec, Occ | – | Self-reports, |
| record | – | Job titles | |||||||
| Hou, 200451 | China | Population | 1,552 | 30‐74 | M, W | C: 931 | Rec, Occ | – | Self-reports |
| Tpt | |||||||||
| Mao, 200354 | Canada | Population | 3,106 | 20‐76 | M, W | R:1447 | Rec | – | Self-reports |
| Slattery, 200355 | United States | Population | 1,205 | 30‐79 | M, W | R:952 | Rec, Occ | – | Interviews |
| Yeh, 200353 | Taiwan | Hospital | 736 | 19‐85 | M, W | C:352, R:375 | Rec | – | Interviews |
| Steindorf, 200056 | Poland | Hospital | 180 | 50‐71 | M, W | CRC: 180 | Occ | Rec | Interviews |
| Levi, 199957 | Switzerland | Hospital | 491 | 35‐74 | M, W | CRC: 223 | Rec, Occ | – | Interviews |
| Tang, 199958 | Taiwan | Hospital | 163 | 33‐80 | M, W | C:69, R:91 | Rec | – | Self-reports |
| White, 199559 | United States | Population | 427 | 30‐62 | M,W | C:444 | Occ, Rec | – | Interviews |
| HH | |||||||||
| Longnecker, 199560 | United States | Population | 703 | ≥30 | M,W | R:242 | Rec, Occ | – | Interviews |
| Arbman, 199362 | Sweden | Population | 801 | 40‐75 | M,W | C:98,R:79 | Occ | Self-reports | |
| Markowitz, 1992 63 | United States | Hospital | 1,164 | NR | M | C:307,R:136 | Occ | – | Job titles |
| Vetter, 199265 | Turkey | Hospital | 486 | 14‐97 | M,W | C:107 | – | Occ | Self-reports |
| Brownson, 199161 | United States | Cancer registry | 15,551 | ≥20 | M | C:1596 | Occ | – | Job titles |
| Kato, 199052 | Japan | Cancer registry | 16,600 | ≥20 | M | C:1716,R:1611 | Occ | – | Job titles |
| Slattery, 199064 | United States | Population | 384 | 40‐79 | M,W | C:229 | Occ | – | Interviews |
C, colon cancer; R, rectal cancer; CRC, colorectal cancer; M, men; W, women; NR, not reported; Rec, recreational physical activity; Occ, occupational physical activity; HH, household physical activity; Tpt, transport related physical activity.
Occupational physical activity
Seventeen studies were included in the analysis of occupational physical activity31,36,38,40,46,47,49–52,55,59–64). Boutron-Ruault et al.48 Steindorf et al.56 and Levi et al.57 were not included because they did not give RRs separately for colon and rectal cancers. Of these 17 studies, seven were conducted in the USA50,55,59–61,63,64, five in North Europe,31,36,38,40,62 two in Japan49,52 and one each in Australia,46 Canada47 and China.51 Exposure was assessed by self-reports36,38,40,47,51,55,56,59,60,62,64 and indirectly from job titles.31,46,49,50,52,61,63 Variable methods were used to measure the extent of physical activity in occupations, ranging from enquiring about the years spent in active jobs62,64 to asking whether the jobs involved light activity only (i.e. occasional walking) or doing heavy manual labour.38,40,49,60 Four studies combined the frequency, duration and intensity of activity in terms of MET h/week.36,47,55,59 Ten studies presented RRs for both colon and rectal cancers,31,36,38,40,46,47,49,52,62,63 whereas five50,51,59,61,64 provided information on colon cancer alone and two55,60 only on rectal cancer.
Occupational physical activity was inversely associated with risk of colon cancer (highest versus lowest category of occupational activity: RR = 0.74, 95% CI: 0.67, 0.82) (Figure 2). Occupational activity was also inversely associated with rectal cancer risk, although the association was weaker (RR = 0.88, 95% CI: 0.79, 0.98). There was low heterogeneity in the RRs for colon cancer (I2 = 34%, P = 0.10) and for rectal cancer (I2 = 23%, P = 0.22). Funnel plots appeared symmetrical (Supplementary Figure 1, available as Supplementary data at IJE online) and we found little evidence of publication bias using Egger’s regression asymmetry test (P = 0.15).
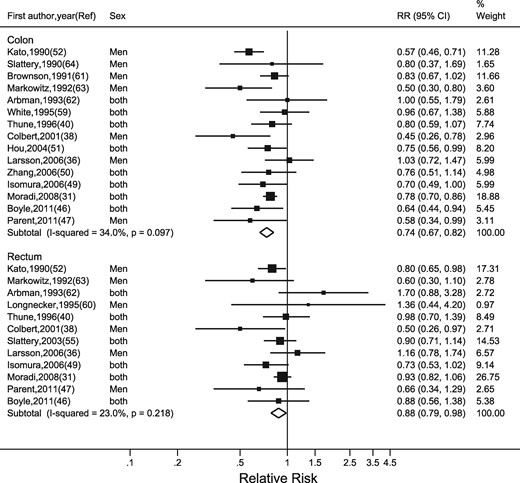
Random-effects meta-analysis of the adjusted relative risk (RR) of colon and rectal cancer for the highest versus lowest level of occupational physical activity. The black square and the horizontal lines indicate the RR and 95% confidence interval (CI) of each study. The sizes of the black squares correspond to weight contribution by each study. The diamond represents the pooled RR and corresponding CI.
The meta-regression analyses showed that adjustment for BMI, period of publication and study region explained little of the heterogeneity for occupational physical activity. Our analyses also showed no difference by age group (Table 2). The association was stronger for men than for women, but sex also explained little of the heterogeneity. There was weak evidence that the association was stronger for case control studies than for cohort studies, and stronger for colon cancer than for rectal cancers. In a model that included sex and cancer sub-site, there was no evidence that the difference in pooled RR by sex was modified by cancer sub-site or vice versa.
Results of meta-regression analyses on individual study characteristics for studies included in primary meta-analysis investigating the association between occupational physical activity and the risk of colon and rectal cancers
| Covariates | Number of RRs | Number of studiesb | RR | 95% CI | I (%) | τ2 | Ratio of RRs | 95% CI | P value |
|---|---|---|---|---|---|---|---|---|---|
| Model with no covariates | 33 | 15 | 0.79 | 0.73,0.86 | 34 | 0.017 | – | – | – |
| Age (years) | |||||||||
| <50 | 20 | 8 | 0.80 | 0.72,0.88 | 36 | 0.019 | 1.00 | Referent | |
| ≥50 | 13 | 7 | 0.78 | 0.66,0.91 | 0.98 | 0.81,1.76 | 0.77 | ||
| Sexb | |||||||||
| Men | 23 | 15 | 0.78 | 0.71,0.86 | 35 | 0.018 | 1.00 | Referent | |
| Women | 10 | 7 | 0.83 | 0.70,0.98 | 1.06 | 0.87,1.29 | 0.56 | ||
| Cancer sub-siteb | |||||||||
| Colon | 19 | 13 | 0.75 | 0.67,0.82 | 25 | 0.017 | 1.00 | Referent | |
| Rectum | 14 | 10 | 0.86 | 0.77,0.97 | 1.16 | 0.99,1.35 | 0.06 | ||
| Sex and cancer sub-site | |||||||||
| Men | |||||||||
| Colon cancer | 13 | 13 | 0.74 | 0.66,0.82 | 26 | 0.011 | 1.00 | Referent | |
| Rectal cancer | 10 | 10 | 0.85 | 0.75,0.97 | 1.16 | 0.99,1.36 | 0.07 | ||
| Women | |||||||||
| Colon cancer | 6 | 6 | 0.78 | 0.65,0.93 | 36 | 0.018 | 1.00 | Referent | |
| Rectal cancer | 4 | 4 | 0.90 | 0.75,1.09 | 1.15 | 0.89,1.49 | 0.09 | ||
| Study design | |||||||||
| Cohort | 12 | 4 | 0.86 | 0.76,0.96 | 29 | 0.012 | 1.00 | Referent | |
| Case-control | 21 | 11 | 0.74 | 0.66,0.83 | 0.87 | 0.74,1.01 | 0.07 | ||
| Body mass index | |||||||||
| Not adjusted | 13 | 6 | 0.78 | 0.70,0.88 | 36 | 0.019 | 1.00 | Referent | |
| Adjusted | 20 | 9 | 0.79 | 0.70,0.91 | 1.01 | 0.85,1.19 | 0.94 | ||
| Study region | |||||||||
| North America | 13 | 8 | 0.78 | 0.67,0.91 | 36 | 0.010 | 1.00 | Referent | |
| Asia | 8 | 3 | 0.70 | 0.60,0.82 | 0.90 | 0.72,1.11 | 0.32 | ||
| Europe | 12 | 4 | 0.86 | 0.77,0.96 | 1.10 | 0.91,1.32 | 0.33 | ||
| Study period | |||||||||
| From year 2000 | 20 | 8 | 0.80 | 0.72,0.89 | 34 | 0.017 | 1.00 | Referent | |
| Before year 2000 | 13 | 7 | 0.77 | 0.67,0.88 | 0.95 | 0.79,1.14 | 0.59 | ||
CI, confidence interval; RR, Relative risk; I2, heterogeneity across studies; τ2, tau-square representing between study variability.
aMeta-regression models are fitted assuming random effects that allow for between study variance. bNumber of studies exceeds in total as not all authors presented risk estimates for colon and rectal cancers in men and women [men: both colon and rectal cancer31,36,38,40,47,49,52,63, colon cancer50,51,59,61,63, rectal cancer55,60; Women: both colon and rectal cancer31,40,49, colon cancer50,51,59 rectal cancer55].
From the dose-response analyses, the pooled RR per 210 MET h/week was 0.89 (95% CI: 0.85, 0.93) (Supplementary Table 2, available as Supplementary data at IJE online). There was little evidence of departure from linearity on visual inspection of the linear and spline models or statistically (data not shown; P for nonlinearity = 0.53). Results from the meta-regression indicated that the dose-response relationship was stronger for colon cancer than for rectal cancer, and stronger for men than for women, although in both cases the statistical evidence was weak (Supplementary Table 2).
Recreational physical activity
Of the 23 studies of recreational physical activity, 11 were conducted in the USA, six in Europe, two in Canada, one in Australia and three in China (Table 1). Seven studies used in-person or telephone-administered interviews to collect exposure data,35,47,53,55,57,59,60 whereas the remaining studies used self-administered questionnaires. There was wide variation in the completeness of exposure measurement: seven studies measured frequency of activity only,30,32,39,42,47,50,60 five measured frequency and duration29,34,36,43,57 and eight studies measured frequency, duration and intensity and combined them into MET h/week or min/week.33,35,41,46,51,54,55,59 We included 19 studies that presented RRs separately for colon and rectal cancers in the meta-analysis; the remaining four studies42,43,48,57 combined colon and rectal cancer.
The highest category of recreational physical activity was associated with a 20% lower risk of colon cancer (highest versus lowest category: RR = 0.80, 95%: 0.71, 0.89). We observed weak association with rectal cancer (highest versus lowest category of recreational physical activity: RR = 0.87, 95% CI: 0.75, 1.01) (Figure 3).
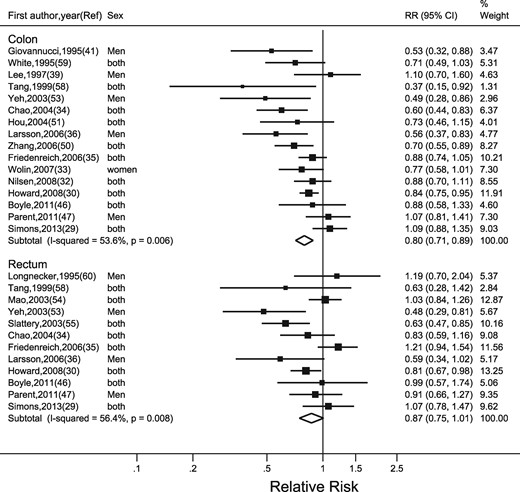
Random-effects meta-analysis of the adjusted relative risk (RR) of colon and rectal cancer for the highest versus lowest level of recreational physical activity. The black square and the horizontal lines indicate the RR and 95% confidence interval (CI) of each study. The sizes of the black squares correspond to weight contribution by each study. The diamond represents the pooled RR and corresponding CI.
There was moderate heterogeneity for colon (I2 = 54%) and rectal (I2 = 56%) cancers. The funnel plot was asymmetrical, with additional small studies showing reasonably strong inverse associations (Supplementary Figure 2, available as Supplementary data at IJE online), which was supported by Egger’s regression asymmetry test (P = 0.01).
Table 3 shows the results of meta-regression analyses on pre-specified study characteristics. There were no detectable differences in pooled RRs by age group, sex, cancer-subsite or study design. The association was strongest for studies conducted in Asia.
Results of meta-regression analyses on individual study characteristics for studies included in primary meta-analysis investigating the association between recreational physical activity and the risk of colon and rectal cancers
| Covariates | Number of RRs | Number of studiesb | RR | 95% CI | I2 (%) | τ2 | Ratio of RRs | 95% CI | p value |
|---|---|---|---|---|---|---|---|---|---|
| Model with no covariates | 36 | 17 | 0.81 | 0.74,0.89 | 40 | 0.024 | – | – | – |
| Age (years) | |||||||||
| <50 | 8 | 5 | 0.89 | 0.71,0.87 | 39 | 0.023 | 1.00 | Referent | |
| ≥50 | 28 | 12 | 0.79 | 0.75,1.06 | 0.89 | 0.72,1.08 | 0.21 | ||
| Sexb | |||||||||
| Men | 22 | 16 | 0.79 | 0.71,0.89 | 41 | 0.026 | 1.00 | Referent | |
| Women | 14 | 11 | 0.84 | 0.72,0.98 | 1.06 | 0.88,1.28 | 0.51 | ||
| Cancer sub-siteb | |||||||||
| Colon | 22 | 14 | 0.79 | 0.71,0.89 | 41 | 0.026 | 1.00 | Referent | |
| Rectum | 14 | 9 | 0.84 | 0.72,0.97 | 1.06 | 0.88,1.27 | 0.56 | ||
| Sex and cancer sub-site | |||||||||
| Men | 13 | ||||||||
| Colon cancer | 13 | 13 | 0.74 | 0.66,0.82 | 43 | 0.028 | 1.00 | Referent | |
| Rectal cancer | 9 | 9 | 0.82 | 0.69,0.96 | 1.11 | 0.85,1.37 | 0.52 | ||
| Women | |||||||||
| Colon cancer | 9 | 9 | 0.83 | 0.70,0.97 | 41 | 0.026 | 1.00 | Referent | |
| Rectal cancer | 5 | 5 | 0.88 | 0.72,1.07 | 1.06 | 0.84,1.35 | 0.58 | ||
| Study design | |||||||||
| Cohort | 17 | 8 | 0.83 | 0.74,0.94 | 41 | 0.026 | 1.00 | Referent | |
| Case-control | 19 | 9 | 0.78 | 0.68,0.89 | 0.93 | 0.78,1.12 | 0.43 | ||
| Body mass index | |||||||||
| Not adjusted | 19 | 8 | 0.77 | 0.67,0.87 | 39 | 0.023 | 1.00 | Referent | |
| Adjusted | 17 | 9 | 0.85 | 0.75,0.96 | 1.11 | 0.93,1.32 | 0.24 | ||
| Study region | |||||||||
| North America | 20 | 11 | 0.82 | 0.74,0.91 | 30 | 0.016 | 1.00 | Referent | |
| Asia | 8 | 3 | 0.55 | 0.41,0.75 | 0.68 | 0.49,0.92 | 0.01 | ||
| Europe | 8 | 3 | 0.90 | 0.76,1.06 | 1.09 | 0.90,1.32 | 0.34 | ||
| Study period | |||||||||
| From year 2000 | 27 | 12 | 0.82 | 0.74,0.90 | 41 | 0.024 | 1.00 | Referent | |
| Before year 2000 | 9 | 5 | 0.76 | 0.59,0.99 | 0.94 | 0.71,1.23 | 0.62 | ||
CI, confidence interval; RR, Relative risk; I2, heterogeneity across studies; τ2, tau-square representing between study variability.
aMeta-regression models are fitted assuming random effects, that allow for between study variance. bNumber of studies exceeds total as not all authors presented risk estimates for colon and rectal cancers in men and women [men: both colon & rectal cancer29,30,34,36,47,53,58, colon cancer32,41,50,51,59, rectal cancer54,55,60; Women: both colon & rectal cancer29,30,34, 53,58, colon cancer32, 33,50,51,59, rectal cancer54,55].
From the dose-response analyses, the pooled RR for each 20 MET h/week increment in physical activity was 0.90 (95% CI: 0.86, 0.94) (Supplementary Table 2, available as Supplementary data at IJE online). We found no evidence for departure from linearity by comparing the linear and the cubic spline models. The dose-response relationship was stronger for colon than for rectal cancers. We observed no difference in the association between recreational physical activity and colon and/or rectal cancer risk for men and women, but the stronger association for colon cancer than for rectal cancer was restricted to men (Supplementary Table 2).
Physical activity in transport and household domains
Three studies29,37,51 investigated transport-related physical activity (i.e. active commuting to work, or walking ‘to get to and from places’). We observed a strong, inverse association between the highest category of transportation physical activity and colon cancer risk (RR = 0.66, 95% CI: 0.45, 0.98), and a moderate, inverse association for rectal cancer (RR = 0.88, 95% CI: 0.70, 1.12) (Figure 4).
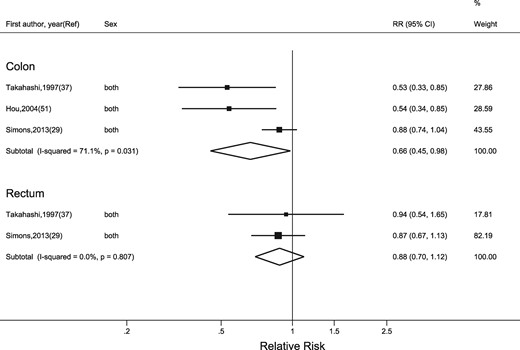
Random-effects meta-analysis of the adjusted relative risk (RR) of colon and rectal cancer for the highest versus lowest level of transport-related physical activity. The black square and the horizontal lines indicate the RR and 95% confidence interval (CI) of each study. The sizes of the black squares correspond to weight contribution by each study. The diamond represents the pooled RR and corresponding CI.
Heterogeneity between studies was high for colon cancer, but not for rectal cancer. Similarly, only three studies35,36,59 presented RRs for household physical activity. The pooled RRs for colon and rectal cancers were RR = 0.85 (95% CI: 0.71, 1.02) and RR = 1.01 (95% CI: 0.80, 1.27), respectively (Figure 5). Heterogeneity between studies was low.
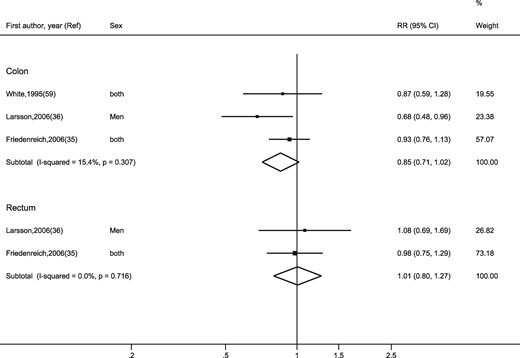
Random-effects meta-analysis of the adjusted relative risk (RR) of colon and rectal cancer for the highest versus lowest level of household-related physical activity. The black square and the horizontal lines indicate the RR and 95% confidence interval (CI) of each study. The sizes of the black squares correspond to weight contribution by each study. The diamond represents the pooled RR and corresponding CI.
Sedentary behaviour
Six studies investigated occupational sedentary behaviour.29,44–47,62,65 For colon cancer, the pooled RR for the highest versus lowest category of occupational sitting time was 1.44 (95% CI: 1.28, 1.62) (Figure 6). No association was observed for rectal cancer (RR = 1.02, 95% CI: 0.82, 1.28). We observed moderate heterogeneity for both colon (I2 = 56%) and rectal (I2 = 52%) cancers.
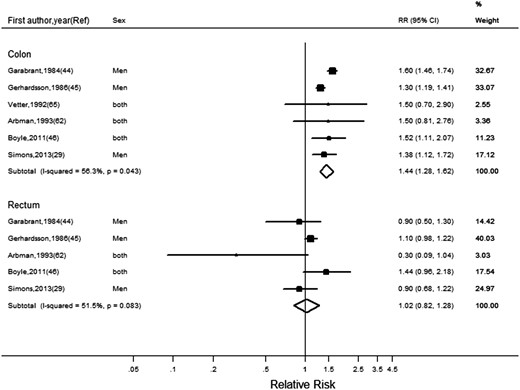
Random-effects meta-analysis of the adjusted relative risk (RR) of colon and rectal cancer for lowest (Reference) versus highest category of occupational sedentary behaviour. The black square and the horizontal lines indicate the RR and 95% confidence interval (CI) of each study. The sizes of the black squares correspond to weight contribution by each study. The diamond represents the pooled RR and corresponding CI.
We identified only two studies30,56 that examined recreational sedentary behaviour in relation to colon or rectal cancer risk. Both studies used television viewing time (h/day) as their measure of sedentary behaviour. Howard et al.30 reported that watching television for more than 9 h/day (compared with less than 3 h/day) was associated with increased risk of colon cancer in men (RR = 1.56, 95% CI: 1.11, 2.20) and women (RR = 1.45, 95% CI: 0.99, 2.13). Steindorf et al.56 also reported the strong association between television viewing time (≥2 versus <1.14 h/day) and colorectal cancer risk in both men and women (RR = 2.22, 95% CI: 1.23, 4.17) (Supplementary Table 1).
Discussion
The findings from this systematic review and meta-analysis suggest that higher physical activity within the occupational domain was associated with a lower risk of colon and rectal cancer in both men and women, though this association was slightly stronger for colon cancer. Similar results were observed for the recreational physical activity domain; however, there was little difference between colon and rectal cancer risk estimates. Dose-response analyses were generally supportive of the outcomes from comparing highest versus lowest categories of physical activity. We only found three studies each assessing transport and household physical activity for this review. Our pooled estimates showed that transport-related physical activity was inversely associated with colon, but not rectal cancer risk. We did not find any association for household physical activity. Finally, higher occupational sedentary behaviour was associated with an increased risk of colon but not rectal cancer.
Our results in relation to the occupational and recreational physical activity domains are consistent with findings from previous meta-analyses by Samad et al.15 and Boyle et al.16 Our findings for occupational sedentary behaviour suggested a higher risk estimate for colon cancer than that reported by Schmid and Leitzmann (44% versus 24% increased risk).18 This variation can be attributed to the differences in study inclusion criteria. We did not include the colorectal cancer (CRC) risk estimates for occupational sitting time reported by Weiderpass et al.,66 Chow et al.67 or Dosemeci et al.,68 which were included in the Schmid and Leitzmann meta-analyses.18 This is because Weiderpass et al.66 used selective occupations (industrial workers only, excluding managers, clerks, entrepreneurs and farmers) for measuring occupational siting time; Chow et al.67 presented only unadjusted estimates (standardized incidence rates); and Dosemeci et al.68 used exposure estimates that combined sedentary behaviour and physical activity. The studies included by Schmid and Leitzmann18 reported increased risks ranging from 6% to 40%, whereas our additional studies, Vetter et al.65 and Garabrant et al.,44 observed increased risks ranging from 50% to 60%.
Dose-response analysis has not previously been applied to examine associations between physical activity (in total, or across domains) and colon and /or rectal cancer. Our results demonstrate that higher energy expenditure in the workplace and during recreation are associated with lower risk of colon cancer, and that this association is stronger for men than women. We found no dose-response evidence supporting the risk reduction for rectal cancers in either men or women. These observations mostly support the evidence obtained in our primary meta-analysis and meta-regression analyses.
Possible explanations for site-specific differences in risk reductions may be attributed to morphological, physiological and biochemical differences between proximal colon, distal colon and rectum. These sections of the colorectum derived from different segments of the primitive intestinal tract during embryonic development, and there are differences in their histological make-up, blood supply and physical functioning.69 It has been proposed that physical activity reduces bowel transit time, and by doing so reduces the exposure of fecal carcinogens at the colonic mucosal surface.70 Different segments of colon and rectum may have varied transit time activity.69,71 Physical activity is also associated with maintenance of a healthy body weight and obesity prevention. Obesity may have differential impact on the colon and rectum; however, the exact biological mechanisms underpinning why obesity-related risk differs for colon versus rectum is still unknown.
There may be differences in biological responses among men and women for various levels of physical activity.27 It is possible that misclassification plays an important role during exposure ascertainment, as there are sex-specific differences in how physical activity and sedentary behaviour are accrued across domains. Estrogen might play a role in colorectal cancer. The Women’s Health Initiative trial found slightly decreased risk of colorectal cancer for postmenopausal women assigned to estrogen and progesterone, but no decreased risk for women assigned to estrogen alone.72 Estrogen receptor β is the predominant estrogen receptor in colon epithelium, and in vitro studies show that its expression has antiproliferative effects on colon cancer cells.73
The mechanisms by which physical activity and sedentary behaviour affect colon and rectal cancers are not clearly understood. The unfavourable body composition associated with both physical inactivity and sedentary behaviour has been shown to increase blood glucose levels and produce insulin resistance and hyperinsulinaemia.46 Insulin may be a key factor in the aetiology of colon cancer, owing to its mitogenic properties and because it is an essential element for colonic mucosal growth.15 Cell apoptosis and increased cell division favouring tumour growth have also been reported with hyperinsulinaemia and increased plasma levels of insulin-like growth factor-1 (IGF-1) and IGF binding protein-3 (IGFBP-3) levels.14,46,74,75 Haydon et al.76 found that physical activity was associated with increased levels of IGFBP-3 and lower IGF-1 in Australian adults. More recently, postmenopausal women randomized to a 12-month aerobic exercise intervention showed a 4% to10% decrease in insulin and a 2% to 11% reduction in homeostatic model of assessment for insulin resistance (HOMA-IR), compared with women in the control arm.77 Resistance training also results in improvement in glycaemic control.78–80
Experimental studies have demonstrated that breaking up prolonged bouts of sitting, by standing or stepping, has beneficial effects on insulin and glucose.81,82 During sedentary behaviour, the large postural muscles are not engaged, leading to reduced glucose uptake through blunted translocation of GLUT-4 glucose transporters to the skeletal muscle surface.83,84 The acute metabolic response to sedentary behaviour suggested by these experimental studies supports the epidemiological findings that link sitting time with type II diabetes,83 which is itself a risk factor for developing colorectal cancer.46
Inflammation has been implicated in the aetiology of colorectal cancer.85 Inflammation can stimulate cell proliferation, microenvironmental changes and oxidative stress, which can deregulate normal cell growth and promote carcinogenesis.86 Adipose tissue secretes predominantly pro-inflammatory factors (cytokines) known as adipokines.87,88 These cytokines may affect insulin sensitivity through activation of adenosine monophosphate (AMP) protein kinase. Physical activity is associated with lower circulating levels of pro-inflammatory cytokines, and higher levels of adiponectin (the only anti-inflammatory cytokine).89 Sedentary behaviour may raise the levels of pro-inflammatory cytokines while decreasing levels of adiponectin.
Reports suggest that regular exercise increases the number and activity of macrophages, natural killer cells and cytokines which have been shown to destroy cancer cells.89 Decreased gut transit time with vigorous exercise, through augmented vagal tone, has been proposed to reduce contact time of potential carcinogens in food residues and bile acids, which might protect colon mucosa.75
Our meta-analysis is the first to consider the effect of physical activity and sedentary behaviour across all domains. In addition, this meta-analysis is the first to examine domain-specific dose-response relationships. The study selection criteria were stringent; we only included studies that had adjusted for potential confounders in multivariate models. We performed meta-regression to investigate between-study variability and to observe how the individual study characteristics change the pooled relative risk. We used a random-effects meta-analysis method, which is considered an appropriate technique owing to the presence of heterogeneity across studies, thus allowing for the variation and also improving comparison with other published meta-analyses.90 Despite the presence of a moderate degree of heterogeneity across studies, our meta-regression analyses on study characteristics did not identify the source of this heterogeneity. For example, we had hypothesized that adjustment for BMI would attenuate the association between physical activity and colon or rectal cancer risk, but the results from the meta-regression analysis showed little evidence of attenuation.
Our meta-regression by study region indicates that studies from Asia demonstrated stronger inverse associations with colon and rectal risk with increasing physical activity in the occupational and recreational domains, compared with either European or North American regions. We assumed that the majority of the populations within these regions have a similar race and ethnicity. Of 38 eligible studies for this review, only five studies considered race/ethnicity as a covariate in their analyses. Only Howard et al.30 explicitly described population as White, Black and others; the rest only mentioned that they considered race in their adjusted models. There may be inequities with regard to the natural, social and built environment by region. Similarly, the availability of recreational spaces, social support, cultural norms or economic obligations may differ.6 Therefore, we propose that future studies should consider race and ethnicity as covariates (or effect modifiers) in their analyses in examining the associations of domain-specific physical activity and sedentary behaviours with outcomes of interest.
The findings of our meta-analyses should be interpreted in light of a number of limitations. There was considerable variation between studies with regard to adjustment for confounding, which may have affected estimates of the associations between domain-specific physical activity/sedentary behaviour and colon and rectal cancer risk, and therefore upon our results. There was variation across studies in the methods used to ascertain physical activity as an exposure. Many studies only assessed the frequency of activities, without duration and intensity, and others only broadly described the intensity as light, moderate or vigorous.
It should be recognized that there can be wide inter-individual variation in perceived intensity of physical activity. For example, walking at a given pace may be perceived as light-intensity physical activity by some study participants, whereas others may find walking at the same pace to be more challenging and thus report this as moderate-intensity physical activity. In addition, describing physical activity as moderate or vigorous could also be influenced by social desirability and social approval personality traits. Studies have shown that these behaviors are closely linked to variation in responses.91,92
Subjective or vague descriptions of exposures (or their methods of assessment) presented a hurdle in selecting the studies for our primary meta-analyses, and this also limited the numbers of studies available for both meta-regression and dose-response analyses within domains. It is likely that there are measurement errors (misclassification) in the studies included in our meta-analysis, as they ascertained exposure data (physical activity and sedentary behaviour) via self-report. The resultant misclassification could lead to either overestimation or underestimation of relative risks.
Epidemiological studies of physical activity would benefit from improved exposure assessment through use of objective activity monitoring tools such as accelerometers. Accelerometer data provide detailed information on the frequency, intensity, duration and accrual patterns of physical activity and sedentary behaviour.14 Objective data will, in the future, contribute to clearer estimates of the true associations of physical activity and sedentary behaviour with colon and rectal cancer risk. To date, large-scale prospective studies have mostly relied upon self-reported data, due to feasibility factors. Self-reported accounts are prone to measurement errors (both over- and under-reporting). Studies have demonstrated that self-reported physical activity assessments in longitudinal investigations encompass non-differential measurement errors, and the resultant association between physical activity and outcome of interest is usually attenuated towards the null value.92,93 Previous studies have proposed different techniques to quantify measurement errors and to correct for these using statistical methods.35,94 Whereas the use of accelerometers within large-scale cohort studies is still limited by cost, it is feasible to conduct smaller validation studies within cohorts, and use regression calibration methods to adjust risk estimates derived from self-report measures of physical activity and sedentary behaviour in the whole cohort.95
In conclusion, we have demonstrated that physical activity within multiple domains (occupation, transport and recreation) is associated with lower colon cancer risk. Population-level cancer control programmes should ensure that active transport is included as a strategy for reducing colon cancer risk. Sedentary behaviour also appears to play a role in the development of colon cancer. The large volumes of this behaviour typically accrued within the workplace makes this exposure an important one to focus on in the future.
Supplementary Data
Supplementary data are available at IJE online.
Conflict of interest: None declared.

