


Abstract
In nutrient restricted environments, the yeast endosulfines Igo1/2 are activated via TORC1 inhibition and function critically to initiate and coordinate the cellular stress response that promotes survival. We examined expression of αEnsa, the mammalian homolog of yeast endosulfines, in rat stroke. Prominent neuronal upregulation of αEnsa was identified in 3 patterns within the ischemic gradient: (1) neurons in GFAP−/HSF1+ cortex showed upregulation and near-complete nuclear translocation of αEnsa protein within hours of ischemic onset; (2) neurons in GFAP+/HSF1+ cortex showed upregulation in cytoplasm and nuclei that persisted for days; (3) neurons in GFAP+/HSF1− cortex showed delayed cytosolic-only upregulation that persisted for days. Findings were corroborated using in situ hybridization for ENSA mRNA. Rapamycin treatment was found to reduce infarct size and behavioral deficits and, in GFAP+/HSF1+ zones, enhance αEnsa neuronal nuclear translocation and mitigate cell death, relative to controls. Based on the conservation of TOR signaling across species, and on the finding that the Rim15-Igo1/2-PP2A module is triggered by substrate deprivation in eukaryotic yeast, we speculate that αEnsa is activated by substrate deprivation, functioning through the homologous MASTL-αEnsa/ARPP19-PP2A module to promote neuronal survival. In conjunction with recent studies suggesting a neuroprotective role, our data highlight a potential function for αEnsa within ischemic brain.
INTRODUCTION
Stroke is the third leading cause of death and the primary cause of long-term disability in the United States (1, 2). Despite tremendous progress in our understanding of the pathophysiology of cerebral infarction, ongoing efforts to identify novel molecular targets have yet to yield new therapies. To date, intravenous recombinant tissue plasminogen activator remains the only medication specifically approved by the US Food and Drug Administration for use in patients with ischemic stroke; however, its clinical applications are limited by temporal restrictions, modest efficacy and potential for serious hemorrhagic side effects. Thus, there exists an urgent need to fully characterize the molecular pathways involved in postischemic cell death signaling in order to identify novel molecular targets that can be exploited to ameliorate the enormous economic and personal burdens imposed by this disease.
The serine/threonine protein kinase mechanistic (formerly “mammalian”) target of rapamycin (mTOR) signaling pathway is the primary nutrient sensing pathway within mammalian cells (3, 4). By gauging a variety of extracellular signals and integrating them with intracellular cues, this pathway critically affects rates of transcription, translation, overall cell growth, and proliferation. Signaling through mTOR pathway is stimulated by the presence of certain amino acids, hormones, and mitogens and is mitigated in response to a variety of stressful stimuli such as nutrient withdrawal, depletion of cellular energy, DNA damage and hypoxia (5, 6). Moreover, rapamycin, which binds with the intracellular receptor FK506 binding protein (i.e., FKBP12) to modulate mTOR signaling, has recently been shown to confer significant clinical benefits in the context of a variety of neurological disorders, including acute and chronic neurodegenerations (5). However, specific neuroprotective mechanisms associated with neuronal mTOR inhibition remain incompletely defined (6).
Alpha-endosulfine (known as αEnsa or ARPP-19e), a highly conserved unstructured regulatory phosphoprotein that is constitutively expressed in mammalian brain, is a paralog of ARPP19, ortholog of yeast Igo1/2 (initiator of G zero 1 and 2), and endogenous ligand of the sulfonylurea receptor (7–13). Based on the remarkable conservation of mTOR signaling across species and on the finding that the recently discovered Rim15-Igo1/2-PP2A module is triggered by substrate deprivation and target of rapamycin complex 1 (TORC1) inhibition to initiate the stress response in eukaryotic yeast (14–17), we hypothesize that αEnsa is activated by ischemia-induced substrate deprivation during focal cerebral ischemia. In the present study, we analyze the expression of αEnsa in a middle cerebral artery occlusion (MCAo) rat model of stroke, with or without rapamycin, a selective inhibitor of mTORC1, the ortholog of yeast TORC1.
MATERIALS AND METHODS
Transient MCAo Rat Stroke Model
Animal experiments were performed under a protocol approved by the Institutional Animal Care and Use Committee of the University of Maryland, School of Medicine and the University Committee on Animal Resources of the University of Rochester School of Medicine. Transient middle cerebral artery occlusion (tMCAo) was performed as we described (18, 19). Male Wistar rats (250–300 g; Harlan, Indianapolis, IN) were anesthetized with ketamine, 50 mg/kg, and xylazine, 7.5 mg/kg, intraperitoneally. Body temperature was maintained with a heating pad regulated by rectal temperature (Harvard Apparatus, Holliston, MA), and rats were allowed to spontaneously ventilate room air. The skull was thinned 2 mm rostral and 2 mm lateral to bregma, and a laser Doppler probe was affixed to the skull using α-cyanoacrylate adhesive. The right common, external and internal carotid arteries (CCA, ECA, and ICA) were exposed via a ventral midline incision. The CCA, distal ECA and pterygopalatine artery were ligated prior to sectioning the ECA. A commercially available intraarterial occluder (0.39 mm; 4039PK5Re; Doccol Corp, Redlands, CA) was inserted retrograde into the ECA and was advanced into the ICA under guidance of the Doppler flowmeter to obtain middle cerebral artery (MCA) occlusion. Only rats with a drop in relative cerebral blood flow (rCBF) >75% within MCA territory were included for further study. Two animals were excluded from the study due to the insufficient rCBF drop. After 120 minutes of ischemia, the rats were reanesthetized to withdraw the filament and achieve recanalization with restitution of cerebral blood flow.
Experimental Series
In Series 1, rats underwent tMCAo, and were killed at 0, 2, 8, 24, 48, 96, or 168 hours following the onset of ischemia (n = 6 for each time point). Naïve (uninjured) rats served as controls. In Series 2, sham operated rats (anesthesia without tMCAo) and rats that underwent tMCAo (n = 6 per group) were used to quantify brain αEnsa protein abundance to ensure that anesthesia did not affect expression. In Series 3, rats underwent tMCAo, with or without rapamycin (100 mg/kg intraperitoneal) administered 5 minutes following reperfusion, and were killed at 24 hours (n = 6 per group). Garcia neurological scores (20) were analyzed in a blinded fashion at 24 hours, prior to death by intraperitoneal injection of pentobarbital.
Human Brain Tissues
Postmortem human brains were additionally examined from patients who died with documented acute ischemic cerebral infarcts. Lesional tissues were histologically confirmed by a neuropathologist. For controls, schemic border zones and nonischemic contralateral cortices were sampled for evaluation. Corresponding specimen data have previously been published (see cases 3–6, 10) (21).
Immunohistochemistry
Following death, rats were intracardially perfused with saline and 4% paraformaldehyde. Brains and pancreatic tissues from control animals were collected for evaluation and validation of antibodies. Rat tissues were immersion fixed for 24 hours. For human tissues, standard postmortem fixation protocol (7–10 days in formalin) was applied. All specimens were cryoprotected in 30% sucrose and processed for immunohistochemistry, as previously described (21, 22).
Coronal cryosections (10 μm) were blocked for 1 hour in 2% donkey serum and 0.2% Triton X-100. For single-label immunohistochemistry, sections were incubated for 30 minutes in phosphate buffered saline (PBS) with 0.3% H2O2 to block endogenous peroxidase activity. Following overnight incubation at 4 °C with rabbit primary antibodies against αEnsa (1:100, sc-135145, Santa Cruz Biotechnology, Santa Cruz, CA), sections were incubated with biotinylated secondary antibody (1:500 donkey antirabbit; Vector Laboratories, Burlingame, CA) for 2 hours. After washing in PBS, sections were incubated in avidin biotin solution (Vector Laboratories) and the color was developed in diaminobenzidine chromagen solution (0.02% diaminobenzidine in 0.175 M sodium acetate) activated with 0.01% hydrogen peroxide. Cresyl violet was used to visualize cell nuclei. The sections were rinsed, mounted, dehydrated, and cover-slipped with DPX mounting medium (Electron Microscopy Services, Fort Washington, PA). Omission of primary antibody was used as a negative control, along with a rabbit IgG isotype control (1:100, sc-2027, Santa Cruz Biotechnology).
To determine the expression of αEnsa within identified cell types, the following primary antibodies were used: rabbit anti-αEnsa (1:100, sc-135145, Santa Cruz Biotechnology); mouse anti-αEnsa (L7Q) (1:100, sc-81883, Santa Cruz Biotechnology), mouse anti-NeuN (1:100; MAB377; Chemicon, Temecula, CA); rabbit anti-NeuN (1:100, ABN78, Millipore, Temecula, CA); mouse anti-glial fibrillary acidic protein (GFAP) (1:500; CY3 conjugated; C-9205; Sigma, St. Louis, MO); rabbit anti-GFAP (1:200; Ab7260; Abcam, Cambridge, MA); mouse anti-rat endothelial cell antigen-1 (RECA-1) (1:100; MA1-81510; Thermo Fisher Scientific Inc., Rockford, IL); goat anti-platelet/endothelial cell adhesion molecule-1 (PECAM-1) (1:200; sc-1506; Santa Cruz Biotechnology); mouse anti-glucagon [K79bB10] (1:100; ab10988, Abcam); goat anti-glucagon [N-17] (1:100; sc-7780, Santa Cruz Biotechnology); guinea pig anti-insulin (1:100; ab7842, Abcam); and goat anti-somatostatin (D-20) (1:200; sc-7819, Santa Cruz Biotechnology). To identify ischemic cells, rat anti-heat shock factor 1(HSF1) (4B4) (1:100; ab44819; Abcam) was additionally used.
Sections were incubated for 1 hour with fluorescent-labeled, species-appropriate secondary antibodies (1:500; Alexa Fluor 488 and Alexa Fluor 555; Invitrogen, Molecular Probes, Eugene, OR) at room temperature. For negative controls, omission of primary antibody was used along with the following species-specific normal IgG isotype controls: rabbit IgG (1:100, sc-2027, Santa Cruz Biotechnology) and mouse IgG2a (1:100, sc-3878, Santa Cruz Biotechnology). Sections were coverslipped with polar mounting medium containing anti-fade reagent and 4′,6-diamidino-2-phenylindole ([DAPI] Invitrogen). Immunolabeled sections were visualized using epifluorescence microscopy (Nikon Eclipse 90i; Nikon Instruments Inc., Melville, NY).
The specificities of the anti-αEnsa antibodies used for this study were further validated using rat pancreas, which is known to highly express αEnsa protein (7). Prominent cytoplasmic labeling of αEnsa was found in peripheral islet cells (Supplementary Data Fig. S1A–H), with colocalization identified in somatostatin-expressing δ cells (Supplementary Data Fig. S1C, G), as previously described (7). Pancreatic serous tissues, glucacon- and insulin-labeled sections (Supplementary Data Fig. S1A, B, E, F), IgG isotype labeled sections (Supplementary Data Fig. S1D, H), and omission of primary antibodies served as negative controls, and confirmed the specificity of labeling.
TUNEL
For in situ DNA fragmentation detection, terminal deoxynucleotidyl transferase-mediated dUTP-biotin nick-end labeling (TUNEL) was performed on cryosections as per kit instructions (11684795910; Roche, Branchburg, NJ).
Immunoblot
For quantification of αEnsa protein abundance in rat tissues, brains from rats subjected to 2 hours ischemia were harvested after 4 hours reperfusion and compared to nonischemic controls. Ischemic and contralateral cortices were dissected, homogenized in lysis buffer (1% Triton X-100 in 1× dPBS), and analyzed by immunoblot. Proteins were detected using mouse anti-αEnsa (L7Q) (1:10,000; sc-81883, Santa Cruz Biotechnology) and rat anti-Hsc70 (1:20,000; sc-59560, Santa Cruz Biotechnology) for loading control. Recombinant αEnsa protein (ABIN2006147) (Antibodies-Online, Inc., Atlanta, GA) was used as a positive control for immunoblot experiments.
In Situ Hybridization for ENSA mRNA
A digoxigenin labeled probe, antisense 5′-GGATGTGGTCACCGGTCACCAGGTTCTTGTCTGCTCCTGCACTCGGTAGC-3′ (and sense, 5′-GCTACCGAGTGCAGGAGCAGACAAGAACCTGGTGACCGGTGACCACATCC-3′), designed to hybridize to rat ENSA gene was supplied by IDT (Integrated DNA Technologies, Inc., Coralville, IA). In situ hybridization was performed on 10-μm sections using an IsHyb In Situ Hybridization Kit (Biochain Institute, Inc., Newark, CA) according to the manufacturer’s protocol. Sections were incubated in diethyl pyrocarbonate (DEPC)-treated PBS and fixed in 4% paraformaldehyde in PBS for 20 minutes. After being rinsed twice with DEPC-PBS, the slides were treated with 10 μg/mL proteinase K at 37 °C for 10 minutes, washed in DEPC-PBS, rinsed with DEPC-H2O, and prehybridized with ready-to-use prehybridization solution (BioChain Institute) for 3 hours at 50 °C. The DIG-labeled probe was diluted in hybridization buffer (BioChain Institute) and applied at 4 ng/μL. Sections then were incubated at 45 °C for 16 hours. Posthybridization washing and immunological detection, using anti-DIG-alkaline phosphatase (AP) with NBT/BCIP as substrates were performed as recommended by the manufacturer. Slides were then incubated with AP-conjugated anti-DIG antibodies (1:100 PBS diluted, BioChain Institute) for 2 hours, rinsed in distilled H2O and coverslipped.
αEnsa Protein and ENSA mRNA Expression
αEnsa protein and ENSA mRNA expression were quantified in different specimens and within distinct cortical regions of interest (ROIs). Immunohistochemistry or in situ hybridization was performed in a single batch, as previously described (21, 22). Control watershed cortices or cortical areas encompassing the anterior cerebral artery-middle cerebral artery ischemic border at areas of maximal infarction were selected for the construction of a montage, with each montage composed of 10 adjacent high-power images acquired at 40× magnification. Unbiased measurements of αEnsa protein or ENSA mRNA labeling within ROIs were obtained with NIS-Elements AR software (Nikon Instruments). All ROI images for a given signal were captured using uniform parameters of magnification, area, exposure and gain. To quantify immunohistochemistry results, a histogram of pixel intensity was constructed to determine the intensity of background labeling. Pixels within the ROI were defined as having positive labeling if their intensity was >3 times that of the background. Areas occupied by pixels with positive labeling were used to calculate the % ROI with specific labeling. For quantification of nuclear labeling within distinct zones, DAPI-positive regions were subselected on montage images and analyzed for % ROI with specific labeling. For in situ hybridization results, analysis was performed as above, using object counts rather than percent labeling within each ROI.
Statistical Analysis
Data are reported as mean ± SEM. For analysis of immunohistochemistry and in situ hybridization results, group comparisons were made using one-way analysis of variance (ANOVA) with Fisher post hoc comparisons. Data were analyzed and plotted using OriginPro version 7 (Origin Lab Corp., Northampton, MA). In all experiments, p < 0.05 was considered to be statistically significant.
RESULTS
Temporospatial Expression of αEnsa Protein in Rat tMCAo
To evaluate αEnsa protein expression in mammalian stroke, immunohistochemistry was performed on cortical brain samples obtained from a rat tMCAo model. Relative to nonischemic contralateral controls, significant upregulation of αEnsa protein was found in the ischemic core and peri-infarct regions of animals subjected to different durations of reperfusion following 2 hours of an ischemic insult (Fig. 1A, B). Upregulated αEnsa expression was detected within 2 hours of the onset of ischemia, and persisted throughout the acute phase of reperfusion in both the core and peri-infarct regions (Figs. 1 and 2). Sustained upregulation was noted in ischemic territories at 2–4 days, but declined by day 7; quantitative immunohistochemistry revealed distinct temporospatial expression patterns, with initial upregulation in the core and delayed upregulation in peri-infarct zones (Fig. 1I). Infarcted brain specimens exposed to control IgG isotype controls failed to show any significant increase in labeling (Supplementary Data Fig. S1I, J). Immunoblot analyses further corroborated immunohistochemical findings, revealing upregulated αEnsa protein in cerebral tissues obtained 24 hours after ischemia and reperfusion (Fig. 2G).
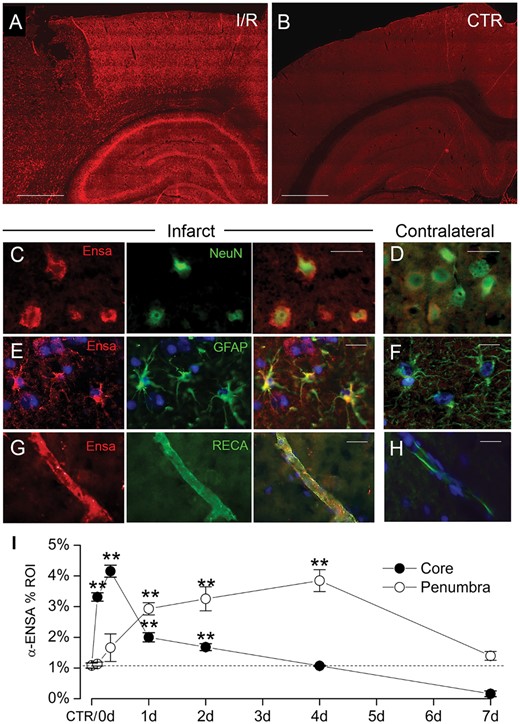
Upregulation of αEnsa protein in rat tMCAo is detected using a polyclonal rabbit-anti-αEnsa primary antibody. Immunofluorescence results in rat tMCAo (A) and control brain (B), using a polyclonal rabbit-anti-αEnsa primary antibody. Double label immunofluorescence reveals prominent upregulation of αEnsa protein in NeuN-positive neurons (C), GFAP-positive astrocytes (E), and rat endothelial cell antigen-1 (RECA-1) positive endothelial cells (G) in ischemic tissues versus nonischemic contralateral controls (D, F, and H, respectively); merged double label images are shown in the third and fourth columns. Quantification of αEnsa protein expression in core versus peri-infarct regions at various times after MCAo, as indicated (I); 6 rats/group; **p < 0.01; original magnification, 20× (A, B) or 40× (C–H); scale bars, 100 µm (A, B); 10 µm (C–H); αEnsa, red/CY3; NeuN, GFAP, and RECA, green/FITC; nuclei, blue/DAPI. Images shown are from specimens 24 hours after ischemia/reperfusion.
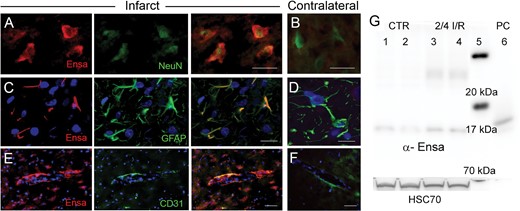
Upregulation of αEnsa protein in rat tMCAo is detected using a monoclonal mouse-anti-αEnsa primary antibody. Double label immunofluorescence reveals prominent upregulation of αEnsa protein in NeuN-positive neurons (A), GFAP-positive astrocytes (C) and PECAM (CD31)-positive endothelial cells (E) in ischemic tissues, versus nonischemic contralateral controls (B, D, and F, respectively); merged double label images are shown in the third and fourth columns; original magnification, 40× (A–F); scale bars, 10 µm; αEnsa, red/CY3; NeuN, GFAP, and PECAM (CD31), green/FITC; nuclei, blue/DAPI. Images shown are from specimens 24 hours after ischemia/reperfusion. Immunoblot of αEnsa and Hsc70 protein expression in control versus peri-infarct region following 2 hours ischemia and 4 hours reperfusion in rat MCAo (data shown from 2 controls and 2 animals with tMCAo, representatiave of 6 independent experiments); molecular weight ladder in lane 5 and human recombinant αEnsa (positive control) in lane 6 (G).
Cellular Expression of αEnsa Protein and ENSA mRNA in Rat tMCAo
To further evaluate αEnsa expression in distinct cell types, double label immunofluorescence experiments were performed using NeuN for neurons, GFAP for astrocytes and RECA-1 and CD31 for endothelial cells. Upregulation of αEnsa was found to be diffusely prominent in ischemic NeuN-labeled neurons (Figs. 1C, 2A), with less intense upregulation seen in astrocytes (Figs. 1E, 2C) and endothelial cells (Figs. 1G, 2E) present within ischemic cortices. Control cerebral cortices exhibited minimal neuronal expression (Figs. 1D, 2B) without any detectable astrocytic (Figs. 1F, 2D) or endothelial cell (Figs. 1H, 2F) labeling. Similarly, in situ hybridization experiments demonstrated low levels of mRNA labeling in cortical neurons present in controls (Fig. 3A, C), with prominent mRNA upregulation seen in neurons of the ischemic cortices (Fig. 3B, C). Upregulated neuronal mRNA was observed in the core and peri-infact regions at 2 hours, and was maximal in the core 8 hours after ischemic onset, and within the peri-infarct areas 24 hours of ischemic onset (Fig. 3C, D). While αEnsa expression in ischemic GFAP-positive astrocytes and RECA1-positive endothelial cells was limited to cytosolic compartments only, neurons exhibited prominent subcellular pattern changes that were reproducible in different ischemic zones.
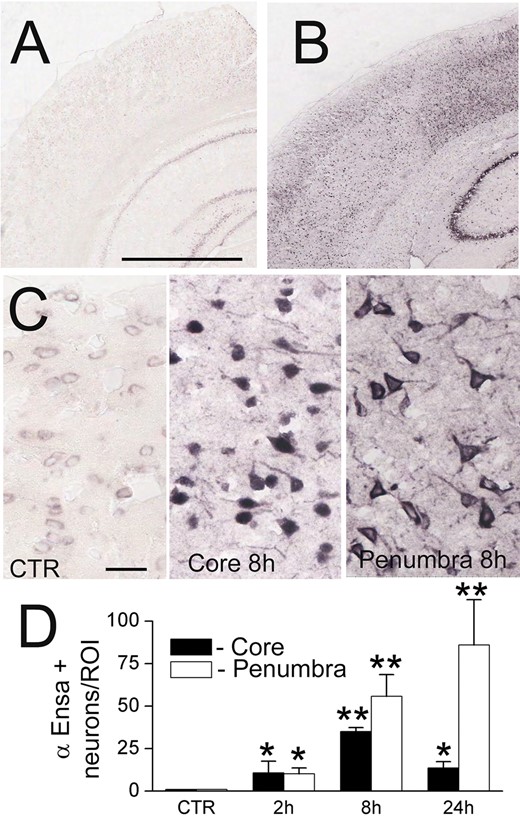
ENSA mRNA is upregulated in rat tMCAo. In situ hybridization for ENSA in control brain (A) and brain 24 hours after ischemia/reperfusion in rat tMCAo (B, C), shown at low (B) and high (C) magnification. Quantification of ENSA in core versus peri-infarct region at various times after MCAo, as indicated (D); 3 rats/group; *p < 0.05; **p < 0.01.
Localization of Distinct Molecular Zones Within the Ischemic Penumbra
For further cytologic evaluation of distinct ischemic areas, cortical regions were classified according to the expression of 2 ischemia-responsive proteins, GFAP and heat shock protein (HSP) (Fig. 4A). Heat shock factor 1 (HSF1) is upstream of the inducible stress proteins, HSP70 and HSP72, which are regarded as specific markers of cell damage in cortical ischemia (23). Also, HSF1 may be responsible for downregulating GFAP in the ischemic core (24, 25). The expression of GFAP and HSF1 were invariably found to be inversely related across ischemic cerebral cortical gradients (Fig. 4B), allowing for objective molecular identification of 3 distinct cortical zones at the ischemic border: Zone 1, an ischemic GFAP–/HSF1+ region adjacent to the ischemic core; Zone 2, an ischemic GFAP+/HSF1+ area of transition; and Zone 3, a GFAP+/HSF1– region adjacent to nonischemic cerebral tissue present at the anterior cerebral artery vascular territory. Within infarcted cortices, the distinct zones were found to correlate with 2,3,5-triphenyltetrazolium chloride (TTC)-negative, -transition, and -positive watershed zones, respectively (Fig. 5A).
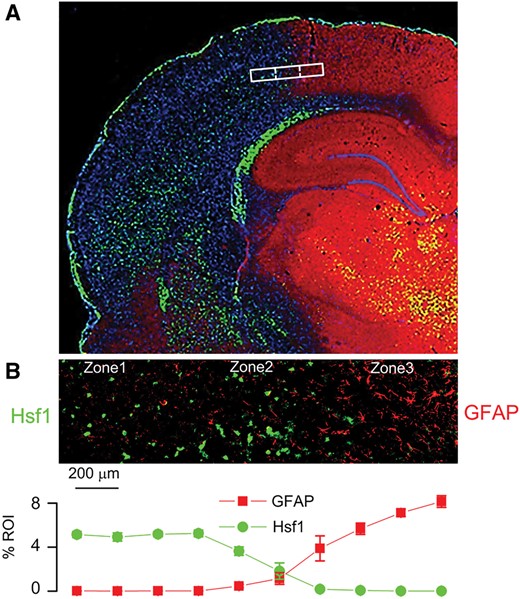
Inverse expression of HSF1 and GFAP across the ischemic gradient, with localization of the ischemic penumbra. Montage of high-power images in rat showing distinct molecular zones defined by GFAP and HSF1 immunolabeling, with Zone 1, a GFAP–/HSF1+ region representing the ischemic core; Zone 2, a GFAP+/HSF1+ area of transition; and Zone 3, a GFAP+/HSF1– area adjacent to normal tissue (A). High-power image of transition zone, with quantification of GFAP and HSF1 labeling in 10 adjacent high-power fields (40×), from left to right across the ischemic gradient (B); mean ±SE; n = 6 brains; original magnification, 20× (A) or 40× (B); GFAP, red/CY3; HSF1, green/FITC; nuclei, blue/DAPI. Images shown are from specimens 24 hours after ischemia/reperfusion.
αEnsa protein is differentially expressed in distinct zones of ischemic rat brain. Triphenyltetrazolium chloride (TTC)-stained coronal section of rat tMCAo, with depiction of distinct boxed zones (A). Immunofluorescent montage images of ischemic rat cortex reveal qualitative differences in αEnsa protein expression in distinct regions of ischemic cortex (B, D), relative to controls (C, E); original magnification, 20× (B–E, upper panels); 40× (B–E, lower panels); scale bars, 100 µm (upper panels); 10 µm (lower panels); αEnsa, red/CY3; GFAP and HSF1, green/FITC; nuclei, blue/DAPI. Images shown are from specimen 24 hours after ischemia/reperfusion.
Subcellular αEnsa Protein Expression in Neurons at the Ischemic Border
Double label immunofluorescence experiments were performed with GFAP and HSF1, revealing distinct temporospatial expression patterns of αEnsa within evolving infarcts. Low level of cytosolic only αEnsa expression was seen in neurons present in nonischemic contralateral and control rat cortices, with no detectable nuclear labeling (Fig. 5C, E). In contrast, ischemic neurons of Zone 1 exhibited prominent αEnsa upregulation, with near-complete nuclear translocation of protein and negligible cytoplasmic expression; in ischemic neurons of Zone 2, prominent αEnsa upregulation was noted in neuronal nuclei and cytoplasm; in ischemic neurons of Zone 3, αEnsa protein was upregulated in the cytoplasm only, with essentially no nuclear protein expression observed (Fig. 5B, D). These observations were corroborated on immunoperoxidase labeling, using HRP-conjugated secondary antibody (Fig. 6A), and upon colabeling with NeuN (Fig. 6B). Quantitative analyses confirmed significant increase in αEnsa protein labeling within DAPI+ regions of Zones 1 and 2 (Fig. 6C). Immunohistochemistry findings overall revealed that there was gradual upregulation of αEnsa protein, with nuclear translocation within the central ischemic cortical zones.
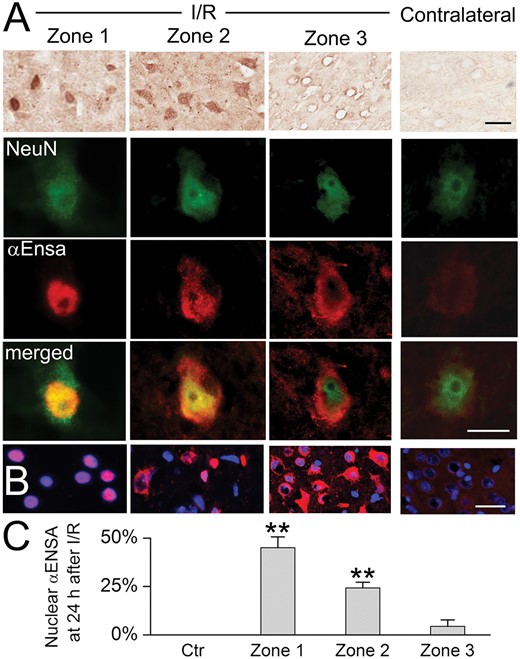
αEnsa protein is upregulated and nuclear translocated in ischemic rat neurons. Immunoperoxidase preparations reveal αEnsa protein upregulation in ischemic cortical neurons, relative to control (A, upper row). Double label immunofluorescent images demonstrate colocalization with NeuN in ischemic neurons with nuclear translocation seen in zones 1 and 2 (A, rows 2–4, with yellow merged images in lower row). Nuclear translocation of αEnsa is further demonstrated by DAPI colabeling in zones 1 and 2 (B). Quantitative ROI analysis of nuclear labeling is illustrated (C); scale bars, 10 µm (A) or 20 µm (B); αEnsa, red/CY3; NeuN, green/FITC; nuclei, blue/DAPI.
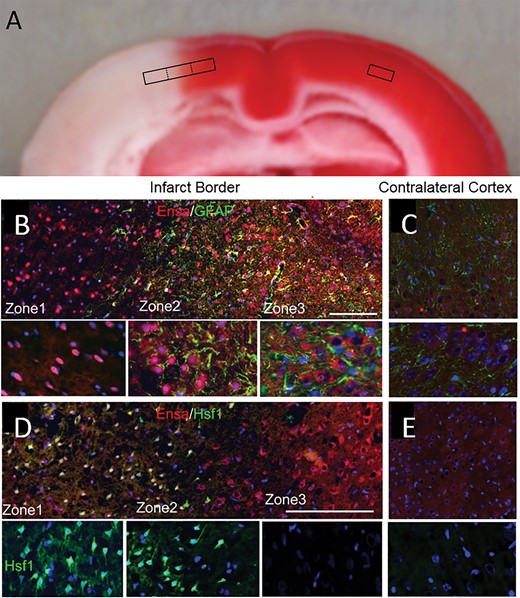
The observed subcellular neuronal expression pattern changes were reproducible in human cerebral infarcts (Fig. 7). Notably, prominent punctate nuclear and/or perinuclear αEnsa neuronal expression of αEnsa was identified within zones 1 and 2 of infarcted human brains (Fig. 7E).
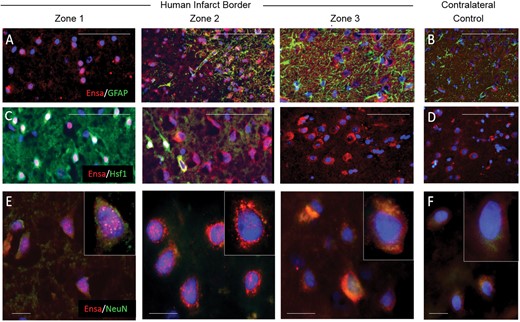
Upregulation and nuclear translocation of αEnsa protein is detected in ischemic human neurons using a polyclonal rabbit-anti-αEnsa primary antibody. Immunofluorescent montage images of ischemic human cortex reveal αEnsa protein expression changes in distinct regions of infarcted brain (A, C), relative to controls (B, D). Double label immunofluorescent images demonstrate colocalization with NeuN in degenerating ischemic neurons, with punctate labeling and nuclear translocation seen in zones 1 and 2 (data are representatiave of findings in 5 postmortem cerebral infarcts); original magnification, 20× (A–D); 40× (E, F); scale bars, 50 µm (A–D) or 10 µm (E, F); αEnsa, red/CY3; GFAP, Hsf1, NeuN, green/FITC; nuclei, blue/DAPI.
Effects of Rapamycin on αEnsa Expression, Behavior, and Infarct Size in Rat tMCAo
The yeast endosulfines, Igo1 and Igo2 have been demonstrated to have a significant biological role during nutrient deprivation and in TORC1 signaling (14–17). Hence, we hypothesized a critical role for αEnsa in focal cerebral ischemia, affiliated with mTOR1 signaling in the mammalian brain. To investigate a role for mTOR1 pathway on αEnsa expression, the effects of rapamycin, an agent that binds with the intracellular receptor FK506 binding protein (FKBP12) to modulate mTOR kinase activity (26), was evaluated in the tMCAo stroke model. An intraperitoneal dose of rapamycin administered following the ischemic insult was found to result in: (i) improved postischemic neurological function (Fig. 8A); (ii) reduced cerebral infarct size, as previously described (27, 28) (Fig. 8B); and (iii) enhanced αEnsa nuclear labeling in neurons of ischemic cortical Zone 2 (Fig. 8C), and decreased TUNEL labeling in ischemic cortical zone 2 (Fig. 8D). Notably, no significant changes in αEnsa expression levels or subcellular distribution were detectable in other cell types or ischemic zones, as a result of rapamycin therapy (Fig. 8E).
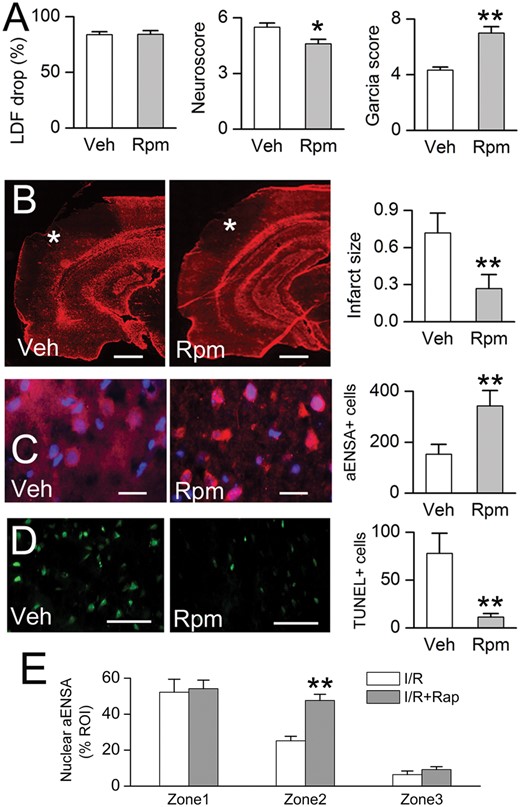
Rapamycin treatment is associated with reduced infarct size, increased nuclear αEnsa protein expression in Zone 2, and reduced cell death in rat MCAo. Laser Doppler flowmetry (LDF) at the time of MCAo, and Neuroscores and Garcia scores at 24 hours (A); GFAP labeling demonstrates reduction of infarct size in rapamycin-treated rats, relative to vehicle controls (data representative of 6 rats per group) (B). In Zone 2 of the ishemic cortex, immunolabeling in rapamycin treated rats demonstrates increased nuclear translocation of αEnsa (C), and decreased TUNEL labeling (D), relative to controls; scale bars, 500 µm (B); 10 µm (C); 100 µm (D); GFAP and αEnsa, red/CY3; terminal deoxynucleotidyl transferase dUTP nick end labeling (TUNEL), green/FITC; nuclei, blue/DAPI. Rapamycin treatment increased nuclear translocation of αEnsa in Zone 2, but not Zones 1 or 3 (E). *p < 0.05; **p < 0.01.
DISCUSSION
In this study, we investigated the expression of αEnsa, a mammalian homolog of yeast Igo, in a tMCAo rat model of ischemic stroke. We show that αEnsa levels are significantly upregulated in mammalian brain at various times following the onset of ischemia/reperfusion. Protein upregulation was detected as early as 2 hours after ischemic onset, with sustained upregulation noted subsequently over several days. There was initial upregulation in the core, and delayed upregulation in peri-infarct zones. Double label immunofluorescence demonstrated conspicuous labeling of ischemic neurons, with corroboration of findings observed on immunoblot and in situ hybridization experiments.
Interestingly, distinct subcellular patterns of αEnsa protein expression were identified in cortical neurons, seemingly reflecting nutrient depravation along an ischemic cerebral cortical gradient. In control GFAP+/HSF1− cerebral cortex, neurons exhibited only low levels of cytosolic labeling. In contrast, neurons exhibited marked upregulation of cytosolic αEnsa within GFAP+/HSF1− ischemic zones, reflecting perhaps a noninjurious ischemic stimulus. Moreover, in GFAP+/HSF1+ transition zones, prominent αEnsa upregulation was observed in both neuronal cytosol and nuclei, reflecting perhaps a reversible ischemic injury within the penumbral territory. Finally, in the GFAP−/HSF1+ ischemic core there was prominent upregulation and near complete nuclear translocation of αEnsa observed in degenerating neurons that could not be salvaged, as indicated by TUNEL labeling.
Remarkably, the subcellular expression of αEnsa in ischemic neurons mimicked closely the expression of its ortholog in budding yeast (17). Talarek et al previously described cytoplasmic localization of Igo1-green fluorescent protein fusion protein in glucose-fed yeast, with prominent nuclear translocation noted under conditions of glucose starvation (17). In this model, activated, nuclear translocated Igo1/2 was shown to associate with PP2A and the decapping activator, Dhh1, to effectively inhibit yeast mRNA decapping under nutrient restricted conditions (14, 17). Through detailed molecular experiments, Talarek et al showed that yeast Igo binds to and escorts HSF1-regulated stress transcripts to processing and stress granules, selectively sheltering them from 5′ to 3′ mRNA decay (17). More recently, Chica et al have demonstrated an additional role for yeast Igo in nutritional control of yeast size (29).
While the significance of upregulated, nuclear translocated αEnsa expression in ischemic neurons is unclear, we hypothesize that αEnsa may act as a nutrient sensor that functions in the induction of the mammalian cellular stress response. Our experiments demonstrated punctate perinuclear and intranuclear expression of αEnsa in ischemic human cortical neurons, suggesting a potential role in mRNP biology (17). It has previously been demonstrated invitro that yeast Rim15 is capable of phosphorylating human αEnsa and ARPP19, in addition to yeast Igo1/2 (17). Furthermore, transgenic expression of human αEnsa and ARPP19 has been shown to partially restore depleted heat shock protein expression in rim15ΔIgoΔ mutant and rapamycin-treated yeast. Upregulated αEnsa protein expression has also been documented in rat models of neurotoxicity and acute stress (11), with downregulated expression seen with aging (11) and human neurodegeneration (12). In light of these observations as well as prior studies that suggest a potential role in cerebral ion channel physiology (30–32), the present findings may indicate a biological function of αEnsa in postischemic neuronal stress.
Despite tremendous progress in our understanding of the pathophysiology of cerebral infarction over recent years, exhaustive efforts to identify novel molecular targets have yet to yield new therapies. Mild dietary restriction and attenuated mTOR kinase activity have been documented to promote neuronal viability in acute central nervous system injuries (28, 33). However, specific neuroprotective mechanisms functioning through mTOR pathway have not yet been fully elucidated. In this study, intraperitoneal administration of rapamycin, a well-characterized mTOR inhibitor, was found to mitigate infarct volume after rat tMCAo, as previously described (27, 28). Treated rats exhibited increased expression and nuclear translocation of αEnsa in cortical neurons at risk for infarction, suggesting that αEnsa may function in endogenous neuroprotective pathways, with implications for stroke therapy. Further studies may elucidate the activation status and roles of this protein in ischemic and nonischemic mammalian brain. Increased knowledge on this regulatory phosphoprotein and of the MASTL-αEnsa/ARPP19-PP2A signaling module may lead to new insights and novel therapeutic mechanisms to boost endogenous neuroprotective responses following focal ischemic stroke.
Conclusion
Our data illustrate the utility of HSF1 and GFAP as molecular markers of the ischemic penumbra and suggest that further investigation of αEnsa, a key integrator in the MASTL-αEnsa/ARPP19-PP2A pathway, may yield novel neuroprotective therapeutic targets for ischemic stroke.
ACKNOWLEDGMENT
The authors thank Dr. Cigdem Tosun for technical assistance and Dr. Orestes Solis for image formatting. This work was presented in part at the 92nd Annual Meeting of the American Association of Neuropathologists (AANP), in Baltimore, Maryland.
REFERENCES
Author notes
Financial support: This work was supported by grants to RIM from the National Institute of Neurological Disorders and Stroke (K08NS089830) and to JMS from the National Heart, Lung and Blood Institute (HL082517) and the National Institute of Neurological Disorders and Stroke (NS061808). This work was presented in part at the 92nd Annual Meeting of the American Association of Neuropathologists (Baltimore, MD)
The authors have no duality or conflicts of interest to declare.
Supplementary Data can be found at http://www.jnen.oxfordjournals.org.
