


Abstract
The existing radio and X-ray flux correlation for Galactic black holes in the hard and quiescent states relies on a sample which is mostly dominated by two sources (GX 339−4 and V404 Cyg) observed in a single outburst. In this paper, we report on a series of radio and X-ray observations of the recurrent black hole GX 339−4 with the Australia Telescope Compact Array, the Rossi X-ray Timing Explorer and the Swift satellites. With our new long-term campaign, we now have a total of 88 quasi-simultaneous radio and X-ray observations of GX 339−4 during its hard state, covering a total of seven outbursts over a 15-yr period. Our new measurements represent the largest sample for a stellar mass black hole, without any bias from distance uncertainties, over the largest flux variations and down to a level that could be close to quiescence, making GX 339−4 the reference source for comparison with other accreting sources (black holes, neutrons stars, white dwarfs and active galactic nuclei). Our results demonstrate a very strong and stable coupling between radio and X-ray emission, despite several outbursts of different nature and separated by a period of quiescence. The radio and X-ray luminosity correlation of the form LX∝L0.62 ± 0.01Rad confirms the non-linear coupling between the jet and the inner accretion flow powers and better defines the standard correlation track in the radio–X-ray diagram for stellar mass black holes. We further note epochs of deviations from the fit that significantly exceed the measurement uncertainties, especially during the time of formation and destruction of the self-absorbed compact jets. The jet luminosity could appear brighter (up to a factor of 2) during the decay compared to the rise for a given X-ray luminosity, possibly related to the compact jets. We furthermore connect the radio/X-ray measurements to the near-infrared/X-ray empirical correlation in GX 339−4, further demonstrating a coupled correlation between these three frequency ranges. The level of radio emission would then be tied to the near-infrared emission, possibly by the evolution of the broad-band properties of the jets. We further incorporated our new data of GX 339−4 in a more global study of black hole candidates strongly supporting a scale invariance in the jet–accretion coupling of accreting black holes, and confirms the existence of two populations of sources in the radio/X-ray diagram.
1 INTRODUCTION
Stellar mass black holes (BH) in accreting binaries undergo occasional outbursts with transitions between different spectral states, usually defined by their X-ray spectral and timing properties (McClintock & Remillard 2006; Belloni 2010). In addition to the behaviour of the inner accretion flow, outflows are also crucial for the characterization of these different spectral states (Fender 2006), especially in light of the strong coupling between the jets and the disc. Two main spectral states can be defined as follows: (1) the hard state is characterized by a Comptonized X-ray spectrum with a weak or absent (e.g. Tomsick et al. 2008) thermal contribution from the accretion disc, and the presence of powerful self-absorbed compact jets (Corbel et al. 2000; Dhawan, Mirabel & Rodríguez 2000; Fender 2001; Stirling et al. 2001); and (2) the soft state is mostly dominated by the thermal emission from the accretion disc and the absence of relativistic jets (Fender et al. 1999; Coriat et al. 2011a; Russell et al. 2011). We further note the intermediate states that are associated with many changes in the X-ray spectral and timing properties (Belloni 2010) and the inflow–outflow coupling (Corbel et al. 2004; Fender, Belloni & Gallo 2004; Rodriguez et al. 2008; Fender, Homan & Belloni 2009).
Weakly accreting BHs in the hard state have been the focus of many recent studies due to the presence of several emission processes that are very difficult to disentangle in this regime. Indeed, three main components are thought to dominate the energetic output of the system: the standard optically thick and geometrically thin accretion disc (eventually truncated in its inner part; Shakura & Sunyaev 1973), the self-absorbed compact jets (Corbel et al. 2000; Fender 2001) and an optically thin corona of hot electrons (Sunyaev & Titarchuk 1980; see also Xie & Yuan 2012) that may or may not be the base of the compact jets (e.g. Markoff, Nowak & Wilms 2005). Emission from the companion star is usually negligible for low-mass X-ray binaries in outburst.
With the development of large campaign of multi-wavelength observations, several attempts have been conducted to model the spectral energy distribution (SED) of BHs in their regimes of faint X-ray emission (e.g. McClintock et al. 2001; Markoff et al. 2003; Yuan, Cui & Narayan 2005). It turns out that optically thick synchrotron emission from the compact jets dominates the radio to near-infrared range in the hard state (Corbel & Fender 2002; Hynes et al. 2003; Buxton & Bailyn 2004b; Homan et al. 2005; Russell et al. 2006; Coriat et al. 2009). In the hard X rays, inverse Comptonization of the ambient photon field is the main emission process, with an active debate on whether it is thermal or non-thermal Comptonization, or synchrotron self-Compton (see for a review McClintock & Remillard 2006; Markoff 2010). Optically thin synchrotron emission from the compact jets may also play a role at high energy (Markoff, Falcke & Fender 2001; Homan et al. 2005; Russell et al. 2010; Laurent et al. 2011).
Another way to probe the emission properties of these BHs systems is to search for empirical relations between various wavelengths. The tight non-linear power-law correlation between radio and X-ray emission (of the form LRad∝L∼ 0.7X in GX 339−4; Hannikainen et al. 1998; Corbel et al. 2000, 2003) demonstrated the strong coupling between the compact jets and the X-ray emitting media. This correlation originally brought to light the possibility of optically thin synchrotron X-ray emission from the compact jets of GX 339−4 (Corbel et al. 2003; Markoff et al. 2003) or alternatively from a radiatively inefficient accretion flow (Merloni, Heinz & di Matteo 2003; Heinz 2004, but see also Körding, Falcke & Corbel 2006). Gallo, Fender & Pooley (2003b) extended this correlation study to a larger sample of BHs and proposed a universal correlation (still with an index of ∼0.7) between the radio and X-ray luminosity for Galactic BHs. The correlation observed in the hard state appears to be maintained down to the quiescent level of at least two sources (V404 Cyg, A 0620−00 and possibly also GX 339−4: Corbel et al. 2003; Gallo et al. 2003b, 2006; Corbel, Koerding & Kaaret 2008). By taking into account the mass of the BHs, this correlation was extended to active galactic nuclei and led to the definition of the Fundamental Plane of BH activity and the possibility of universal scaling laws for accreting BHs across all mass scales (Merloni et al. 2003; Falcke, Körding & Markoff 2004; Körding et al. 2006; Wang, Wu & Kong 2006; Gültekin et al. 2009; Plotkin et al. 2011).
However, it is important to note that the universal radio/X-ray correlation presented by Gallo et al. (2003b) for BH binaries is dominated by two sources [GX 339−4 from Corbel et al. (2003) and V404 Cyg] with a few measurements from additional sources that are often close to transition to the softer states. As the Fundamental Plane relies on the correlation for the Galactic BHs, it is important to verify how solid both the Galactic sample and the correlation are. Corbel et al. (2008) revisited the correlation for V404 Cyg and confirmed the tight correlation from outburst down to quiescence with an index of ∼0.6 that could be consistent with X rays emanating from synchrotron self-Compton emission at the base of the compact jets or Comptonization from an inefficient accretion flow. A similarly tight correlation was also found between X-ray and optical/near-infrared (hereafter OIR) emission in a sample of BH candidates (BHC) and also in GX 339−4 over different outbursts (Homan et al. 2005; Russell et al. 2006; Coriat et al. 2009). Alternatively to jet or ADAF models, synchrotron emission from a hybrid electron distribution in a hot accretion flow has also been invoked to explain the OIR/X-ray correlation (Veledina, Poutanen & Vurm 2011).
In recent years, significant efforts have been undertaken to observe most new BH transients in outburst at radio frequencies. This led to the discovery of several sources lying outside the scatter (hence their names ‘outliers’) of the original radio/X-ray correlation (e.g. XTE J1650−500, Corbel et al. 2004; IGR J17497−2821, Rodriguez et al. 2007, Swift J1753.5−0127, Cadolle Bel et al. 2007; Soleri et al. 2010). These outliers lie significantly below the standard correlation (Gallo, Miller & Fender 2012). Using a large sample for the BH transient H 1743−322, Coriat et al. (2011a) found a steeper correlation index of ∼1.4 for the outliers [and possibly also other sources like Cyg X−1 (Zdziarski et al. 2011) and GRS 1915+105 (Rushton et al. 2010)]. At fainter fluxes, these outliers (at least H 1743−322; Jonker et al. 2010; Coriat et al. 2011a) and possibly now also MAXI J1659−152 and XTE J1752−223 (Jonker et al. 2012; Ratti et al. 2012) may return to the standard correlation. It remains unclear how these outliers are related to typical BHs such as GX 339−4 or V404 Cyg. With a global study of H 1743−322 and other sources, Coriat et al. (2011a) proposed that these outliers may represent a large subset of BHs radiating efficiently in the hard state. This is a change of paradigm for BHs in the hard state, usually believed to be in a regime of inefficient accretion (as also implied by the standard radio/X-ray correlation). Alternatively, a different coupling between jet power and mass accretion rate (Coriat et al. 2011a) may also explain the steeper correlation index (see also Soleri & Fender 2011).
In this paper, we review the properties of the correlation for GX 339−4 based on a very large sample of new data acquired during several outbursts in the last decade. Indeed, amongst the Galactic sources in the standard correlation (in fact dominated by one outburst for GX 339−4 and V404 Cyg), none has been observed over several outbursts. The original work on GX 339−4 (Corbel et al. 2003) included data from the 1997 extended hard state (e.g. Harmon et al. 1994; Corbel et al. 2000) and the decay from the 1998–99 outburst. The inclusion of two radio observations from the rise of the 2002–03 outburst pointed out that GX 339−4 could follow another track for different outbursts (Nowak et al. 2005).
Due to its recurrent outburst activity, GX 339−4 is an ideal target to probe the evolution of the correlation over distinct outbursts. After the 1998–99 outburst, GX 339−4 was found in quiescence in 2000 and 2001 (Corbel et al. 2003). Since then, seven outbursts were observed: 2002–03 (Belloni et al. 2005; Homan et al. 2005), 2004–05 (Belloni et al. 2006), 2006, 2007 (e.g. Tomsick et al. 2008), 2008, 2009, 2010–11 (Cadolle Bel et al. 2011; Motta et al. 2011; Shidatsu et al. 2011; Rahoui et al. 2012) and a temporary reactivation in 2012 (Lewis, Russell & Shahbaz 2012; Maccarone, Russell & Lewis 2012). GX 339−4 is believed to harbour a BH with a mass >5.8 M⊙ in a system with a low-mass star companion (Hynes et al. 2004). GX 339−4 is located at a favoured distance of 8 kpc (Zdziarski et al. 2004). In Section 2, we present the radio and X-ray observations used in this analysis. The results for selected outbursts, as well as the re-evaluation of the radio/X-ray correlation using all data, are presented in Section 3. We then discuss these results in Section 4 in light of the multi-wavelength behaviour of GX 339−4. Our conclusions are summarized in Section 5.
2 OBSERVATIONS AND DATA ANALYSIS
2.1 ATCA observations
All radio observations discussed in this paper were conducted with the Australia Telescope Compact Array (ATCA) located in Narrabri, New South Wales, Australia. The ATCA synthesis telescope is an east–west array consisting of six 22-m antennas. It uses orthogonal linearly polarized feeds and records full Stokes parameters. We carried out all observations simultaneously at 4.8 GHz (6.3 cm)/8.64 GHz (3.5 cm) and in a limited cases also at 1.384 GHz (21.7 cm)/2.496 GHz (12.0 cm). The ATCA was upgraded in 2009 April with the new Compact Array Broad-band Backend (CABB) system (Wilson et al. 2011) resulting in significant improvement in sensitivity (an increase in bandwidth from 128 MHz to 2 GHz). This implied a small change in central frequencies and the most recent observations were carried out at the frequencies of 5.5 and 9 GHz. Various array configurations have been used during these campaigns. All observations have been conducted by us, with the exception of four observations (PI: M. Rupen) in 2004 March (briefly mentioned in Miller et al. 2006). To compare with the previous outbursts, we also used the original data of GX 339−4 from Corbel et al. (2003) updated in Nowak et al. (2005).
The amplitude and band-pass calibrator was PKS 1934−638, and the antennas’ gain and phase calibration, as well as the polarization leakage, were usually derived from regular observations of the nearby (less than a degree away) calibrator PMN 1646−50. The editing, calibration, Fourier transformation with multi-frequency algorithms, deconvolution and image analysis were performed using the miriad software package (Sault & Killeen 1998). In observations of short duration with bad coverage of the u-v plane, flux densities were measured directly in the u-v plane with miriad task uvfit and consequently checked afterwards with direct imaging of simulated data sets. We only present in this paper the data when GX 339−4 was in the hard state according to the X-ray behaviour (black squares in the vertical track of the Hardness–Intensity Diagrams (Fig. 1).
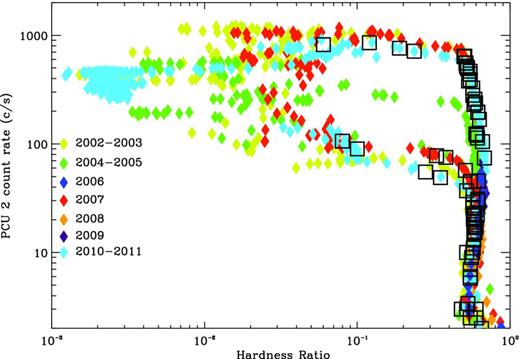
RXTE/PCA HID covering all outbursts of GX 339−4 in the 2000–2011 period (see the concluding portion of Section 2.2 for the definition of the X-ray hardness and intensity). The squares highlight the epoch of our radio observations (not including the ones conducted at very low flux). Those on the vertical track are observations purely in the hard state, whereas the few ones on the horizontal branches correspond to the period of compact jet destruction in 2010, and formation in 2007 and 2011 (see Section 3.4).
2.2 RXTE observations
The Rossi X-ray Timing Explorer (RXTE) has conducted (almost daily) monitoring observations of GX 339−4 during almost all outbursts discussed here (see e.g. Homan et al. 2005; Belloni et al. 2006; Cadolle Bel et al. 2011; Motta et al. 2011; Stiele et al. 2011), with an exposure time of typically 1 to 3 ks for each observations.
We performed spectral analysis using data from the Proportional Counter Array (PCA; Jahoda et al. 2006) and the High Energy X-ray Timing Experiment (HEXTE; Rothschild et al. 1998) from observations when GX 339−4 was in the hard state. The data were reduced using heasoft software package v6.11 following the standard steps described in the (RXTE) data reduction cookbook.1 We extracted PCA spectra from the top layer of the Proportional Counter Unit (PCU) 2 which is the best calibrated detector out of the five PCUs and the only one operational across all the observations we analysed. We produced the associated response matrix and added a systematic uncertainty of 0.5 per cent to all spectral channels to account for PCA calibration uncertainties. In addition, we used the background model (faint or bright) appropriate to the brightness level of GX 339−4 to create background spectra.
For HEXTE, we produced a response matrix and applied the necessary dead-time correction. The HEXTE background is measured throughout the observation by alternating between the source and background fields every 32 s. The data from the background regions were then merged. When possible we used data from both detector A and B to extract source and background spectra. However, from 2005 December, due to problems in the rocking motion of Cluster A, we extracted spectra from Cluster B only. HEXTE channels were grouped by four due to the low count rate in most of the observations. On 2009 December 14, Cluster B stopped rocking as well. From this date, we thus used only PCA data in our analysis.
The X-ray fluxes in various energy bands were determined by fitting simultaneously the PCA and HEXTE spectra in xspec V12.7. We used a model consisting of a multi-colour disc blackbody(ezdiskbb, not required at low flux), a power law with a high-energy cut-off when required (power × highecut) and a Gaussian emission line (Gaussian) constrained in energy between 6 and 7 keV. Interstellar absorption was taken into account using the phabs model with cross-sections from Balucinska-Church & McCammon (1992) and abundances from Wilms, Allen & McCray (2000). We fixed the hydrogen column density to NH = 6 × 1021 cm−2, which is a typical value observed in GX 339−4 (e.g. Zdziarski et al. 2004; Cadolle Bel et al. 2011). A multiplicative constant was added to the model to allow for differences in the overall normalization between both instruments. All fluxes presented have been normalized to PCA and have been corrected for the interstellar absorption (its effect is almost negligible for GX 339−4 above 3 keV). The flux error bars were chosen to be the largest of the statistical error, or 3 per cent, which is a good estimate of the PCA systematic uncertainty. Furthermore, the X-ray fluxes from the original correlation (Corbel et al. 2003) have also been updated with the latest version of the RXTE software and calibration. The level of Galactic Ridge emission (Revnivtsev et al. 2006; Revnivtsev & Sazonov 2007; Ebisawa et al. 2008) has been estimated from long PCA observations taken when GX 339−4 was in quiescence (and therefore below PCA detection level; see Coriat et al. 2009 for details). This level of 4 × 10⁻¹² erg s−1 cm−2 (3–9 keV band) has been subtracted from all X-ray fluxes. Quantifying this level was important for the discussion on the level of radio emission when GX 339−4 was detected at its faintest level of radio emission.
In addition, we constructed hardness intensity diagrams (HIDs; see Fig. 1) from PCA data. We produced background subtracted light curves binned at 16 s using PCA Standard 2 mode data from the PCU2 (all layers). The light curves were divided into three energy bands, 2.5–6.1, 9.4–18.5 and 2.5–18.5 keV (according to the correspondence between fixed energy channels and energy valid for the PCA gain epoch 5). We defined the hardness ratio (HR) as the ratio of count rate in the bands 9.4–18.5 keV and 2.5–6.1 keV and the intensity as the count rate in the energy band 2.5–18.5 keV.
2.3 Swift observations
We used measurements made by the Swift X-Ray Telescope to extend this study to low flux levels. Our analysis included one 3.0 ks observation made on 2009 October 30 that was previously reported by Yen & Kong (2009), five observations made in 2011 on April 13 (1.2 ks), April 27 (4.9 ks), May 11 (4.8 ks), and September 9 (2.1 ks), and two observations made in 2012 on June 23 (0.15 ks) and June 26 (0.43 ks). Although more Swift observations are available near these times, these are the observations that are closest in time to our radio observations.
For all eight of these observations, XRT was operated in photon counting (PC) mode, providing 2D imaging. We analysed the data using the heasoft software package. For the 2009 and 2011 observations, we reprocessed the data to produce cleaned event lists using the routine xrtpipeline, and for the 2012 observations, we used the output of the standard pipeline processing. We used xselect to extract source spectra from a circular aperture with a 20 pixel (47 arcsec) radius and background spectra from an annular region centred on the source. After background subtraction, the 0.5–10 keV count rates for the five observations range from 0.007 ± 0.002 s−1 to 0.14 ± 0.02 s−1, which are low enough for photon pile-up to be negligible. We used the PC-mode response file swxpc0to12s6_20010101v012.rmf, and the routine xrtmkarf to produce the ancillary response (‘arf’) files. For the spectral fits described below, we combined the 2012 June 23 and June 26 spectra due to the short exposures and the fact that the radio observation was made on June 24 in between the two Swift observations.
To determine the X-ray flux, we used the xspec software package to fit the energy spectra with a power-law model with interstellar absorption. We used Cash statistics for the fits, which does not require binning of the spectra. We fixed the column density to NH = 6 × 1021 cm−2, and the photon indexes obtained for the non-quiescent observations ranged from Γ = 1.5 ± 0.3 to 2.0 ± 0.3 (90 per cent confidence errors). For the three quiescent observations, the photon index was not well-constrained, and we fixed it to Γ = 2. The main goal of these spectral fits is to obtain the unabsorbed flux for each spectrum, and we accomplished this by using the model pegpwrlw, which has flux in an adjustable energy band as a free parameter to represent the power law.
2.4 Notes on some individual observations
Almost all radio and X-ray observations were conducted quasi-simultaneously (less than a few hours). However, in only very limited cases, we interpolated (usually with a second degree polynomial on a linear scale) the monotonously rising/decaying X-ray flux in order to get the most precise flux at the time of the radio observations.
One single ATCA observation was conducted in 2006 on November 5 (MJD 54044.2) and it occurred well after the end of the faint 2006 outburst (from January to June 2006, see the Swift/Burst Alert Telescope light curve in Fig. 3). Inspection of the RXTE/PCA light curve (not shown) revealed that the reported 2007 outburst already started, at least, as early as 2006 November 12 (date of the first available PCA observation) with an 3–9 keV unabsorbed X-ray flux of 5.56 × 10⁻¹¹ erg s−1 cm−2. 13 RXTE/PCA observations occurred in a 13-d period and it showed an X-ray flux that was steadily rising (see also Swank et al. 2006). A fit to the rising X-ray flux leads to an extrapolated 3–9 keV flux of 2.2 × 10⁻¹¹ erg s−1 cm−2 (with a very conservative error of 30 per cent) for 2006, November 5 (i.e. 5 d earlier).
During the 2008–2009 period, GX 339−4 is mostly detected by the hard X-ray all-sky monitor (aka Swift/BAT), indicative of hard state activity only. For the observation on MJD 55002, the X-ray flux was taken from the RXTE/PCA Galactic Bulge Monitoring of Craig Markwardt.2 On MJD 54469, the X-ray flux was estimated from an average of the RXTE/PCA observations conducted 6 d before and after, at a period when GX 339−4 was not very variable. Finally, on 2011 May 11, we used the X-ray flux derived from Chandra observations (to be discussed elsewhere) conducted at low flux.
Regarding the radio observations, we note that in a few cases, it was also necessary to take into account the presence of an additional component associated with the interaction of previously ejected material with the interstellar medium (e.g. Gallo et al. 2004; Corbel et al. 2010b), similarly to what has been detected in XTE J1550−564 (Corbel et al. 2002). However, this did not concern any hard state measurements, but only the observations during the re-ignition of the compact jets in the 2007 soft to hard state transition. Finally, the first ATCA observations in 2002 was only made at 1.384 and 2.496 GHz and flux densities have been extrapolated to 8.6 GHz assuming a typical (Corbel et al. 2003) radio spectral index α = +0.12, taking a definition of the flux density, Sν, as Sν ∝ να (consistent with the 1.384 to 2.496 GHz spectral index of 0.11 ± 0.11). Similarly, on 2002 April 5, the flux at 8.6 GHz is deduced from the detection at 4.8 GHz (no data usable at 8.6 GHz for this observations). All our measurements representing the whole sample of GX 339−4 in the hard state are tabulated in Table 1.
Summary of data used for the radio/X-ray flux correlation in GX 339−4.
| Calendar date | MJD | Flux density | Radio | X-ray flux (3–9 keV) | X-ray | Comment | |
|---|---|---|---|---|---|---|---|
| (ut) | 4.8 or 5.5 GHz | 8.6 or 9.0 GHz | spectral | (in unit of 10−10 | hardness | ||
| (mJy) | index | erg s−1 cm−2) | |||||
| 1997 Feb. 4 | 50483.04 | N.A. | 9.10 ± 0.10 | N.A. | 9.66 ± 0.34 | 0.71 | C03, N05 |
| 1997 Feb. 10 | 50489.79 | N.A. | 8.20 ± 0.20 | N.A. | 8.48 ± 0.30 | 0.72 | C03, N05 |
| 1997 Feb. 17 | 50496.81 | N.A. | 8.70 ± 0.20 | N.A. | 8.11 ± 0.29 | 0.72 | C03, N05 |
| 1999 Feb. 12 | 51221.96 | 6.34 ± 0.08 | 4.60 ± 0.08 | −0.55 ± 0.04 | 4.39 ± 0.16 | 0.67 | C03, N05, Na |
| 1999 Mar. 3 | 51240.71 | 6.07 ± 0.06 | 5.74 ± 0.06 | −0.10 ± 0.03 | 4.35 ± 0.15 | 0.76 | C03, N05, Na |
| 1999 Apr. 2 | 51270.56 | 4.75 ± 0.06 | 5.10 ± 0.06 | +0.12 ± 0.04 | 4.42 ± 0.16 | 0.53 | C03, N05 |
| 1999 Apr. 22 | 51290.58 | 2.92 ± 0.06 | 3.20 ± 0.06 | +0.16 ± 0.05 | 2.05 ± 0.07 | 0.55 | C03, N05 |
| 1999 May. 14 | 51312.65 | 1.25 ± 0.05 | 1.44 ± 0.06 | +0.24 ± 0.10 | 0.72 ± 0.03 | 0.52 | C03, N05 |
| 1999 Jun. 25 | 51354.69 | 0.14 ± 0.03 | 0.24 ± 0.05 | +0.92 ± 0.51 | (3.93 ± 0.28) × 10−2 | N.A | C03 |
| 1999 Jul. 7 | 51366.56 | < 0.13 | 0.12 ± 0.04 | N.A. | (1.53 ± 0.19) × 10−2 | N.A | C03 |
| 1999 Aug. 17 | 51407.35 | N.A. | 0.27 ± 0.07 | N.A. | (2.0 ± 0.3) × 10−2 | N.A | C03 |
| 1999 Sept. 1 | 51422.38 | N.A. | 0.32 ± 0.05 | N.A. | (1.96 ± 0.10) × 10−2 | N.A | C03 |
| 1999 Sept. 15 | ∼ 51436 | N.A. | < 0.06 | N.A. | (5.7 ± 1.0) × 10−3 | N.A | C03 |
| 2002 Apr. 4 | 52368.69 | N.A. | 5.95 ± 0.15 | +0.11 ± 0.11 | 18.62 ± 0.61 | 0.58 | N05, S.2.4 |
| 2002 Apr. 5 | 52369.66 | 6.77 ± 0.15 | 7.26 ± 0.20 | N.A. | 22.86 ± 0.73 | 0.57 | S.2.4 |
| 2002 Apr. 7 | 52371.70 | 8.39 ± 0.06 | 8.27 ± 0.07 | −0.02 ± 0.02 | 30.63 ± 0.96 | 0.54 | |
| 2002 Apr. 18 | 52382.86 | 13.19 ± 0.05 | 14.27 ± 0.05 | +0.13 ± 0.01 | 53.86 ± 1.56 | 0.51 | N05 |
| 2003 May 25 | 52784.01 | 0.60 ± 0.05 | 0.77 ± 0.06 | +0.42 ± 0.19 | 0.186 ± 0.030 | 0.60 | |
| 2004 Feb. 4 | 53039.87 | N.A. | 0.70 ± 0.04 | N.A. | 0.145 ± 0.031 | 0.70 | |
| 2004 Feb. 13 | 53048.89 | 1.27 ± 0.07 | 1.13 ± 0.08 | −0.20 ± 0.15 | 0.749 ± 0.027 | 0.52 | |
| 2004 Feb. 24 | 53059.09 | 1.77 ± 0.15 | 1.84 ± 0.20 | +0.07 ± 0.23 | 2.36 ± 0.08 | 0.62 | |
| 2004 Mar. 16 | 53080.79 | 4.75 ± 0.06 | 4.88 ± 0.06 | +0.10 ± 0.07 | 9.07 ± 0.32 | 0.61 | |
| 2004 Mar. 17 | 53081.79 | 4.92 ± 0.05 | 4.84 ± 0.11 | −0.03 ± 0.05 | 9.55 ± 0.34 | 0.61 | |
| 2004 Mar. 18 | 53082.79 | 5.15 ± 0.05 | 4.98 ± 0.11 | −0.05 ± 0.05 | 9.92 ± 0.35 | 0.61 | |
| 2004 Mar. 19 | 53083.79 | 5.17 ± 0.04 | 5.20 ± 0.10 | +0.01 ± 0.04 | 10.06 ± 0.35 | 0.60 | |
| 2005 Apr. 21 | 53481.73 | 4.35 ± 0.05 | 4.73 ± 0.05 | +0.14 ± 0.03 | 3.75 ± 0.13 | 0.55 | |
| 2005 Apr. 24 | 53484.67 | 4.39 ± 0.06 | 4.23 ± 0.08 | −0.06 ± 0.04 | 2.77 ± 0.10 | 0.57 | |
| 2005 Apr. 28 | 53488.58 | 3.07 ± 0.10 | 3.46 ± 0.13 | +0.20 ± 0.08 | 1.85 ± 0.07 | 0.58 | |
| 2005 Apr. 29 | 53489.65 | 2.88 ± 0.08 | 3.32 ± 0.10 | +0.24 ± 0.07 | 1.65 ± 0.06 | 0.58 | |
| 2005 Apr. 30 | 53490.63 | 2.53 ± 0.05 | 2.94 ± 0.07 | +0.26 ± 0.05 | 1.57 ± 0.06 | 0.58 | |
| 2005 May 3 | 53493.88 | 1.73 ± 0.10 | 1.92 ± 0.14 | +0.18 ± 0.16 | 1.17 ± 0.04 | 0.59 | |
| 2005 May 4 | 53494.88 | 1.87 ± 0.08 | 1.99 ± 0.10 | +0.11 ± 0.11 | 1.25 ± 0.05 | 0.58 | |
| 2005 May 6 | 53496.88 | 1.42 ± 0.09 | 1.69 ± 0.12 | +0.30 ± 0.16 | 0.96 ± 0.04 | 0.58 | |
| 2005 May 12 | 53502.88 | 1.08 ± 0.12 | 1.00 ± 0.18 | −0.13 ± 0.36 | 0.73 ± 0.03 | 0.56 | |
| 2006 Nov. 5 | 54044.17 | 0.37 ± 0.06 | 0.60 ± 0.07 | +0.82 ± 0.34 | 0.22 ± 0.08 | N.A. | S.2.4 |
| 2007 Feb. 4a | 54135.10 | 19.5 ± 0.3 | 17.0 ± 1.0 | −0.23 ± 0.10 | 54.84 ± 1.92 | 0.50 | S.3.4.2 |
| 2007 Feb. 4b | 54135.77 | 21.9 ± 0.3 | 22.5 ± 0.3 | +0.05 ± 0.03 | 56.80 ± 1.99 | 0.50 | S.3.4.2 |
| 2007 May 31 | 54251.74 | 4.34 ± 0.14 | 4.37 ± 0.09 | +0.01 ± 0.06 | 2.10 ± 0.08 | 0.57 | |
| 2007 Jun. 6 | 54257.74 | 2.63 ± 0.15 | 2.63 ± 0.18 | +0.00 ± 0.14 | 1.53 ± 0.06 | 0.59 | |
| 2007 Jun. 11 | 54262.73 | 1.77 ± 0.18 | 2.01 ± 0.15 | +0.22 ± 0.21 | 1.28 ± 0.05 | 0.58 | |
| 2007 Jun. 25 | 54276.71 | 1.69 ± 0.06 | 1.69 ± 0.05 | +0.00 ± 0.08 | 1.26 ± 0.05 | 0.59 | |
| 2007 Jun. 29 | 54280.46 | 1.7 ± 0.2 | 2.0 ± 0.2 | +0.28 ± 0.26 | 1.33 ± 0.05 | 0.60 | |
| 2007 Jul. 4 | 54285.52 | 1.7 ± 0.2 | 2.1 ± 0.2 | +0.36 ± 0.26 | 1.81 ± 0.07 | 0.61 | |
| 2007 Jul. 13 | 54294.50 | 2.36 ± 0.05 | 2.66 ± 0.05 | +0.20 ± 0.05 | 2.50 ± 0.09 | 0.62 | |
| 2007 Aug. 22 | 54334.50 | 3.30 ± 0.05 | 2.95 ± 0.07 | −0.19 ± 0.05 | 3.67 ± 0.13 | 0.62 | |
| 2007 Nov. 3 | 54407.25 | 0.55 ± 0.06 | 0.80 ± 0.07 | +0.63 ± 0.24 | 0.25 ± 0.04 | 0.57 | |
| 2007 Nov. 27 | 54431.99 | 0.59 ± 0.07 | 0.48 ± 0.07 | −0.35 ± 0.32 | 0.25 ± 0.06 | 0.52 | |
| 2008 Jan. 4 | 54469.05 | 0.70 ± 0.05 | 0.65 ± 0.05 | −0.13 ± 0.18 | 0.275 ± 0.063 | N.A. | S.2.4 |
| 2008 Jun. 26 | 54643.77 | 0.77 ± 0.08 | 1.16 ± 0.10 | +0.70 ± 0.23 | 0.714 ± 0.075 | 0.62 | |
| 2008 Jul. 5 | 54652.70 | 1.08 ± 0.06 | 1.24 ± 0.07 | +0.24 ± 0.13 | 0.875 ± 0.092 | 0.62 | |
| 2008 Jul. 16 | 54663.70 | 1.21 ± 0.07 | 1.51 ± 0.06 | +0.38 ± 0.12 | 1.17 ± 0.12 | 0.64 | |
| 2008 Aug. 18 | 54696.60 | 1.10 ± 0.10 | 1.18 ± 0.10 | +0.12 ± 0.21 | 0.858 ± 0.090 | 0.62 | |
| 2008 Sep. 29 | 54738.02 | 0.69 ± 0.10 | 0.91 ± 0.10 | +0.47 ± 0.31 | 0.454 ± 0.49 | 0.57 | |
| 2008 Oct. 10 | 54749.37 | 0.86 ± 0.07 | 0.73 ± 0.10 | −0.28 ± 0.27 | 0.166 ± 0.021 | 0.76 | |
| 2009 Jun. 20 | 55002.59 | 2.22 ± 0.03 | 2.76 ± 0.03 | +0.44 ± 0.04 | 2.01 ± 0.51 | 0.65 | RXTE GBM |
| 2009 Oct. 30 | 55134.33 | Combined upper limits: < 0.05 | N.A | (2.2 ± 0.8) × 10−3 | N.A. | Swift/XRT | |
| 2010 Jan. 21 | 55217.92 | 5.08 ± 0.04 | 5.05 ± 0.05 | −0.01 ± 0.03 | 6.02 ± 0.21 | 0.68 | |
| 2010 Feb. 13 | 55240.01 | 6.17 ± 0.06 | 5.90 ± 0.10 | −0.09 ± 0.04 | 8.28 ± 0.29 | 0.66 | |
| 2010 Mar. 3 | 55258.89 | 7.22 ± 0.10 | 7.30 ± 0.10 | +0.02 ± 0.04 | 14.06 ± 0.49 | 0.63 | |
| 2010 Mar. 6 | 55261.89 | 9.02 ± 0.10 | 9.60 ± 0.05 | +0.13 ± 0.03 | 16.41 ± 0.58 | 0.62 | |
| 2010 Mar. 7 | 55262.91 | 8.24 ± 0.05 | 8.05 ± 0.10 | −0.05 ± 0.03 | 16.49 ± 0.58 | 0.62 | |
| 2010 Mar. 14 | 55269.80 | 10.18 ± 0.10 | 11.32 ± 0.10 | +0.22 ± 0.03 | 20.01 ± 0.70 | 0.60 | |
| 2010 Mar. 16 | 55271.60 | 10.85 ± 0.10 | 12.04 ± 0.10 | +0.21 ± 0.03 | 21.91 ± 0.77 | 0.59 | |
| 2010 Mar. 21 | 55276.82 | 13.76 ± 0.10 | 15.45 ± 0.06 | +0.24 ± 0.02 | 28.16 ± 0.99 | 0.57 | |
| 2010 Mar. 24 | 55279.79 | 15.56 ± 0.05 | 18.59 ± 0.05 | +0.36 ± 0.01 | 33.09 ± 1.16 | 0.55 | |
| 2010 Mar. 28 | 55283.73 | 19.48 ± 0.10 | 21.88 ± 0.10 | +0.24 ± 0.02 | 38.02 ± 1.33 | 0.55 | |
| 2010 Mar. 31 | 55286.73 | 22.68 ± 0.05 | 25.94 ± 0.05 | +0.27 ± 0.01 | 40.57 ± 1.42 | 0.55 | |
| 2010 Apr. 2 | 55288.91 | 21.95 ± 0.05 | 25.18 ± 0.10 | +0.28 ± 0.01 | 43.09 ± 1.51 | 0.53 | |
| 2010 Apr. 3 | 55289.91 | 18.84 ± 0.10 | 21.11 ± 0.15 | +0.23 ± 0.02 | 44.36 ± 1.55 | 0.53 | |
| 2010 Apr. 4 | 55290.82 | 21.60 ± 0.04 | 23.53 ± 0.05 | +0.34 ± 0.01 | 44.21 ± 1.55 | 0.53 | |
| 2010 Apr. 5 | 55291.81 | 21.13 ± 0.04 | 24.69 ± 0.05 | +0.32 ± 0.01 | 45.25 ± 1.59 | 0.52 | |
| 2010 Apr. 6 | 55292.81 | 21.30 ± 0.05 | 23.90 ± 0.06 | +0.24 ± 0.01 | 48.94 ± 1.71 | 0.51 | |
| 2011 Feb. 13 | 55605.81 | 4.45 ± 0.04 | 4.17 ± 0.05 | −0.13 ± 0.03 | 3.23 ± 0.11 | 0.52 | |
| 2011 Feb. 15 | 55607.98 | 4.07 ± 0.04 | 3.87 ± 0.05 | −0.10 ± 0.03 | 2.59 ± 0.09 | 0.57 | |
| 2011 Feb. 18 | 55610.08 | 3.85 ± 0.10 | 3.98 ± 0.10 | +0.07 ± 0.07 | 2.03 ± 0.07 | 0.59 | |
| 2011 Feb. 20 | 55612.97 | 3.31 ± 0.05 | 3.84 ± 0.05 | +0.30 ± 0.04 | 1.41 ± 0.05 | 0.58 | |
| 2011 Feb. 24 | 55616.69 | 2.54 ± 0.04 | 2.95 ± 0.05 | +0.30 ± 0.05 | 0.966 ± 0.035 | 0.59 | |
| 2011 Feb. 27 | 55619.73 | 1.75 ± 0.10 | 2.42 ± 0.08 | +0.66 ± 0.13 | 0.760 ± 0.028 | 0.57 | |
| 2011 Mar. 3 | 55623.66 | 1.32 ± 0.04 | 1.64 ± 0.05 | +0.44 ± 0.09 | 0.610 ± 0.023 | 0.55 | |
| 2011 Mar. 7 | 55627.10 | 1.11 ± 0.05 | 1.26 ± 0.10 | +0.25 ± 0.19 | 0.500 ± 0.019 | 0.55 | |
| 2011 Mar. 9 | 55629.66 | 1.13 ± 0.05 | 1.38 ± 0.08 | +0.41 ± 0.15 | 0.460 ± 0.018 | 0.55 | |
| 2011 Mar. 20 | 55640.04 | 0.63 ± 0.03 | 0.74 ± 0.04 | +0.33 ± 0.15 | 0.240 ± 0.042 | 0.48 | |
| 2011 Mar. 22 | 55641.95 | 0.62 ± 0.05 | 0.76 ± 0.05 | +0.41 ± 0.19 | 0.16 ± 0.04 | 0.55 | |
| 2011 Apr. 15 | 55666.89 | 0.30 ± 0.02 | 0.40 ± 0.03 | +0.58 ± 0.20 | (3.1 ± 1.0) × 10−2 | N.A. | Swift/XRT |
| 2011 Apr. 27 | 55678.84 | 0.88 ± 0.10 | 0.39 ± 0.10 | −1.03 ± 0.54 | (1.4 ± 0.4) × 10−2 | N.A. | Swift/XRT |
| 2011 May 12 | 55693.89 | Combined upper limits: < 0.060 | N.A. | (1.78 ± 0.10) × 10−3 | N.A. | Chandra/ACIS | |
| 2011 Sept. 9 | 55813.33 | Combined upper limits: < 0.054 | N.A. | (2.2 ± 1.0) × 10−3 | N.A. | Swift/XRT | |
| 2012 Jun. 24 | 56102.75 | 0.30 ± 0.04 | 0.35 ± 0.05 | +0.31 ± 0.39 | (5.4 ± 1.8) × 10−2 | N.A. | Swift/XRT |
Note: C03: see also Corbel et al. (2003). N05: see also Nowak et al. (2005). The calendar dates correspond to the mid-point of the radio observations. Upper limits are given at a 3σ confidence level. The Galactic ridge emission has been subtracted from the quoted unabsorbed 3–9 keV X-ray flux. See the concluding part of Section 2.2 for the definition of the X-ray hardness. GBM: X-ray flux from RXTE/PCA Galactic Bulge Monitoring of Craig Markwardt. Swift/XRT: X-ray flux from Swift/XRT. Chandra/ACIS: X-ray flux from Chandra/ACIS. S.2.4: See complementary information in Section 2.4. S.3.4.2: See complementary information in Section 3.4.2. Na: Data points from original C03 sample, but these two points with optically thin radio spectra are representative of the re-ignition of the compact jets during the soft to hard state transition (e.g. see Section 3.4).
3 RESULTS
3.1 A long series of outbursts in a decade
In the last decade, GX 339−4 has been one of the most active accreting BHs with many outbursts (Figs 2 and 3). The work on the radio/X-ray flux correlation by Corbel et al. (2003) used data from 1997, when GX 339−4 was in a period of extended and persistent hard state, and data from the decay of the 1998/99 outburst. Four major outbursts have been observed since 2000: 2002/03, 2004/05, 2007 and 2010/11. In addition, the analysis of the Swift/BAT light curve reveals weaker outbursts in 2006, 2008 and 2009, when GX 339−4 was observed only in the hard state. After the decay of the 2007 outburst, GX 339−4 brightened again (defined as ‘2007 reflare’ in Fig. 3) but stayed only in the hard state. We have plotted in Fig. 1 the full HID. For 1998/99, very few RXTE observations were conducted and therefore these HIDs are not represented. For a general and recent overview of the activity, see, for example, Dunn et al. (2008), Droulans et al. (2010), Wu et al. (2010), Motta et al. (2011), Stiele et al. (2011), Cadolle Bel et al. (2011), Rahoui et al. (2012) and Buxton et al. (2012).
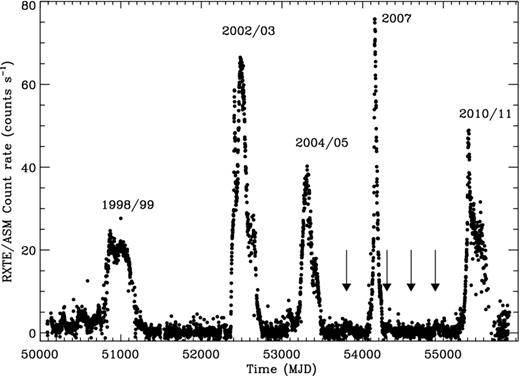
RXTE/All Sky Monitor soft X-ray (1.5–12 keV) light curve of GX 339−4 for all RXTE lifetime (1996 January to 2011 December). The major outbursts, that include a full transition to the soft state, are indicated by their epoch. In addition, the arrows point to additional fainter outbursts that are not visible with ASM (but see the Swift light curve in Fig. 3) because GX 339−4 was only in the hard state.
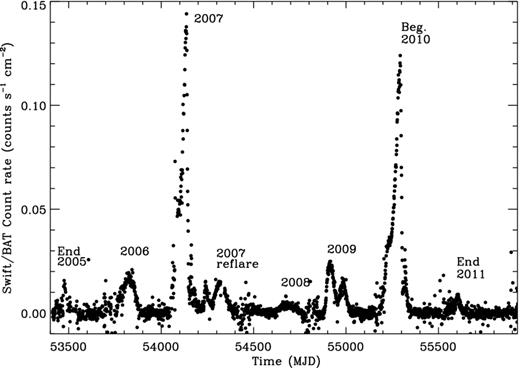
Swift/BAT hard X-ray (15–50 keV) light curve of GX 339−4 corresponding to Fig. 2 after Swift launch (2005 February to 2011 December). Outbursts are identified by their epoch. We note that after the 2007 outburst, GX 339−4 brightened again (noted ‘2007 reflare’) for a few months and stayed only in the hard state, as in 2006, 2008 and 2009.
3.2 GX 339−4 close to quiescence
Following the CABB upgrade (2009 April) of the ATCA, three of our radio observations have been conducted when GX 339−4 was in a very faint state of X-ray emission (2009 October 30, 2011 May 12 and 2011 September 9), prior and after the 2010/11 outburst. Although these radio observations did not result in a positive detection when considered individually (Table 1), we decided to combine them together as the simultaneous Swift observations gave a similar X-ray flux (an unabsorbed 3–9 keV flux of ∼2 × 10⁻¹³ erg s−1 cm−2 with an error of the order of ∼10 per cent).
No detection was achieved in the combined 9 GHz data set with an rms noise level of 17 μJy, whereas the combined 5.5 GHz provided a detection of GX 339−4 at the level of 73 ± 16 μJy (noise level in the image of 10 μJy). All together, the 5.5 and 9 GHz data (but with a significantly higher noise level at 9 GHz) give a detection of 45 ± 16 μJy. The choice of the final radio flux in this very faint state depends of the assumed spectral shape: 45 ± 16 μJy if the spectrum is flat or 73 ± 16 μJy at 5.5 GHz in case of steep spectrum (which will translate to 54 μJy at 9 GHz for a –0.6 spectral index). For the rest of the paper, we will assume a level of 45 ± 16 μJy, which is consistent with the expected spectral shape of compact jets.
Whether or not it represents the true level of GX 339−4 in quiescence, it is however interesting to note that its X-ray emission has been hovering around the same value for all X-ray observations conducted between outbursts during the last decade (e.g. Corbel et al. 2003; Gallo, Fender & Corbel 2003a; Corbel et al. 2005; Yen & Kong 2009). The faintest upper limit recently reported by Maccarone et al. (2012) is only a factor of ∼2.5 lower than the above X-ray flux, meaning that it should at least represent the level of X-ray emission to within a factor of 2, between the major outbursts. It may also be close to the level in quiescence, indicating that GX 339−4 may be at the upper end of the quiescent BH luminosities (Corbel, Tomsick & Kaaret 2006).
3.3 The overall flux correlations
3.3.1 The radio/X-ray flux correlation
The new radio and X-ray measurements of GX 339−4, taken during the past 10 years, allow us to complement the original study of Corbel et al. (2003) by adding measurements from seven additional outbursts, including four new outbursts that encompass a full X-ray states cycle (i.e. a full path in a given HID). In addition, it also samples the initial and final hard states for a given outburst. These measurements are the most complete data set available to study the evolution of the radio/X-ray correlation of a BH over several outbursts (see also Coriat et al. 2011a for H 1743−322). This new data set represents an increase of the original sample of Corbel et al. (2003) by almost a factor of 7 (88 observations instead of 13), plus 12 observations close to state transitions.
The whole sample is represented in Fig. 4, where we separate the new data points (in green) from the original sample (red points) of Corbel et al. (2003). In Fig. 5, we divide the full sample according to the rise and the decay of the outbursts, as well as highlighting those outbursts when GX 339−4 was found in the hard state only (see also Fig. 8 for the data associated with each individual outburst).
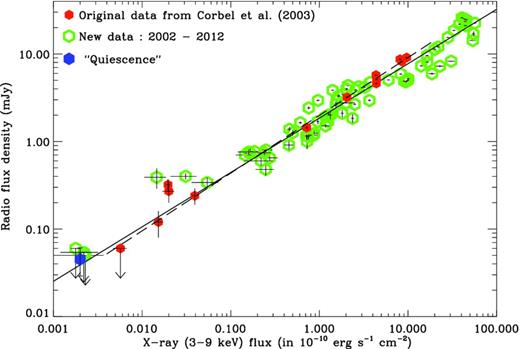
9 GHz radio emission from GX 339−4 in the hard state versus the un-absorbed 3–9 keV flux for the new data points (empty green hexagons) and the old data points (filled red hexagons) from the original correlation (Corbel et al. 2003). The dashed line illustrates the original radio/X-ray correlation in GX 339−4 from the 1997–1999 period (Corbel et al. 2003; Nowak et al. 2005). The full line corresponds to a fit to the new whole sample with a function of the form FRad ∝ FbX (with b = 0.62 ± 0.01). The blue point corresponds to the level of GX 339−4 close to quiescence (see Section 3.2).
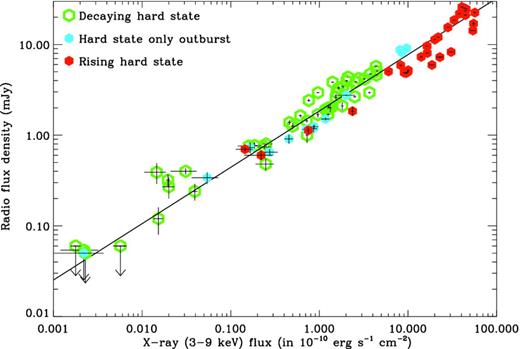
Same as Fig. 4 but with the data points separated by the type of hard state within outburst: rising hard state (filled red hexagons), decaying hard state (empty green hexagons) and outburst in persistent hard state only (filled blue hexagons). The full line corresponds to the fit to the new whole sample.
The new data points lie very close to the original correlation, illustrated by the red points in Fig. 4 and the updated fit (dashed line) to the old data (taking into account the upgrade of the RXTE/PCA softwares and calibration). In addition, they extend the correlation further to lower and higher fluxes. The new sample covers almost five decades in X-ray flux and confirms that the correlation between radio and X-ray fluxes in the hard state of GX 339−4 is indeed very strong. The correlation is remarkably stable over a period of 15 years, even though several full outbursts (separated by off states) occurred during this period, which might have affected the structure/geometry of the accretion flow.
By looking at Fig. 4, which compares the original and new measurements, we note a significant dispersion (beside measurement errors) of the data points around the fitted function. This dispersion is also well illustrated by Fig. 5, where data points are separated according to the phase (rise or decay) of an outburst. We recall that data points from the original correlation mostly originated from the decay of the 1998–99 outburst. The new data allow us to sample the rising hard state (not observed before with ATCA), that is known to reach a higher luminosity than the decaying hard state (Maccarone & Coppi 2003). As expected, higher levels of radio and X-ray emission are observed during the rising hard state. The higher dispersion above ∼10−10 erg s−1 cm−2 is partly related to differences between the rise and decay of outbursts. Indeed, the decaying hard state tends to be more radio bright for a given X-ray luminosity (or more X-ray faint for a given radio luminosity). This will be further discussed in Section 3.4 on several individual outbursts.
3.3.2 Comparison with the OIR/X-ray flux correlation
The radio emission from GX 339−4 in the hard state originates from the self-absorbed compact jets (Corbel et al. 2000). With an inverted radio spectrum (i.e. a positive spectral index, α, and a definition of the flux density, Sν, as Sν ∝ να), the synchrotron emission from the compact jets also reaches the infrared range (Corbel & Fender 2002; Homan et al. 2005; Russell et al. 2006; Gandhi et al. 2011), implying that a strong correlation between the near-infrared and X-ray fluxes should also exist. This has indeed been demonstrated by Coriat et al. (2009) for the 2002–2007 period (see also Homan et al. 2005).
We plot in Fig. 6 our new radio/X-ray sample together with the entire infrared/X-ray sample from Coriat et al. (2009). The total magnitudes have been converted to flux units using a total extinction of AV = 3.7 mag (see Coriat et al. 2009; Buxton et al. 2012, for more details). With a radio to infrared spectral index that is usually positive, it is not surprising to find brighter infrared emission than radio emission for a given X-ray flux (we note that the accretion disc may eventually contribute slightly to the near-infrared emission at low flux.). As demonstrated by Coriat et al. (2009), a broken power law was necessary to fit the near-infrared/X-ray sample (χ2 = 584 for 130 degrees of freedom), and here the radio/X-ray sample was fitted with a single power law (χ2 = 6001 for 94 degrees of freedom). We cannot constrain the presence of a break in the radio/X-ray flux correlation due to the low number of radio detections at low flux density. The resulting reduced χ2 further indicates that intrinsic variability is also present along the fitted functions. The variance of the residuals (data over model) is 0.026 for the near-infrared/X-ray sample and 0.14 for the radio/X-ray sample. This highlights (see also Fig. 6) a larger dispersion for the radio data along the fitted function compared to the near-infrared sample.
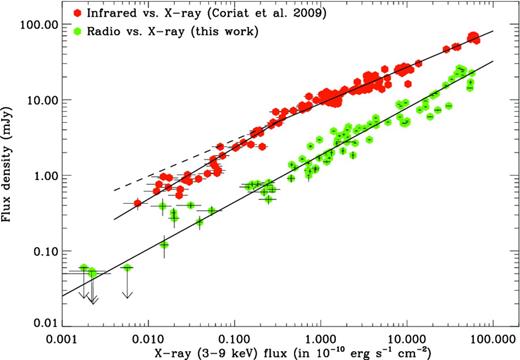
9 GHz radio emission (green points) and H band (1.6 μm) near-infrared emission (red points from Coriat et al. 2009) from GX 339−4 versus the un-absorbed 3–9 keV flux. The solid lines represent the fitting function according to the sample. For the infrared data, the dashed line illustrates the break at low X-ray flux.
3.4 Focus on some individual outbursts
We now turn to a more detailed discussion of three outbursts that have been well covered in radio and in particular the early phase of the decaying hard state when the compact jets are building up. It is important to understand the nature of the larger dispersion (not of statistical origin) of the radio data, especially in light of possible difference in the normalization between the rising and decaying hard states (e.g. Russell et al. 2007, for XTE J1550−564).
3.4.1 The 2004–2005 outburst
In early 2004, GX 339−4 began a new outburst (Buxton et al. 2004), which ended around mid-2005. The radio coverage of the hard states was much better than during the previous outbursts with eight observations during the rise and nine observations during the decay phase. The initial hard state was covered from 2004 February 3, i.e. before the X-ray detection of the outburst (Smith et al. 2004) and ended on March 19 (close to the top of the right branch of the HID). It then spent almost five months in this part of the HID before starting a transition to a softer state around 2004 mid-August (Buxton & Bailyn 2004a; Homan 2004; Belloni et al. 2006). According to Buxton & Bailyn (2005), GX 339−4 underwent a transition back to the hard state around 2005 mid-April. When the first ATCA observation was conducted on 2005 April 21, the radio emission from GX 339−4 was already decaying with an inverted spectrum (spectral index of 0.14 ± 0.03), suggesting the full reactivation of the compact jets.
Fig. 7(a) illustrates the location of the radio and X-ray measurements for the 2004/05 outburst compared to the fit for the whole 1997–2012 sample. In early 2004 February, at the faintest level of radio/X-ray emission, GX 339−4 was close to the global correlation. As the outburst evolved during the rising hard state, GX 339−4 moved significantly below this track. For the decay, a slightly different behaviour can be noticed once GX 339−4 moved back to the hard state. In the initial part of the 2005 decay, at the brightest level of radio/X-ray emission, GX 339−4 was slightly above the global correlation. The difference between the rise and decay tends to lower at fainter X-ray fluxes. For this decay, the radio spectra are always consistent with optically thick synchrotron emission, which characterizes the compact jets. The correlations are therefore not affected by potential ‘relic’ optically thin synchrotron emission from previously ejected plasma that could interact with the ambient medium (Corbel et al. 2010b).
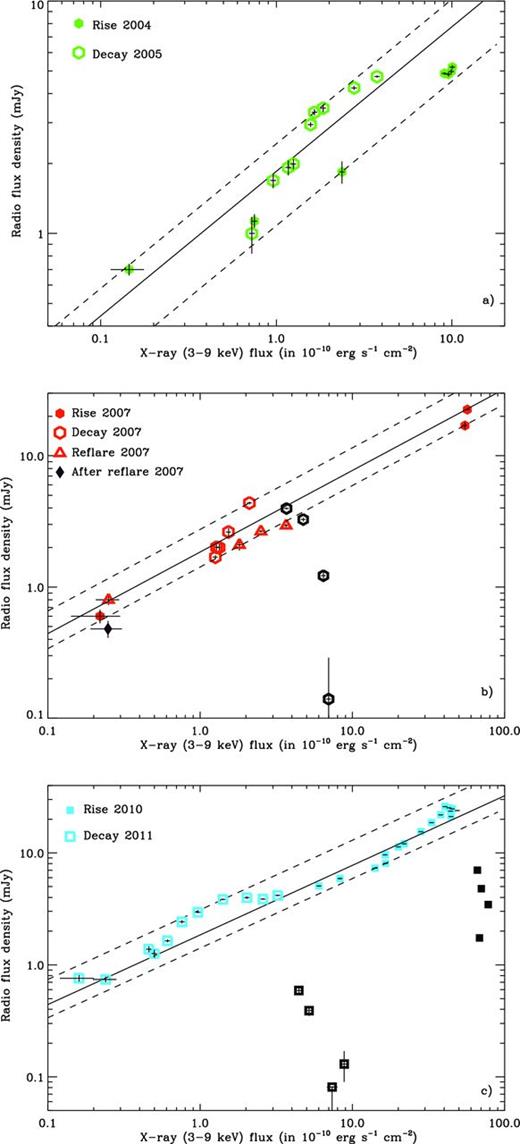
9 (or 8.6) GHz radio flux density from GX 339−4 versus the un-absorbed 3–9 keV flux for the X-ray rise (filled symbols) and the X-ray decay (empty symbols) for the three outbursts of GX 339−4 with good radio coverage during both the X-ray rising and decaying hard states. The epoch of outburst is highlighted in the top left corner of each panel. The time of the reflare in 2007 is also indicated in the middle panel. The solid line illustrates the fit to the whole 1997–2012 sample with a function of the form FRad ∝ FbX (as discussed in Section 3.3.1). The dashed lines illustrate the variation in normalization of the fitted function needed to accommodate the observed flux variations between the rise and the decay with the slope fixed to the value obtained for the whole sample. The black hexagons and squares in the middle and bottom panels illustrate the turn-off (filled) and turn-on (empty) of the compact jets. Note that the axis ranges are not identical in all figures.
If we compare the brightest measurements during the 2004 rise and the 2005 decay of the outburst, we find that the decaying hard state is significantly more radio bright for a given X-ray flux (or less X-ray bright for a given radio flux density) compared to the rising hard state. We find a difference of a factor of ∼2.25 in normalization if we fix the slope to the value obtained for the full sample (see dashed lines in Fig. 7). The difference is particularly important if we consider the soft to hard state transition, once the compact jets are being rebuilt. This slow evolution of the correlation is clearly one of the reasons for the scatter in the radio/X-ray correlation. This behaviour will be discussed in more detail in Section 4.
3.4.2 The 2007 outburst
Compared to the previous outbursts, the one that occurred in 2007 was rather short. Indeed, with a reactivation in 2006 November (Swank et al. 2006, Section 2.4), the transition to the soft state occurred in 2007 March (Motta, Belloni & Homan 2009), with a transition back to the hard state after mid-May (Kalemci et al. 2007). The X-ray flux decreased up to mid-June, when a new hard state reflare was observed (see Fig. 3). It was associated with a re-brightening in radio, infrared and X-ray (Tomsick et al. 2008; Coriat et al. 2009).
One radio observation was conducted at very faint fluxes close to the detectable onset of the outburst (Section 2.4), whereas two other radio observations occurred in the brightest portion of the rising hard state (on the same day – February 4 – but separated by 12 h), i.e. close to the top of the right branch in the HID. These three observations are plotted (filled red hexagon) in Fig. 7(b). We can simply note that they are consistent with the global radio/X-ray correlation. One may possibly see, at high X-ray flux, a potentially rapid increase in the radio emission from GX 339−4 (see also the 2002 and 2010 rises in Fig. 8) that could possibly be related to the onset of a radio flare (e.g. Gallo et al. 2004). However, those flares usually occur at much lower X-ray hardness (Fender et al. 1999) (it is also likely the case in GX 339−4; e.g. see Section 3.4.3) and is probably not a valid explanation for the observed increase here.
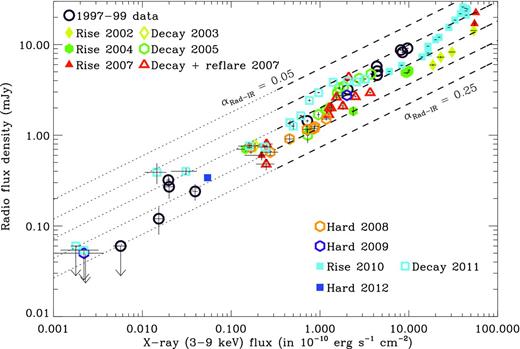
9 GHz radio emission from GX 339−4 versus the un-absorbed 3–9 keV flux for the whole 1997–2012 period. The different outbursts are highlighted, as well as some individual portions (e.g. rise or decay) if necessary. The lines correspond to the estimated (not a fit) radio flux densities based on the relation of Coriat et al. (2009) using the observed near-infrared/X-ray correlation (valid for X-ray fluxes above 3 × 10⁻¹¹ erg s−1 cm−2, a region highlighted by the thicker lines), only assuming a radio to near-infrared spectral index, αRad-IR, ranging from 0.25 to 0.05 with a step of 0.05. The extrapolation to lower fluxes is indicated by the dotted lines (but see text for cautions).
The decay in 2007 has also been well sampled in term of radio observations with the ATCA. Indeed, for the first time, the onset of the compact jets has been observed during the transition from the intermediate to the hard state (see also Corbel et al. 2000 and the 2011 decay). The radio spectra are initially consistent with optically thin synchrotron. But as the radio emission rapidly increases (see black hexagons in Fig. 7b), it becomes and stays optically thick. As the focus of this paper is the long-term study of the radio X-ray correlation in GX 339−4, we will discuss this aspect together with the behaviour at different wavelengths in a forthcoming paper. We note that, during the formation of the compact jets, the 3–9 keV X-ray emission from GX 339−4 steadily declined as usual in the hard state. Once the radio emission is fully consistent with the compact jets, the radio emission also gradually decreases.
In terms of the radio/X-ray correlation, the data points during the decay (Fig. 7b) are indicated by the open red hexagons, whereas the open red triangles highlight the reflare during this decay. Despite only five radio observations for this standard decay (as the re-flare occurred soon after the hard state transition), we again note that for a given X-ray flux, GX 339−4 appears more radio bright during the decay compared to the rise. A change in the normalization of a factor of at least 1.94 would be needed if we want to move the lower track (associated with the rising hard state) to accommodate the brightest radio observation in the decay (keeping the slope fixed to the value obtained for the full sample).
Regarding the re-flare portion of the 2007 activity, we can simply note that all data points are strongly correlated with a slope consistent with the global correlation. A radio observation conducted on November 27 after the end of the 2007 re-flare (black diamond) is also indicated. It corresponds to a period of very weak residual hard state activity from GX 339−4. It is again globally consistent with the overall correlation.
3.4.3 The 2010–2011 outburst
A new full outburst began in 2010 as first noted by the Monitor of All-sky X-ray Image X-ray monitoring (Yamaoka et al. 2010). After an initial hard state (Corbel et al. 2010a; Tomsick 2010), a transition to the soft state was reported by Belloni, Motta & Muñoz-Darias (2010). The transition back to the hard state occurred around 2011 mid-January (Muñoz-Darias et al. 2011; Russell & Lewis 2011). Compared to previous outbursts, the rising hard state has been well covered with 20 radio observations conducted almost up to the transition to the soft state. The very early part of the rise has, however, not been sampled this time. A similar number of observations was conducted for the decaying hard state, meaning that it is the best sampled outburst with the most sensitive (due to CABB) ATCA radio observations.
Inspection of the radio and X-ray measurements in Fig. 7(c) shows that they are rather well correlated and consistent with the global correlation discussed in the previous subsections. However, as the outburst evolves in the rising hard state, we note that GX 339−4 seems to get more radio bright (or less X-ray bright) for a given X-ray flux, possibly implying a steeper correlation at higher flux. This steepening of the correlation at higher flux (very close to the peak flux in hard state) may possibly be recurrent phenomena, as similar behaviour seems to be present also in 2002 (Fig. 8) and 2007 (see Section 3.4.2). At the end of the hard state, the radio emission starts to be quenched as observed previously (Fender et al. 1999; Corbel et al. 2000). It also indicates that the major radio flare in GX 339−4 occurs at a hardness significantly below the one defined by the hard state.
The transition back to the hard state occurred at lower X-ray flux defining a hysteresis cycle (Maccarone & Coppi 2003). Similarly to 2007, the radio emission is initially optically thin (open black squares in Fig. 7c). The radio emission then becomes and remains optically thick (a signature of a full re-building of the compact jets) once GX 339−4 gets close to the global radio/X-ray correlation. Again, similarly to the decay in 2005 and 2007, it is initially above the standard correlation and as the X-ray emission decays, GX 339−4 is observed to move back to the global correlation. In the very bright parts of the hard state (and close to the state transition), significant thermal emission from the accretion disc could contribute to the X-ray spectrum. If we only keep the contribution from the power law, the points close to the transition (black squares in Fig. 7c) move obviously towards lower X-ray fluxes, but not back to the global correlation (as it may be the case in Cyg X−1; Zdziarski et al. 2011).
If we adjust a line to fit the two extremes in the radio and X-ray diagram (lower track for the rising hard state in 2010 and upper track for the decaying hard state in 2011) but with a slope fixed to the global correlation, we need a factor of 2.19 (identical to 2004–2005) to accommodate the observed variations. Again, the larger dispersion along the global correlation occurs around the time of compact jet formation.
4 DISCUSSION
We have presented a set of 100 quasi-simultaneous radio and X-ray observations of GX 339−4, including 12 observations close to state transitions. This constitutes the largest sample of measurements over a broad range of fluxes and also over the longest time period for a BH in the hard state. In addition, this long-term study of GX 339−4 allows us to present the evolution of the radio/X-ray flux correlations over several outbursts separated by off states for a given BH without any bias from distance uncertainties. This makes GX 339−4 the reference source for comparison with other accreting sources (BHs, neutrons stars, white dwarfs and AGN). The main characteristics from the new set of data can be summarized as follows.
Despite numerous outbursts of different nature (full or hard state only) during a 15-yr period, the overall correlation between the radio and X-ray fluxes is strongly maintained. It is observed over five decades in X-ray flux and three decades in radio flux. By fitting all measurements (radio flux density at 9 GHz in mJy, Frad, and unabsorbed 3–9 keV X-ray flux in unit of 10−10 erg s−1 cm−2, FX) with a function: Frad = aFbX, we obtained a = 1.85 ± 0.02 and b = 0.62 ± 0.01. The faintest levels of X-ray and radio emission, possibly GX 339−4 in quiescence, are also consistent with the global correlation.
We note a significant dispersion around the fitting function in the radio/X-ray diagram that appears more pronounced than for the IR/X-ray correlation (from Coriat et al. 2009). However, the dispersion of the radio measurements does not occur randomly. The strongest deviation seems to occur in periods when the compact jets are turning on, during the soft to hard state transition (see 2005, 2007 and 2011 decaying hard states; see Fig. 7). Additional deviations may exist at higher flux during the rising hard state.
During the period of compact jet formation in the decaying hard state (<3 per cent LEdd for a 6 M⊙ BH at 8 kpc), we note that GX 339−4 seems to be more radio bright (or less X-ray loud) than during the corresponding rising hard state, resulting in a difference of normalization of the order of 2 that seems constant over the outburst history of GX 339−4.
4.1 A coupled radio, near-infrared and X-ray correlation
In Corbel et al. (in preparation), we study in detail the formation of the compact jets during the soft to hard state transitions. We show that the compact jets first turn on at radio frequencies and then in the OIR (a conclusion that has also recently been reached by Miller-Jones et al. 2012). However, the time-scale to reach the peak is much longer in the near-infrared compared to the radio domain (see e.g. also fig. 5 in Coriat et al. 2009). The consequence is that the radio emission quickly decays, whereas the near-infrared emission is still rising, when the 3–9 keV X-ray flux is steadily decreasing. This implies a significant evolution of the radio to near-infrared spectra (equivalent to major changes in the radio to near-infrared flux ratio; e.g. see Coriat et al. 2009) during the soft to hard state transition.
The dispersion in the near-infrared/X-ray flux correlation is smaller than in a comparison between radio and X-ray emissions (Section 3.3.2). This is consistent with the standard picture where the NIR emission zone is located close to the base of the jet and is therefore more tightly connected to the X-ray emitting flow than the termination of the compact jets where the radio emission arises. In that case, the exact location of GX 339−4 in the radio/X-ray flux diagram would then be influenced by the radio to near-infrared spectral index (or similarly by the radio to near-infrared flux ratio), i.e. the internal energetic balance of the compact jets.
However, a constant radio to near-infrared spectrum (i.e. αRad-IR = constant) should normally lead to a dependence between radio and X-ray emission of the same kind as observed between infrared and X-ray emission, i.e. FRad ∝Fb2x (with b2 = 0.48 ± 0.01; Coriat et al. 2009). This is not what is exactly observed as we found FRad ∝Fbx, with b = 0.62 ± 0.01 (Section 3.3.1). But, equation (2) also highlights an extra dependence of the normalization with the radio to near-infrared spectral index αRad-IR that could influence the exact location of GX 339−4 in the radio/X-ray flux diagram (beside the X-ray flux) and could affect the fitted correlation index b.
As a complementary comparison, we plot in Fig. 8 the simultaneous radio/X-ray measurement for the various outbursts of GX 339−4. The different lines (not a fit) correspond to the predicted radio fluxes based on the measured infrared/X-ray correlation (equation 2) from Coriat et al. (2009) (we use the functional form with no break that is valid for 3–9 keV flux above ∼3 × 10⁻¹¹ erg s−1 cm−2.), assuming a radio to near-infrared spectral index αRad-IR in the range of 0.05 to 0.25, which are typical values for the hard state. These small changes in the radio to near-infrared spectral index are sufficient to explain the overall dispersion in the radio and X-ray flux correlation, especially the larger dispersion above ∼10−10 erg s−1 cm−2(because it corresponds to larger variation in αRad-IR; see Corbel et al., in preparation). Such an evolution of the radio to near-infrared spectral index could simply be due to deviation from the simple Blandford–Königl model used for compact jets (such as different jet geometry and/or different electron energy distributions; e.g. Heinz 2006; Kaiser 2006) or the efficiency of particles acceleration in the jets (Corbel et al., in preparation).
However, one needs to be cautious with equation (2), which assumes that the near-infrared observing band lies on the optically thick part of the jet spectrum. While this should be fine at high flux (although not really tested), this may not be the case at lower flux (see Coriat et al. 2009 for more details). Furthermore, the near-infrared emission of GX 339−4 at high flux in the hard state is dominated by the compact jets [e.g. the large drop in OIR emission during the hard to soft state transitions; Homan et al. 2005; Coriat et al. 2009; Buxton et al. 2012), but the thermal emission from the accretion disc may contribute at low flux in the total near-infrared emission from GX 339−4. Therefore, the thick lines in Fig. 8 should be a guide to highlight a possible link between radio, near-infrared and X-ray emission, but the full understanding of the radio to near-infrared SED is beyond the scope of this paper.
4.2 The ‘Universal’ radio/X-ray flux correlation
4.2.1 The ‘standard’ track
The new sample of GX 339−4 provides a new opportunity to compare the radio and X-ray emission of Galactic accreting binary BHs and neutron stars. In Fig. 9, we report our new data of GX 339−4 along with the measurements from published studies representing a total of 24 BHCs. This includes the very few sources with very good radio and X-ray coverage [i.e. V404 Cyg from Gallo et al. (2003b) and Corbel et al. (2008); H 1743−322 from Coriat et al. (2011a); GRS 1915+105 from Rushton et al. (2010), Swift J1753.5−0127 from Soleri et al. (2010), MAXI J1659−152 from Ratti et al. (2012) and XTE J1752−223 from Jonker et al. (2012) and Brocksopp et al., in preparation] and the very few measurements from additional sources reported in more global studies (e.g. Gallo et al. 2003b; Calvelo et al. 2010; Fender, Gallo & Russell 2010; Coriat et al. 2011b) or individual reports (e.g. IGR J17177−3656 from Paizis et al. 2011; IGR J17091−3624 from Rodriguez et al. 2011). To avoid confusion in the figure, we do not plot the large group of measurements related to Cyg X−1. Two neutron star systems are also reported for comparison: Aql X−1 from Tudose et al. (2009) and Miller-Jones et al. (2010) and 4U 1728−34 from Migliari & Fender (2006). In addition, we also report the quiescence levels of a sample of BH binaries (Calvelo et al. 2010; Miller-Jones et al. 2011). All X-ray luminosities have been converted to the 1–10 keV band and we used the updated distances from Fender et al. (2010, and references therein). For some sources, especially towards the Galactic bulge, the distance may be unknown and is assumed to be at 8 kpc.
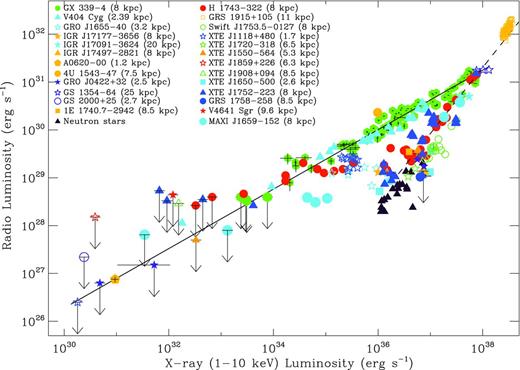
Radio and X-ray (1–10 keV) luminosities for Galactic accreting binary BHs in the hard and quiescence states (see text for references). It illustrates the standard correlation (defined by sources such as GX 339−4 or V404 Cyg with index ∼0.6) and the new correlation for the outliers (defined by e.g. H 1743−322 or Swift J1753.5−0127 with index ∼1.4). The solid line illustrates the fit to the whole 1997–2012 sample of GX 339−4 (as discussed in Section 3.3.1) with an extrapolation to the quiescence state of BHs. The dashed line corresponds to the fit to the data for H 1743−322, one of the representatives for the outliers (Coriat et al. 2011a). Upper limits are plotted at the 3σ confidence level. For a few sources, their distances are unknown.
With the distances of GX 339−4 (Zdziarski et al. 2004) and V404 Cyg (updated in Miller-Jones et al. 2009), these two sources now share the same track in the radio/X-ray diagram. The updated fit to the whole GX 339−4 sample is represented in Fig. 9 by the solid line. The quiescent level of A 0620−00 (Gallo et al. 2006) is remarkably consistent with an extrapolation of the GX 339−4 fit to lower fluxes. However, the exact track of A 0620−00 during its outburst is unknown as no radio observation was conducted during its hard state at that epoch (see also Yuan, Yu & Ho 2009). All other upper limits from quiescent BHs do not contradict the extrapolation of the correlation defined by GX 339−4. The extension of the radio/X-ray correlation with index ∼0.6, as determined by the new data of GX 339−4, down to the faintest levels of emission from Galactic BH binaries, implies that the standard correlation could be stable (despite minor deviations within an outburst) over more than eight decades in X-rays and six decades in radio luminosities. Furthermore, no break in the correlation is observed at lower luminosity with the available data (as expected in some theoretical model; e.g. Yuan & Cui 2005), but this could occur at even lower luminosity (Yuan et al. 2009). This means that more sensitive observations (e.g. with the upgraded Jansky Very Large Array (JVLA) and ATCA and/or the forthcoming Square Kilometer Array pathfinders) of quiescent BHs (or BHs in their decaying hard state) would be needed to better constrain the slope of the correlation at low luminosities, as it currently relies only on the quiescence level of A 0620−00, V404 Cyg and possibly now also GX 339−4.
4.2.2 The ‘outliers’ track
A growing number of sources [originally XTE J1650−500 (Corbel et al. 2004), IGR J17497−2821 (Rodriguez et al. 2007), Swift J1753.5−0127 (Cadolle Bel et al. 2007; Soleri et al. 2010)] are now detected significantly below the standard correlation. The number of these outliers is rapidly increasing (see Fig. 9). At a 1–10 keV luminosity above 4 × 1036 erg s−1, the group of outliers seems to be consistent with the track followed by H 1743−322 with a steeper correlation index of ∼1.4 (Coriat et al. 2011a), and also quite similar to the few reported neutron star systems (Migliari & Fender 2006). In any case, this larger data set confirms the existence of two tracks in the radio/X-ray flux correlation at higher X-ray flux, but still in the hard state (recently statically proved by Gallo et al. 2012). It is unclear for the group of outliers if the normalization of the correlation is similar or not, as some dispersion is also observed along the H 1743−322 track. Furthermore, as found by Coriat et al. (2011a,b) and reinforced here with the increased number of sources (e.g. MAXI J1659−152 and XTE J1752−223; Ratti et al. 2012; Jonker et al. 2012; Brocksopp et al., in preparation), at luminosity below 4 × 1036 erg s−1 the outliers seem to leave the H 1743−322 track and join the standard correlation around 1035 erg s−1.
The spin of the BH (Fender et al. 2010), as well as the binary parameters (orbital period, accretion disc size, inclination; Soleri & Fender 2011), does not seem to play a role in defining the level of jet power. By using a jet toy-model with an increasing bulk Lorentz factor above 10−3LEdd, Soleri & Fender (2011) were able to reproduce the larger scatter for the brighter hard state (the zone of the outliers). It is, however, clear from Fig. 9 that the outliers are a separate population from the sources lying on the standard correlation (see also Gallo et al. 2012). The radio/X-ray diagram is not uniformly populated, as would have been expected if the two populations were related to a uniform distribution of inclination angle (and henceforth Lorentz factor). The existence of a critical magnetic field (Casella & Pe'er 2009) has also been invoked to explain the lower radio luminosity for the outliers, but then it also needs to explain the existence of two populations as well as the steeper correlation index. In order to find an explanation of the outliers by a lower radio luminosity (or jet power), it may then be necessary to invoke a different coupling between jet power and mass accretion rate (see Coriat et al. 2011a for more details).
Instead of characterizing the outliers by fainter jet power (as in Soleri & Fender 2011), one may instead consider these sources as being more X-ray bright than the ones from the standard correlation, meaning that the understanding of the correlations would be related to the origin of the X-ray emission process(es). We would then be left with two groups of sources above 4 × 1036 erg s−1 (one with an index of ∼1.4 and the other one with the typical index of ∼0.6). It seems apparent that only the ∼0.6 track exists at lower radio and X-ray luminosities. Coriat et al. (2011a, and references therein) have extensively discussed the nature of these two groups. In that framework, the outliers would be consistent with the presence of radiatively efficient BHs in the hard state (hot accretion flows or accretion disc corona). The standard correlation would still be related to a radiatively inefficient accretion flow (such as X-ray jets or ADAF models). The difference between the two populations could possibly be related to variation in the α viscosity parameter (Xie & Yuan 2012).
4.2.3 Caveats on constraining the slope of the correlation using portion of one individual outburst
The global results presented in this study for GX 339−4 or in Coriat et al. (2011a) for H 1743−322 allow us to characterize the evolution of the radio and X-ray fluxes correlation for a given source along very different outbursts. While the global correlation is maintained with a specific slope (∼0.6 for GX 339−4 or ∼1.4 for H 1743−322), we note that temporary deviations do exist. This happens for GX 339−4 several times, mostly in the decaying hard state once the compact jets have been fully rebuilt (see 2005, 2007 and 2011 for the decay), but also possibly even at higher fluxes (although it is not so clear at present, see end of rises in 2002, 2007 and 2010). During these limited portions of outburst, correlation indices in the 0 to 2 range can temporarily be observed. It also happens to H 1743−322 which shows two tracks and a transition (with a flatter index; Jonker et al. 2010; Coriat et al. 2011a) between the two tracks. Additionally, we note that other sources have also been observed with different correlation indices (e.g. GRO J1655−40; Shaposhnikov et al. 2007; Xue & Cui 2007). This concerns Galactic BHs (and probably also accreting neutron star binaries).
The observed variations of the correlation index in GX 339−4 (see Fig. 7) occur over a 3–9 keV flux range of roughly a decade. Several reasons could be invoked to explain temporary variations of the correlation index, such as changes in the radio spectral index or the radio to near-infrared spectral index (as discussed in Section 4.1), an increase in the importance of electrons cooling in the jets, the presence of an additional X-ray emitting component, etc. In order to properly constrain the global correlation index, the 3–9 keV (or a similar X-ray band) flux should be sampled over more than a decade in X-ray flux, and probably observations over two decades in X-ray flux should provide a reasonable estimate of this index (e.g. see the example of H 1743−322; Coriat et al. 2011a). However, if the source is an outlier (Section 4.2.2), special care should be taken (with regular monitoring) in order to separate the different tracks (mixing the 1.4 track with observations taken during the transition to the standard 0.6 track could lead to a different index).
As the correlation has been extended to AGNs (Merloni et al. 2003; Falcke et al. 2004), it also means that very different correlation indices could potentially be measured in supermassive BHs with very limited data sets (e.g. King et al. 2011). Therefore, one has to be very careful before generalizing the slope of the correlation from a very specific portion of an outburst. Only very long studies sampling large radio and X-ray flux variations of a given source (or a large sample of different sources with known distance) could reveal the intrinsic empirical relations necessary to understand the coupling between accretion and ejection mechanisms in accreting BHs.
4.3 On the nature of ‘hysteresis’ in OIR
During the 2000 outburst of XTE J1550−564, Russell et al. (2007) plotted the infrared versus X-ray emission and reported quasi-parallel tracks for the rising and decaying hard states. This phenomenon, that they called ‘hysteresis’, has been reported to date only in XTE J1550−564. Whereas, the difference in normalization between the rise and decay is a factor of 5 in XTE J1550−564 (Russell et al. 2007); Coriat et al. (2009) already pointed out that no difference could be seen in infrared between the rise and decay of GX 339−4, despite an intense monitoring over five years. However, as discussed in Section 3.4, we found some differences in radio between the decaying and rising hard states. This occurs roughly during the period of formation and destruction of the compact jet (similarly to XTE J1550−564). Although we clearly do not have parallel tracks in the case of GX 339−4, we possibly observed changes up to a factor of 2 in terms of variation in the normalization of the radio track. Similarly to XTE J1550−564, the jet radio emission in GX 339−4 is sometimes brighter during the decay compared to the rise for a given X-ray luminosity. The radio observations conducted during the 2000 outburst of XTE J1550−564 (Corbel et al. 2001) are too sparse to be compared with the infrared data.
To explain the ‘hysteresis’ in XTE J1550−564, Russell et al. (2007) considered changes in the radiative efficiency of the accretion flow, variations in the viscosity parameter α or modification in the jet properties. Amongst these different scenarios, one needs to find one that could explain the limited ‘hysteresis’ in GX 339−4 (only a factor of 2 in radio and no difference in near-infrared). In GX 339−4 and XTE J1550−564, the radio and infrared emissions in the hard states originate from the compact jets. The fact that no difference is observed in the near-infrared for GX 339−4 possibly implies that the origin of this ‘hysteresis’ is not solely related to the X-ray emission process(es), but rather to the compact jets.
As discussed in Section 4.1, the radio, near-infrared and X-ray emissions of GX 339−4 are strongly coupled. It is then possible that this ‘hysteresis’ is only determined by the SED of the compact jets and therefore traces the jet behaviour (rather than the accretion flow). The level of ‘hysteresis’ and the involved spectral domain could possibly be related to the evolution of the break frequency where the jets become optically thin, but also to the evolution of radiative efficiency along the jets, the interplay between the jets and the corona and/or the efficiency of particles acceleration. Alternatively, the magnetization of the disc (Petrucci et al. 2008) could possibly modify the broad-band SED of the jets.
5 CONCLUSIONS
We reported a series of radio and X-ray observations of the recurrent BH GX 339−4 during the past 15 years. This new set of observations samples almost all luminosity levels (nearly five decades in X-ray flux), possibly down to quiescence, of a BH along several different outbursts. GX 339−4 can therefore be considered a reference for comparison with other accreting sources without any bias from distance uncertainties.
Despite numerous outbursts of different nature, the overall radio and X-ray emissions display a very strong non-linear correlation with a coupling of the form LX∝L0.62 ± 0.01Rad. This very well constrained correlation index is consistent with previous studies that highlighted an index in the range of 0.5 to 0.7. The same correlation seems to be maintained from the brightest hard states to the lowest detected luminosity level that could be consistent with the quiescence state of GX 339−4. With the reported long-term near-infrared/X-ray fluxes correlation in GX 339−4 (Coriat et al. 2009), we further demonstrated a coupled correlation between these three frequency ranges. The level of radio emission could then be tied to the near-infrared emission by the evolution of the jet broad-band SED (assuming that the near-infrared data lie on the optically thick portion of the compact jet spectrum).
We also highlighted periods of significant and higher dispersion along the fitted function in the radio/X-ray sample, when compared to the near-infrared/X-ray data. This appeared more pronounced in periods of formation and destruction of the self-absorbed compact jets. For a given X-ray flux, the radio emission could be higher (up to a factor of 2) during the decay compare to the rise of the outburst, whereas no difference was found in near-infrared (Coriat et al. 2009). By comparing this behaviour with a similar one in XTE J1550−564 (Russell et al. 2007), this ‘hysteresis’ behaviour seems to be related to the properties of the compact jets.
We incorporated our new data of GX 339−4 in a more global study that includes a set of 24 BHCs. We observed that the ‘standard’ track, that is now well constrained by GX 339−4, is closely shared by a subset of these BHCs (e.g. V404 Cyg). The quiescent BH A 0620−00 is the faintest reported source (more than 2 orders of magnitude fainter than GX 339−4; Gallo et al. 2006) and it obeys the standard track that is defined with our large GX 339−4 sample. Furthermore, we collected a growing number of sources (the majority in fact) that appear significantly below the ‘standard’ track (see also Gallo et al. 2012); those ‘outliers’ may possibly share the behaviour reported for H 1743−322, meaning that they could join the standard correlation at low and/or high X-ray fluxes. We emphasize that special care should be taken to constrain the index of the correlation in very limited sample, as this index can only be securely obtained with more global studies such as the one we conducted with GX 339−4. The location of a source in a given track of the radio/X-ray diagram could be related to the radiative efficiency of the inner accretion flow or a different coupling between jet power and mass accretion rate (Coriat et al. 2011a). While the standard track has been extended to supermassive BHs by the so-called ‘Fundamental Plane of BHs activity’ (Merloni et al. 2003; Falcke et al. 2004), the existence a population similar to the ‘outliers’ within AGNs would be a strong support for scale invariance of the jet–accretion coupling in accreting BHs (see recent work of Broderick & Fender 2011).
The authors would like to thank the anonymous referee for the careful reading of the manuscript. The Australia Telescope is funded by the Commonwealth of Australia for operation as a national Facility managed by CSIRO. The research leading to these results has received funding from the European Community's Seventh Framework Programme (FP7/2007–2013) under grant agreement number ITN 215212 ÓBlack Hole Universe. JAT acknowledges partial support from NASA Swift Guest Observer grant NNX10AK36G and also from the NASA Astrophysics Data Analysis Program grant NNX11AF84G. MMB and CDB are supported by NSF/AST grants 0407063 and 070707 to CDB. We acknowledge the use of data obtained from the High Energy Astrophysics Science Archive Research Center (HEASARC), provided by NASA’s Goddard Space Flight Center. We thank the ISSI in Bern where an earlier version of this work was discussed. SC would like to thank Sera Markoff, James Miller-Jones, Dave Russell, Wenfei Yu, Feng Yuan, Andrzej Zdziarski for discussions, Jérome Rodriguez for a careful reading of the manuscript, Jeroen Homan and Tomaso Belloni for sharing information on the X-ray states of GX 339−4 during the past years, Craig Markwardt for information on the RXTE Galactic Bulge monitoring and Anthony Rushton for sharing the data of GRS 1915+105.
