


Abstract
In this paper we present X-Shooter time-resolved spectroscopy and RXTE PCA light curves of the ultra-compact X-ray binary candidate 4U 0614+091. The X-Shooter data are compared to the GMOS data analysed previously by Nelemans et al. We confirm the presence of C iii and O ii emission features at ≈4650 Å and ≈5000 Å. The emission lines do not show evident Doppler shifts that could be attributed to the motion of the donor star/hotspot around the centre of mass of the binary. We note a weak periodic signal in the red-wing/blue-wing flux ratio of the emission feature at ≈4650 Å. The signal occurs at P = 30.23 ± 0.03 min in the X-Shooter and at P = 30.468 ± 0.006 min in the GMOS spectra when the source was in the low/hard state. Due to aliasing effects the period in the GMOS and X-Shooter data could well be the same. We deem it likely that the orbital period is thus close to 30 min; however, as several photometric periods have been reported for this source in the literature already, further confirmation of the 30 min period is warranted. We compare the surface area of the donor star and the disc of 4U 0614+091 with the surface area of the donor star and the disc in typical hydrogen-rich low-mass X-ray binaries and the class of AM Canum Venaticorum stars and argue that the optical emission in 4U 0614+091 is likely dominated by the disc emission. Assuming that the accretion disc in 4U 0614+091 is optically thick and the opening angle of the disc is similar to the one derived for the hydrogen-rich low-mass X-ray binaries we conclude that the donor star may in fact stay in the disc shadow. Additionally, we search for periodic signals in all the publicly available RXTE PCA light curves of 4U 0614+091 which could be associated with the orbital period of this source. A modulation at the orbital period with an amplitude of ≈10 per cent such as those that have been found in other ultra-compact X-ray binaries (4U 0513−40, 4U 1820−30) is not present in 4U 0614+091. We propose that the X-ray modulation found in 4U 0513−40 and 4U 1820−30 could be a signature of an outflow launched during the high/soft state near the stream impact region.
1 INTRODUCTION
The source 4U 0614+091 is a persistent ultra-compact X-ray binary (UCXB) candidate that belongs to the class of low-mass X-ray binaries (LMXBs). UCXBs are characterized by very short orbital periods, typically less than 80 min. The consequence is a secondary star with such a high density that it excludes main-sequence type donor star (Nelson, Rappaport & Joss 1986; Savonije, de Kool & van den Heuvel 1986). The donor star in 4U 0614+091 is most probably a CO white dwarf (WD), based on the emission lines of oxygen and carbon found in the optical spectra and the lack of hydrogen and helium lines (Nelemans et al. 2004; Werner et al. 2006). An additional hint towards a CO WD comes from the detection of the relativistically broadened O viii Lyα emission line (Madej et al. 2010; Schulz et al. 2010). The accretor is a neutron star, since it is showing type I X-ray bursts (Kuulkers et al. 2009). The source shows no eclipses or dips in the light curves. However, due to a very low mass ratio (theoretical estimate based on the suggested orbital period of 50 min is q ≈ 0.01) the threshold for the inclination below which the eclipses and dips are not present can even be higher than 80° (Paczynski 1974; Horne 1985).
The orbital period measurement is important to classify the source as an UCXB and determine its evolutionary stage. In the case of 4U 0614+091 the first claim of the orbital period measurement of ≈50 min was by O'Brien (2005) in high-speed optical data taken with ULTRACAM. The modulation in the optical light curve can occur due to heating of one side of the donor by X-ray irradiation, the superhump phenomenon caused by a tidal deformation of accretion disc, emission from the impact point of the stream with the disc or an asymmetry of the accretion disc. The orbital period of ≈50 min was also suggested by Shahbaz et al. (2008) in IAC80 data and Zhang, Hynes & Robinson (2012) in Otto Struve Telescope data. However, Hakala, Charles & Muhli (2011) analysed a large set of fast optical photometry obtained with the NOT telescope and report no conclusive evidence for the orbital period of this system. In one out of 12 optical data sets the authors found a strong periodic signal at ≈50 min.
The modulations with the orbital periods in the UCXBs were reported not only in optical but also in X-ray light curves (Stella, Priedhorsky & White 1987; Fiocchi et al. 2011). As far as 4U 0614+091 is concerned a periodic modulation of ≈25 min was found in one EXOSAT light curve (Hakala et al. 2011), when the source was in a high flux state. On the other hand, Schulz et al. (2010) folded a Chandra HETGS light curve, when the source was in the low/hard state, with the periods of 41, 51, 62 and 120 min and found no evidence of a periodic modulation.
A powerful method of measuring the orbital parameters in persistent LMXBs or LMXBs in outburst is to measure the Doppler shifts of the high-excitation emission lines of C iii and N iii forming the Bowen blend at ≈4650 Å (Steeghs & Casares 2002). These narrow lines are associated with the irradiated companion star and have been detected in many LMXBs (Casares et al. 2003, 2006; Cornelisse et al. 2007a; Muñoz-Darias et al. 2009).
Another method used to determine the mass ratio is to measure the rotational broadening of the absorption lines originating in the atmosphere of the donor star (Gies & Bolton 1986).
Nelemans, Jonker & Steeghs (2006) analysed a set of time-resolved spectra of 4U 0614+091 taken with Gemini Multi-Object Spectrograph (GMOS) on the Gemini-North telescope and found no signatures of narrow emission lines. Although the source is showing a broad emission blend of O ii and C iii lines at ≈4650 Å the resolution of ≈2 Å might have been too low to detect narrow-line components, if present. The authors found, however, weak evidence for a sinusoidal pattern with a period of 48.547 min in a weak absorption line around 4960 Å (possibly caused by C i), which could result from the absorption in the atmosphere of the donor star.
A spectroscopic measurement of the orbital period has not been successful for any of the UCXBs except for the weak evidence noted by Nelemans et al. (2006). It has been, however, successful for AM Canum Venaticorum (AM CVn) stars. This class of sources consists of a WD accretor with a degenerate or semi-degenerate, hydrogen-poor donor star. They are similar to UCXBs in terms of the mass ratio and chemical composition of the donor star. The Doppler shifts of emission lines found in the optical spectra of AM CVns are caused by the motion of the impact point of the accretion stream on to the accretion disc (e.g. Nather, Robinson & Stover 1981; Roelofs et al. 2005) or, in the case of the very short period system HM Cnc, the irradiated side of the donor star (Roelofs et al. 2010).
In this paper we analyse time-resolved X-Shooter spectra of 4U 0614+091 searching for narrow emission/absorption lines showing periodic Doppler shifts associated with the donor star/hotspot motion around the centre of mass. The X-Shooter resolution of ≈0.9 Å in the blue part of the spectrum gives us a better opportunity to detect the narrow emission components than previous studies using the GMOS instrument (Nelemans et al. 2006). We compare the X-Shooter and the GMOS data. Additionally, we analyse all archival RXTE PCA light curves in search for an X-ray modulation at the orbital period. We separate high and low X-ray flux regimes of the source and look for periodic signals in both of them.
2 OBSERVATIONS AND DATA REDUCTION
2.1 X-Shooter observations
4U 0614+091 was observed with the X-Shooter instrument on five nights from 2010 February 16 to 22 (see Table 1). X-Shooter is an echelle spectrograph operating at the Cassegrain focus of Unit Telescope 2 (Kueyen) on the Very Large Telescope. In a single exposure the instrument covers the spectral range from the UV to the near-IR (NIR) K band in three arms (Vernet et al. 2011). The ultraviolet-blue (UVB) arm covers 3000–5595 Å in 12 orders with a resolution of 5100 (for a 1 arcsec slit width); the visual-red (VIS) arm covers the range 5595–10 240 Å in 14 orders with a resolution of 8800 (for a 0.9 arcsec slit width) and the near-infrared arm covers 10 240–24 800 Å in 16 orders with a resolution of 5300 (for a 0.9 arcsec slit width). The slit widths described here were used during the observations.
The source was observed in the slit stare mode (fixed position on the slit) in all three arms. The binning factor for the UVB and VIS arm spectra was 2 in the spatial direction and 2 in the spectral direction; the NIR arm spectra are by default not binned. The slow readout mode with high gain (100 k/1 pt/hg/2×2) was used for all the nights except the first night when the readout mode was fast with low gain (400 k/1 pt/l g/2×2). The exposure time of every observation was 180 s in UVB and VIS arm. Due to significant thermal background noise in the NIR arm instead of one 180 s exposure, three exposures of 60 s were taken and averaged in one fits file. We reduce the data using the standard X-Shooter reduction pipeline version 1.5.0 (Goldoni et al. 2006; Modigliani et al. 2010). A physical model mode was used during the reduction process in which the solution is obtained by optimizing the instrument physical model parameters to the data. Since the data were obtained in 2010 February during the first, shared-risk semester of X-Shooter operations, no linearity frames are available for these observations, therefore we do not compute the detector gain and linearity (xsh_lingain recipe). The bad pixel map is included only during the NIR arm data reduction process, since it contains significantly more bad pixels than the UVB and VIS arm data. In the UVB arm we use an instrumental response updated by the X-Shooter calibration team which contains a more accurate than currently available in the pipeline flux calibration around 3600–3800 Å (Wolfram Freudling, private communication). In the VIS arm we use the instrumental response file provided with the pipeline. The calibration of the source spectrum is additionally corrected for the instrumental flexures during the observing nights using the xsh_flexcomp recipe. In order to estimate the sky background, a one-dimensional spectrum of the sky is built. The pixels outside of the source extraction region and far from the slit edges are taken. The interpolation of the resulting one-dimensional sky spectrum is done by applying the running median with the default window width of 14 pixels. The optimal extraction is used to obtain the one-dimensional spectrum of the source.
The analysis of the spectra is performed using the molly package developed by Tom Marsh.
2.1.1 Average spectrum
We extract all UVB and VIS spectra from every night and calculate the weighted [based on signal-to-noise ratio (S/N)] average UVB and VIS spectrum (see Fig. 1). The resolution in the output UVB and VIS spectra is ≈0.9 Å. All the spectra are extracted with a wavelength sampling of 0.3 Å and a median smoothing is used with a window width of four bins for UVB arm and five bins for VIS arm. The plate scale is ≈0.32 arcsec pixel−1 for UVB and VIS. We determine the seeing for every observation by measuring the full width at half-maximum (FWHM) of the source profile of each spectrum in the wavelength range 4500–4520 Å (see Table 1; for the seeing measurement the spectra are unsmoothed and binned to the resolution of the instrument). The accuracy of the wavelength calibration in every spectrum is determined by measuring the position of the O i sky lines in all spectra. The sky line at 5577.338 Å has an rms scatter of 0.05 Å (UVB arm) and the sky line at 6300.304 Å has an rms scatter of 0.07 Å (VIS arm).
Since one of the goals of this paper is to look for periodic Doppler shifts in the emission lines that could correspond to the orbital period of this source, we examine the spectra ‘by eye’ in search of prominent emission lines. We confirm the presence of an emission feature at ≈4650 Å reported by Nelemans et al. (2004, 2006) and Werner et al. (2006) corresponding to the blend of C iii and O ii lines (see Fig. 1). We also find weak emission line signatures of O ii at ≈4900 Å and C ii at 7200 Å (Nelemans et al. 2006; Werner et al. 2006). The combination of two different flat-fields (deuterium halogen lamp and quartz lamp) causes a discontinuity in the response curve and results in the artefacts in the flux-calibrated spectra around 3800 Å hence this region is difficult to examine for possible emission features. Therefore, we check individual orders in search for emission lines of O iii mostly (Werner et al. 2006) around 3700 Å. However, we find no significant emission features that could be attributed to the emission lines of oxygen or carbon in that region. The blue part of the UVB spectrum (3000–3600 Å) shows small artefacts (‘bumps’ and ‘dips’) visible also in the spectrum of the standard star possibly caused by imperfect merging of the spectral orders in the region where the S/N of the data is much lower than in the middle and red part of the spectrum.
We extract the median NIR spectrum from all observations taken each night. The resolution of the NIR spectrum is ≈3 Å and plate scale is ≈0.21 arcsec pixel−1. We detect emission at wavelengths where the NIR J, H and K bands occur. Most of the LMXBs are located towards the Galactic centre. Therefore, their optical light is usually highly absorbed. An NIR spectrum could prove an alternative way to study the chemical composition of the donor star of the UCXBs and distinguishing between the CO or He WD. For that reason we look for significant differences between the local thermodynamic equilibrium (LTE) model spectra for UCXBs with a carbon–oxygen and helium WD donor star (Nelemans et al. 2006). There is a strong emission line at ≈ 1.2 μm (blend of C iii transitions: 1199.13, 1198.8 and 1198.12 nm) present only in the CO model. Therefore, its presence could be used to distinguish an UCXB with a CO WD donor from He WD donor star. We examine the wavelength range where this emission line should occur. We find, however, no evidence for the presence of such a line. The upper limit on the flux of this line using the spectrum is also difficult to determine due to the systematic errors in the flux calibration. Due to a poor S/N of the NIR spectra and many residuals from the sky lines subtraction we do not discuss this part of the spectrum further.
2.2 RXTE observations
We choose all of the Standard 2 mode (FS4a*.gz), PCU 2 data obtained during the RXTE mission (≈16 yr) of 4U 0614+091 (Bradt et al. 1993; Jahoda et al. 1996). The observations where type I X-ray bursts were detected (2 light curves which contain tails of the X-ray bursts at MJD=51789 and 51944; Kuulkers et al. 2009) are excluded and the ftools package is used to process the rest of the RXTE data.1 The data are screened with standard criteria and the light curves are extracted using the saextrct tool in the channel range 2–14 (roughly 2–5 keV2) with time bins of 16 s. In this way our analysis is more sensitive to mechanisms causing the modulation of the soft X-rays. The background light curve is created by the runpcabackest tool using the background model for bright sources and subtracted from the source light curve using the lcmath tool. We do not apply any correction for the deadtime. The average flux for each observation is depicted in Fig. 2. In total there are 488 RXTE PCA obs IDs and the length of the individual observations is less than 55 min. The majority of the observations have a length in the range 40–60 min which is similar to the orbital period proposed so far for 4U 0614+091. Hence if the orbital period of 4U 0614+091 is indeed ≈50 min we may expect prominent aliases in the periodogram which can make the detection of the true signal more difficult.
The light curves are analysed using the Period Time-Series Analysis Package available in starlink namaka package.
3 ANALYSIS AND RESULTS
3.1 Optical emission
3.1.1 The structure and variability of the emission features
In order to investigate if there are any changes in the mean wavelength of the emission feature caused by e.g. changes in the ionization state between the observations, we cross-correlate the average spectrum from every observing night covering the emission feature at ∼4650 Å with the average from all observing nights using xcor in molly. For the data analysis of the emission features at ∼4650 Å and ∼4690 Å we use the errors based on the variance of the data in the wavelength range 4500–4600 Å. The cross-correlation reveals that the emission feature is stationary between the observing nights within the 1σ error bar calculated by the xcor function. The width of the feature also does not change significantly between the observing nights.
We measure the equivalent widths of the emission features between 4624–4680 Å and 4680–4720 Å together with 4900–4960 Å. We note a significant decrease in the equivalent widths of the emission features between the first and second observing nights which seems to correlate with the increase in the seeing value (see Tables 1 and 2). Since the seeing conditions were variable over the observing nights and the S/N of the spectra and emission features low it is difficult to say whether the variations in the equivalent widths of the emission features are caused by the intrinsic variations of the source emission.
Log of the X-Shooter observations. The time column indicates the start time of the first and the last observation obtained during each night. The third column shows the number of exposures in each arm. The average and ranges of the seeing values as well as the airmass during the time when the observations were taken are indicated. The seeing was measured from the spectra in the wavelength range 4500–4520 Å. The range of S/N in the single spectra is calculated at ≈4500 Å (UVB), ≈6500 Å (VIS). In the case of the NIR arm we provide the S/N of an average spectrum for each observing night, measured around 12500 Å.
| Date | ut time | No. of exp.a | Seeing (arcsec) aver., range | S/N UVB | S/N VIS | S/N (aver.) NIR | Airmass |
|---|---|---|---|---|---|---|---|
| 2010/02/16 | 01:33:32–02:20:01 | 15 | 0.81, 0.73–0.96 | 3.8–4.3 | 5.2–6.3 | 1.2 | 1.21–1.26 |
| 2010/02/18 | 00:38:18–02:30:10 | 30 | 0.92, 0.66–1.12 | 5.4–7.1 | 6.9–9.8 | 0.8 | 1.21–1.29 |
| 2010/02/20 | 00:36:55–01:30:42 | 15 | 0.93, 0.79–1.04 | 4.0–7.2 | 5.4–9.4 | 1.3 | 1.21–1.21 |
| 2010/02/21 | 00:29:50–01:23:37 | 15 | 1.03, 0.91–1.21 | 5.8–6.6 | 7.4–8.7 | 1.3 | 1.21–1.21 |
| 2010/02/22 | 00:30:39–01:24:26 | 15 | 0.94, 0.85–1.05 | 6.0–6.9 | 7.7–8.9 | 1.5 | 1.20–1.22 |
a In the case of the NIR arm three exposures were taken and averaged during the time of one UVB and VIS exposure.
The measured equivalent widths for the emission features: C iii and O ii transitions at 4624–4680 Å and O ii transitions at 4680–4720 Å and 4900–4960 Å.
| Date | EW (C iii, O ii) | EW (O ii) |
|---|---|---|
| (4624–4680 Å) | (4680–4720 Å, | |
| 4900–4960 Å) | ||
| 2010/02/16 | 6.7 ± 0.1 | 4.0 ± 0.2 |
| 2010/02/18 | 3.25 ± 0.06 | 1.83 ± 0.09 |
| 2010/02/20 | 4.67 ± 0.09 | 2.4 ± 0.1 |
| 2010/02/21 | 5.59 ± 0.1 | 2.8 ± 0.1 |
| 2010/02/22 | 4.6 ± 0.1 | 2.5 ± 0.1 |
In order to estimate the width and centroid of the emission features at ≈4650 Å and ≈4690 Å we first fit two Gaussian lines to the average spectrum from all observing nights which give a poor fit with reduced chi-squared value of χ2/ν = 1476/360. Additional visual inspection of the features lead us to fit four Gaussian lines (see Fig. 4, lower panel). The reduced chi-squared value of the fit using four Gaussian lines is χ2/ν = 761/360. The centroids and widths of the three distinct components forming the feature at ≈4650 Å are: λcen1 = 4640.7 ± 0.1 Å, FWHM = 9.3 ± 0.3 Å; λcen2 = 4649 ± 2.0 Å, FWHM = 5 ± 4 Å; λcen3 = 4659 ± 2 Å, FWHM = 20 ± 4 Å. The centroid and width of the O ii emission lines at 4680–4720 Å are λcen = 4694 ± 2 Å and FWHM = 30 ± 5 Å.
3.1.2 X-ray flux during the optical observation
We check the RXTE ASM and MAXI flux during the optical observation of the source (see Fig. 3). The flux is measured in the energy range 1.5–12 keV by ASM and we average 10 observations. In the case of the MAXI instrument we use the one-day averaged flux in the energy range 2–20 keV. The red line indicates the approximate threshold between the low/hard and high/soft state based on the flux of the source (see Section 3.4 for details) calculated for the energy range 2–20 keV (assuming power-law slope of Γ = 2 and interstellar absorption of NH = 3 × 1021 cm−2). The average X-ray flux level is around 10−9 erg cm−2 s−1 (2–20 keV energy range) and indicates that 4U 0614+091 was in the low/hard state during the optical observations.
3.2 Trailed spectra
Nelemans et al. (2006) noticed possible variability in the weak absorption line around 4960 Å (possibly C i at 4959 Å) with a period of 48.547 min. Therefore we extract all UVB spectra separately and plot all the spectra in the form of a trailed spectrogram. We use the wavelength sampling of 0.3 Å and median smoothing with a window of four bins. The normalization of the spectra is done by fitting a third-order spline to the continuum of each spectrum with the most prominent carbon and oxygen emission lines masked. Each spectrum is then divided by the function resulting from the fit.
The expected radial velocity semi-amplitude of the primary is K1 = 5 × sin i km s−1 and that of the secondary is K2 = 727 × sin i km s−1 (assuming a 1.4 M⊙ mass neutron star, 0.01 M⊙ mass donor star and orbital period of 50 min). The maximum velocity broadening due to the integration time of a single exposure is 2πK2 × Texp/Porb ≈ 270 km s−1. Here, i is the inclination of the orbital plane with the plane of the sky.
We examine the region around 4959 Å carefully and phase all of the spectra with periods in the range 48-49 min and step of 0.001 min. We find, however, no significant modulation such as that reported by Nelemans et al. (2006).
A useful method to find the orbital period in time-resolved spectra is to look for the periodic changes in the flux ratio of the blue and red wing of the emission lines (Nather et al. 1981). It has been successfully applied to AM CVn sources (e.g. Roelofs et al. 2005). In our case most emission features are not single transitions of e.g. helium as is the case in AM CVns but blends of oxygen and carbon transitions (see Fig. 4, lower panel). Therefore the periodic signals detected using this method could be caused by the Doppler shifts of the emission lines as well as the variable flux ratios between the carbon and oxygen emission lines forming the feature.
We apply this method to the most prominent feature at ≈4650 Å. We measure the ratio R between the blue and red wing of the feature R = Flux(4635–4650 Å)/Flux(4650–4665 Å) for every observation and calculate the Lomb–Scargle periodogram. The periodogram shows a maximum power at P = 30.23 ± 0.03 min (see Fig. 5, left-hand panel). We note that choosing a different binning of the data (e.g. 0.4 Å) and a different window width for the median smoothing (e.g. three bins) causes the highest peak in the periodogram to shift to the position of the closest alias (e.g. P = 29.61 ± 0.03 min). Hence it is likely that the true error on the detected period is larger than the quoted value.
The significance of the period is calculated using a Monte Carlo method with the number of permutations set to 1000. A Fisher randomization (Linnell Nemec & Nemec 1985) is used to determine the significance of the peak and two significance estimates are given in the output. The first is P1 and represents the probability that, given the frequency search parameters, no periodic component is present in the data with this period. The second significance P2 represents the probability that the period is not equal to the quoted value but is equal to some other value. In our calculation P1 ≈ 0.0 (P1 lies between 0.00 and 0.01 with 95 per cent confidence level) and P2 = 0.027 ± 0.005, which indicates that this period may well not be the true period.
Next, we create a trailed spectrogram with spectra folded on an orbital period of 30.23 min. For this calculation the spectral wavelength scale is converted into a velocity scale with Δυ = 19.35 km s−1 pixel−1 at 4650 Å using the vbin function in molly. The heliocentric correction is additionally applied to all of the analysed spectra. The trailed spectrogram reveals a very weak periodic pattern (see Fig. 5, right-hand panel) on the left, middle and right sides of the emission feature. The pattern on the blue side seems to be in antiphase with respect to the pattern in the middle and on the red side. Looking at the LTE model fitted to the emission feature (see Fig. 4, Nelemans et al. 2004) the structure on the left side consists of the O ii lines whereas the structure in the middle and right sides is dominated by the C iii lines.
Additionally, we create trailed spectrograms between 28 and 32 min with the step of 0.001 min. Since there are 10.000 frames to examine we create a movie ordering the frames with increasing orbital period. We notice a repeatable pattern separated by 1 cycle d−1 which corresponds to the aliases seen in the Lomb–Scargle periodogram. Owing to the weakness of the signal it is difficult to attribute the periodic signal found to the orbital period of the source.
We investigate also the range of periods between 45 and 55 min by creating a number of trailed spectrograms with the step of 0.001 min. None of the frames, however, shows evidence for a periodic signal that could correspond to the orbital periods suggested so far for 4U 0614+091 (e.g. Shahbaz et al. 2008).
3.3 Comparison between X-Shooter and GMOS data of 4U 0614+091
We reanalyze time-resolved spectra of 4U 0614+091 obtained by the GMOS-North (see Nelemans et al. 2006). In total there are 52 spectra taken between 2003/10/30 and 2003/11/22. The spectra are normalized and the wavelength scale is converted into velocity scale with Δυ = 60.43 km s−1 pixel−1 at 4650 Å. We calculate the Lomb–Scargle periodogram from the flux ratio of the blue and red wing of the emission feature at ≈4650 Å in the same way as for the X-Shooter data. The periodogram shows maximum power at P = 30.468 ± 0.006 min (see Fig. 5, left-hand panel) with probabilities P1 ≈ 0 and P2 = 0.69 ± 0.01. The detected period is close to the one detected in X-Shooter data but not the same. We calculate the P2 probabilities for the three highest peaks in the X-shooter and GMOS periodograms (see Fig. 5, left-hand panel). The P2 probability has a lower value for the alias on the left-hand side of the highest peak in the X-shooter periodogram which indicates that the value of the period is more uncertain than indicated by the error on the highest peak. A high value of the P2 probability for all three peaks in the GMOS periodogram indicates that the detected period is uncertain as well.
Additionally, we create a trailed spectrogram by folding GMOS spectra with the detected period (see Fig. 5, left-hand panel). The pattern in the trailed spectrogram seems to be similar to the one found in X-Shooter data.
3.4 RXTE light curves: modulation of the X-ray emission
First, we consider all available RXTE data. In order to normalize the light curves we divide each by its average flux. Since the light curves are not evenly spaced in time, we use the Lomb–Scargle method to search for periodic signals. We calculate a single Lomb–Scargle periodogram taking the 16-yr-long data set. The periodogram is calculated in the frequency range |$10^{-4}\, \text{to}\, 3\times 10^{-3}$| Hz (6–167 min). We choose a frequency resolution of Δf = 10−9 Hz based on the overall (16 yr) time interval of the data.
The Lomb–Scargle periodogram reveals no clear periodic signal in the considered frequency range. The highest peak occurs at ≈84.9 min, which does not correspond to any orbital period proposed so far. Folding the data with this period gives a periodic signal with an amplitude of around 0.5 per cent. We note that this periodic signal is close to the orbital period of the RXTE satellite (Wen et al. 2006). Since the X-ray modulation found in the UCXB 4U 0513−40 was detected in the high/soft state of the source, we divide the light curves into a high flux group with PCA 2–5 keV count rate >70 counts s−1 which indicates a high/soft state and low flux group with PCA count rate <70 counts s−1 which indicates a low/hard state. This rough division between the island (low/hard state) and banana state (high/soft state) is done based on the results obtained by van Straaten et al. (2000) concerning the correlation between the spectral shape and the timing features (indicating the state of the source) and source flux. The data set analysed by van Straaten et al. (2000) covers observations performed during the years 1996–1998. In Fig. 2 we mark in blue those observations that are in the island state based on the spectral behaviour and in orange those that are in the banana state. We calculate the Lomb–Scargle periodogram for the low and high flux data sets. There is again no clear evidence of a periodic signal in the light curves covering separately high/soft and low/hard state neither around ≈50 min nor around 20–30 min. The highest peak in the periodogram occurs at ≈81.5 min in the low/hard state and ≈78 min in high/soft state. Folding the data with this period gives a periodic signal with an amplitude of around 0.5 and 1.3 per cent for the low/hard and high/soft state, respectively.
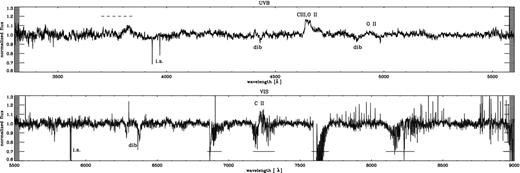
The average-normalized X-Shooter spectrum of 4U 0614+091. Interstellar features, diffuse interstellar bands and telluric absorption lines are marked with ‘i.s.’, ‘dib’ and a horizontal line, respectively. Top panel: the average UVB arm spectrum. Note the emission feature at ≈4650 Å which most probably is a blend of carbon and oxygen lines. The features around 3800 Å, marked with a dashed line are artefacts and they occur due to the imperfect merging of the master flats. Bottom panel: the average VIS arm spectrum. The residuals from the sky subtraction become more prominent above 7000 Å.
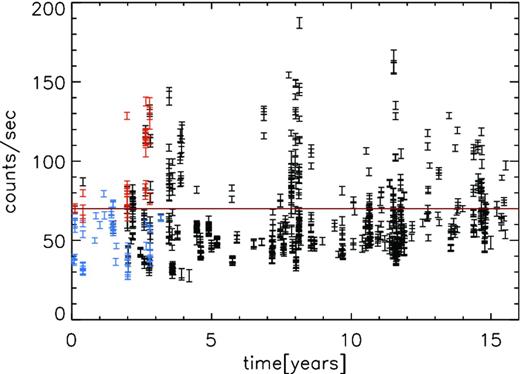
Fluxes averaged over one observing ID of all RXTE PCA, PCU 2 observations in the X-ray energy range 2–5 keV. The blue and orange measurements are taken from van Straaten et al. (2000) and represent a sample of light curves in the island state up to lower banana state (blue) and lower banana up to higher banana state (orange). The red solid line at 70 counts s−1 distinguishes roughly between the high/soft and low/hard state.
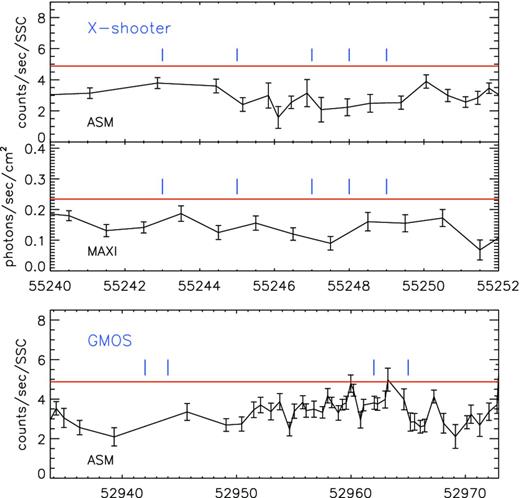
Top panel: RXTE ASM and MAXI flux of 4U 0614+091 close in time to the X-Shooter observations. The red line shows the approximate threshold between the low/hard and high/soft state determined from the PCA fluxes (see Section 3.4). The blue vertical lines indicate positions of the X-Shooter observations. A flux of 1 Crab = 2.4 × 10⁻⁸ erg s−1 cm−2 corresponds to ≈75 counts s−1 SSC−1 for the ASM and 3.6 ph s−1 cm−2 for the MAXI instrument. Bottom panel: RXTEASM flux of 4U 0614+091 close to the optical GMOS observations (blue vertical lines).
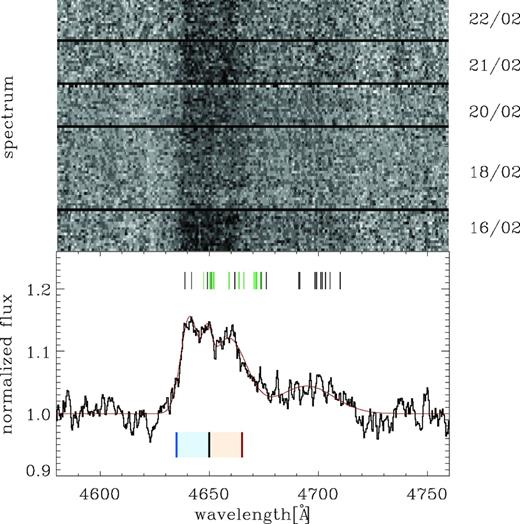
Upper panel: trailed spectrogram of all of the UVB observations showing the same blend of C iii and O ii as in the lower panel around 4650 Å. Black stripes separate the data from each night. The width of the emission feature is FWHM ≈ 30 Å ≈1910 km s−1 and is consistent with being constant during the observations. Lower panel: the average UVB spectrum around ≈4650 Å showing the emission feature which includes C iii and O ii transitions, most likely broadened by the motion in the accretion disc. The constant and four Gaussian lines fitted to the feature are overplotted (red line). The black and green vertical lines indicate O ii and C iii transitions, respectively, identified by Nelemans et al. (2004) in their best-fitting LTE model. The light blue, light red areas below the spectrum indicate the flux range of the blue and red wing of the feature we use in the method to search for periodic signals, respectively.
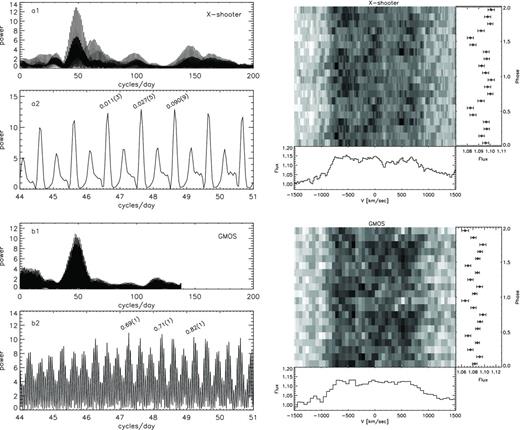
Left-hand panel: Lomb–Scargle periodograms using X-Shooter (a1 and a2 panels) and GMOS (b1 and b2 panels) data calculated from the flux ratio of the blue and red wings of the emission feature at 4650 Å measured in each individual spectrum. Note the peak at ≈50 cycles d−1 ≈30 min in the X-Shooter (a1 and a2 panels) as well as GMOS data (b1 and b2 panels). The X-shooter periodogram is overplotted over the GMOS zoomed-in periodogram (orange curve, b2 panel). The P2 probabilities for the highest peaks in the periodograms and two aliases. Right-hand panel: the trailed spectrogram constructed by folding the data on the period found in the Lomb–Scargle periodograms: P = 30.23 ± 0.03 min for X-Shooter data (upper panel), and P = 30.468 ± 0.006 min for GMOS. The spectrogram it plotted in velocity scale with one bin corresponding to 19.35 km s−1 pixel−1 at 4650 Å for X-Shooter and 60.43 km s−1 pixel−1 at 4650 Å for GMOS. Two periods are shown in the spectrograms. Note a weak periodic signal in the left, middle and right sides of the feature. The average spectrum and average flux at ≈4650 Å are shown in the panel below and on the right side of the trailed spectrograms, respectively.
4 DISCUSSION
We have analysed X-Shooter data and reanalyzed GMOS data of 4U 0614+091 and find no clear signature of the orbital period around 50 min suggested by Shahbaz et al. (2008) and Nelemans et al. (2006). We notice a weak periodic signature in the X-Shooter and GMOS data around 30 min, which could well be due to the orbital period. On the basis of the strong aliases present around the most probable peaks in the X-shooter and GMOS periodograms we cannot exclude that the two periods are consistent with being the same. It is possible that the modulation is caused by the Doppler shifts of the C iii and O ii lines as well as the variable flux ratio of the C iii with respect to the O ii lines forming the feature. Perhaps we are observing two regions characterized by different ionization states (e.g. disc and a stream impact region). In order to confirm this interpretation, however, spectroscopic data with a resolution higher than X-shooter in combination with higher effective area would be necessary in order to resolve the narrow components and obtain sufficient S/N.
Although there have been claims of the orbital period ≈50 min using optical data (Shahbaz et al. 2008; Zhang et al. 2012) the authors also found indication for other periodic signals. Shahbaz et al. (2008) report two periodicities at 64.1 min and 42 min in the NOT and SPM light curves, respectively. Zhang et al. (2012) find a possibly quasi-periodic signal also at 16.2 ± 0.1 min using data obtained by the Otto Struve Telescope. Therefore further confirmation of the signal at ≈30 min is warranted given the large number of reported periods and quasi-periodicities for this source.
The lack of helium lines in optical spectra suggests that the donor star in the source is either a CO WD or He star which is very late in its evolution, on the (semi-)degenerate branch of the evolutionary track (Yungelson 2008). However, considering the bolometric flux of 4U 0614+091 estimated from the RXTE ASM data the source appears too bright to have a degenerate donor (van Haaften, Voss & Nelemans 2012b). The flux would match the theoretical predictions only if the orbital period of this source was around 25 min (van Haaften et al. 2012b), which is more in line with the value detected in the X-shooter and GMOS data than the claimed 50 min period.
4.1 X-ray reprocessing: 4U 0614+091 compared to LMXBs and AM CVns
Since we find no clear evidence for Doppler shifts in the velocities of emission lines produced on the X-ray heated hemisphere of the donor star we consider the possibility that the optical emission, including the emission lines, is dominated by reprocessing of X-rays and the contribution from the donor star to the total as well as the reprocessed emission is negligible.
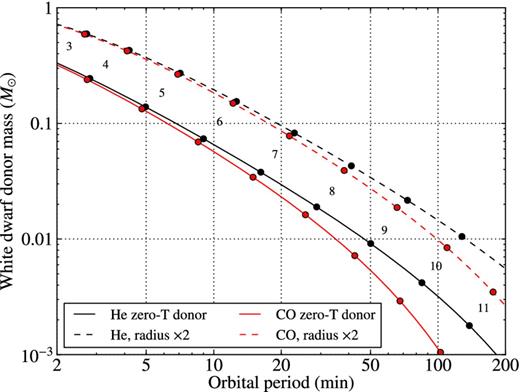
The theoretical donor star mass as a function of the orbital period for He (black) and CO WD (red). The solid curve represents a zero-temperature track which neglects the thermal pressure in the WD, whereas the dashed curve illustrates an upper limit on the donor mass in the case a very high thermal pressure is introduced. The dots indicate the logarithm of the age calculated since the onset of mass transfer to the neutron star.
Fig. 7 shows the resulting surface area of the WD secondary divided by the total surface area (donor star and the disc) as a function of the inclination (the mass ratio in 4U 0614+091 is assumed to be q = 0.01). If the inclination of 4U 0614+091 is less than around 60° then the surface area of the donor with respect to the total surface area is significantly smaller for this source than for other, hydrogen-rich, LMXBs which show emission lines formed in the irradiated part of the donor star (see Table 3). Hence, the visible area of the donor and the disc in an UCXB with a low-mass donor star and low inclination (less than around 60°) argue in favour of disc-dominated optical emission.
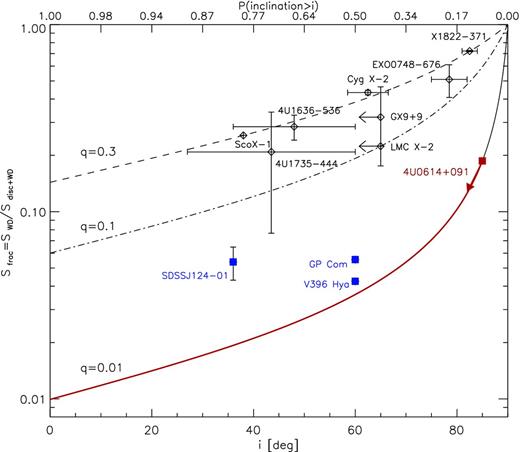
The surface area of the donor star divided by the total surface area (donor star+accretion disc) as a function of binary inclination (see equation 1); overplotted are the best estimate values for a number of LMXBs. Note that 4U 0614+091 could have a significantly lower donor star surface area compared to the total surface area than hydrogen-rich LMXBs for which the reprocessing of X-ray light in the donor star has been observed (red line). We plot (in blue) the positions of those AM CVns that have a mass ratio close to 4U 0614+091 and spectroscopic measurement of the orbital period. In the case we do not have the measurement of the inclination the source is plotted at 60°. The top axis represents the probability that the inclination of the system is higher than given for a homogeneous distribution in cos i.
The majority of the UCXBs found so far have orbital periods around 40–60 min (in't Zand, Jonker & Markwardt 2007), similar to that suggested for 4U 0614+091. The inclination of many is not well constrained. For most of them an upper limit is only given based on the lack of dips or eclipses in the light curve. However, since UCXBs likely have a lower mass ratio than hydrogen-rich LMXBs the inclination can reach values even higher than 80° without the occurrence of an eclipse (Paczynski 1974; Horne 1985). On the other hand the probability of having systems with a very high inclination is quite low (see Fig. 7, top axis).
Therefore, considering the difference between the visible fraction of the donor star and the disc surface in these UCXBs with respect to the LMXBs we may suspect the optical emission of UCXBs similar to 4U 0614+091 to be dominated by the disc emission.
A list of LMXB and AM CVn sources for which the mass ratio was measured from spectroscopy. The inclination (if constrained) and the reference for each source are also provided. In the case of AM CVn we list only the sources with mass ratio close to that of 4U 0614+091.
| Name | Mass ratio | Inc. (°) | Reference |
|---|---|---|---|
| LMXB | |||
| Sco X-1 | 0.3 | 38 | Steeghs & Casares (2002) |
| X 1822−371 | 0.296–0.315 | 82.5 ± 1.5 | Casares et al. (2003) |
| 4U 1636−536 | 0.21–0.34 | 36–60 | Casares et al. (2006) |
| 4U 1735−444 | 0.05–0.41 | 27–60 | Casares et al. (2006) |
| EXO 0748−676 | 0.11–0.28 | 75–82 | Muñoz-Darias et al. (2009) |
| Cyg X-2 | 0.34±0.02 | 62.5±4.0 | Casares et al. (2010) |
| LMC X-2 | <0.1 | <65 | Cornelisse et al. (2007a) |
| GX 9+9 | 0.07–0.35 | <65 | Cornelisse et al. (2007b) |
| AM CVn | |||
| GP Com | 0.018 | – | Marsh (1999) |
| SDSS J1240−01 | 0.039 | 36,53 | Roelofs et al. (2005) |
| V396 Hya | 0.0125 | – | Ruiz et al. (2001) |
As noticed earlier, the above calculation does not take into account the possible ‘shadowing effect’ of the disc on the donor star. Hence, we estimate the height of the outer part of the disc and compare it with the theoretical estimates of the donor star radius. For a typical LMXB a half-opening angle of the disc is Θ ≈ 12° (de Jong, van Paradijs & Augusteijn 1996). The carbon–oxygen disc could, however, be thinner by a factor of ≈2 than a disc with solar composition in a typical LMXB (see Dunkel, Chluba & Sunyaev 2006, whose prediction is based on the α-disc theory). The height of the outer part of the disc for a disc radius of 0.45 R⊙ is therefore in the range 0.045–0.09 R⊙. The radius of the donor star assuming the zero-temperature track is ≈0.04 R⊙ which is still smaller than the lower limit on the height of the outer part of the disc. In the case in which the radius is twice the radius expected for the zero-temperature track (very high thermal pressure) it is possible that the donor is being illuminated. Such a case is, however, unlikely given the typical influence of the thermal pressure on the radius of the WD (Deloye & Bildsten 2003).
Apart from the geometry of the accretion disc we consider also its optical thickness. The donor star could still be illuminated by the X-rays that are passing through the accretion disc. Dunkel et al. (2006) have shown, however, that in the case of accretion disc dominated by ions of heavier elements such as helium, carbon or oxygen the electron and ion density as well as optical thickness of the disc increase (by a factor of few) with respect to the optical thickness of the disc in a typical hydrogen-rich LMXB.
Based on the theoretical predictions presented above it seems likely that the donor star is shielded from the radiation of the central source. If that is the case then any modulation of the optical light is unlikely to be caused by the reprocessing of the X-ray light in the donor star as is the case for typical hydrogen-rich LMXBs.
Fig. 7 indicates as well the position of a few AM CVn source for which the orbital periods were measured and the mass ratios are close to the predicted value in 4U 0614+091. Unlike in AM CVns, the accretion discs in LMXBs are strongly X-ray irradiated and the amount of reprocessing usually determines the temperature and elements visible in the optical spectra. Although the surface area of the donor star comparing to the accretion disc is similar in AM CVn source and UCXBs we may expect that the conditions in which the lines are formed in 4U 0614+091 are substantially different from those seen in AM CVn sources.
4.2 X-ray modulation
The origin of the X-ray modulation in the high/soft state that was observed, for instance, in the UCXB 4U 0513−40 (Fiocchi et al. 2011) or UCXB 4U 1820−30 (Stella et al. 1987) has not yet been established. In the case of the 4U 0513−40 a periodic modulation is visible when the source is in the high/soft state (Fiocchi et al. 2011). In 4U 1820−30 a periodic modulation with an amplitude of ≈10 per cent was found when the source was in the high/soft state. The modulation was also observed when the source was in the low/hard state; however, the significance of the detection is reduced due to the factor of 3 lower count rate and the factor of 2 lower modulation amplitude (Stella et al. 1987). According to the model of reprocessing presented by Arons & King (1993) which describes the observations of UCXB 4U 1820−30 the X-ray light is reprocessed into the optical and ultra-violet light mostly in the outer regions of the optically thick, geometrically thin accretion disc. Additional 5–10 per cent of the light comes from reprocessing by the degenerate donor and is causing a prominent modulation with orbital period of the optical and ultra-violet light in 4U 1820-30. However, the X-ray light reflected off the surface of the donor star causes a modulation with an amplitude of only a few tenths of a per cent of the total X-ray flux, hence it is insufficient to explain the large observed amplitude of the X-ray modulation in 4U 1820−30.
We propose that the modulation found in 4U 1820−30 and 4U 0513−40 may indicate the presence of an outflow launched during the high/soft state. The winds in several LMXBs are azimuthally symmetric and have an equatorial geometry (see Ponti et al. 2012). However, in the case of an UCXB the outer radius to launch a thermal wind is comparable to the outer disc radius (≈109 cm; Miller et al. 2006). Therefore, when the point of impact of the gas stream from the companion occurs in the region where the wind is generated, the azimuthal symmetry is violated and more wind comes off this impact region rather than off other regions in the disc. Hence the foreground absorption will depend on the orbital phase. Additionally, since the wind in a UCXB is hydrogen deficient and helium or carbon and oxygen rich, the amount of absorption may be higher due to the strong dependence of the photoelectric absorption cross-section upon the atomic number.
A possible outflow present in 4U 1820−30 in the high/soft state has been reported by Costantini et al. (2012). The authors found highly blueshifted absorption lines of mildly ionized oxygen. The observed lines could originate in the stream impact region which could be less ionized than the accretion disc (e.g. van Peet et al. 2009).
In order to study a dependence of the neutral and ionized absorption on the orbital period using current grating instruments a long exposure time (≈days) is required. Taking into account the fact that the observed variability of the UCXBs occurs on a time-scale of days this study will be more feasible using future higher-effective area instruments like micro-calorimeter on Astro-H satellite.
Lack of a convincing periodic signal in the X-ray light curve with amplitude of few per cent in the high/soft state of 4U 0614+091 indicates that the mechanism causing the modulation of X-rays in 4U 0513−40 is not present in 4U 0614+091. On the other hand the RXTE/PCA energy range, which does not cover the soft part of the spectrum (<2 keV), could be the reason why the modulation related to photoelectric absorption (most prominent in the soft part of the spectrum) is not detected. Alternatively, a lower inclination of 4U 0614+091 with respect to the UCXBs showing the X-ray modulation could also explain the lack of the periodic signal with such a high amplitude. Ponti et al. (2012) demonstrate that the winds observed in a sample of black hole X-ray binaries in high/soft state have opening angles of few tens of degrees since they are only observed in dipping sources in which the disc is inclined at a large angle to the line of sight (i|$\gtrapprox $| 60°). A high-resolution LETGS spectrum of 4U 0614+091 taken during the high/soft state does not show signatures (narrow absorption/emission lines) of an outflow (Paerels et al. 2001). Therefore, assuming that the UCXBs share the outflow properties with the sample of black hole X-ray binaries analysed by Ponti et al. (2012) the inclination of 4U 0614+091 could in fact be lower than the threshold determined by the lack of eclipses in the X-ray light curve (see Section 4.1).
The limit on the amplitude of any X-ray modulation in the RXTE data of 4U 0614+091 is such that reflection of X-ray light off the surface of the donor star could still be below the detection threshold. If we assume that the star atmosphere reflects a fraction ≈0.5 of the incident X-rays (Anderson 1981; London, McCray & Auer 1981) then the amplitude of the X-ray modulation is expected to be lower than 1 per cent (Arons & King 1993) for the case of an UCXB. However, the theoretical prediction seems to indicate that the disc is likely blocking the X-rays from illuminating the donor star.
5 CONCLUSIONS
We have analysed time-resolved X-shooter and GMOS spectra of 4U 0614+091. We find a weak periodic signal at ≈30 min in the red-wing/blue-wing flux ratio of the most prominent emission feature at ≈4650 Å. The modulation could be caused by the Doppler shifts of the C iii and O ii lines as well as variable flux ratio of the C iii with respect to the O ii lines forming the feature. Comparing the surface area of the donor and the disc of 4U 0614+091 with the surface area of the donor star and the disc in typical hydrogen-rich LMXBs and AM CVn sources, we conclude that the emission likely originates in the accretion disc. It is possible that this periodic signal represents the orbital period of the source; however, due to a large number of periods reported for this source a further confirmation is needed.
Additionally we find no evident periodic signal which could be attributed to the orbital period of 4U 0614+091 in the RXTE PCA light curves covering the energy range 2–5 keV.
We thank the referee for the useful comments. OKM and PGJ would like to thank: Rob Hynes, Manuel Torres, Frank Verbunt for useful discussions, Lucas Ellerbroek, Andrea Modigliani and Wolfram Freudling for the help with X-Shooter data reduction, Tom Marsh for the use of molly and LTE emission line models, Keith Horne for the use of the eclipse mapping code. PGJ acknowledges support from a VIDI grant from the Netherlands Organization for Scientific Research. We acknowledge the RXTE/ASM and MAXI teams for the X-ray monitoring data.
Based on X-Shooter observations obtained under the guaranteed time observations time proposal ESO 084.D-0814(B).
The gain of the PCA instrument used to drift slowly with time, which slightly changed the energy to channel assignment.
