


Abstract
It is widely believed that globular clusters evolve over many two-body relaxation times towards a state of energy equipartition, so that velocity dispersion scales with stellar mass as σ ∝ m−η with η = 0.5. We show here that this is incorrect, using a suite of direct N-body simulations with a variety of realistic initial mass functions and initial conditions. No simulated system ever reaches a state close to equipartition. Near the centre, the luminous main-sequence stars reach a maximum ηmax ≈ 0.15 ± 0.03. At large times, all radial bins convergence on an asymptotic value η∞ ≈ 0.08 ± 0.02. The development of this ‘partial equipartition’ is strikingly similar across our simulations, despite the range of different initial conditions employed. Compact remnants tend to have higher η than main-sequence stars (but still η < 0.5), due to their steeper (evolved) mass function. The presence of an intermediate-mass black hole (IMBH) decreases η, consistent with our previous findings of a quenching of mass segregation under these conditions. All these results can be understood as a consequence of the Spitzer instability for two-component systems, extended by Vishniac to a continuous mass spectrum. Mass segregation (the tendency of heavier stars to sink towards the core) has often been studied observationally, but energy equipartition has not. Due to the advent of high-quality proper motion data sets from the Hubble Space Telescope, it is now possible to measure η for real clusters. Detailed data-model comparisons open up a new observational window on globular cluster dynamics and evolution. A first comparison of our simulations to observations of Omega Cen yields good agreement, supporting the view that globular clusters are not generally in energy equipartition. Modelling techniques that assume equipartition by construction (e.g. multi-mass Michie–King models) are approximate at best.
1 INTRODUCTION
Gravitational encounters within stellar systems in virial equilibrium, such as globular clusters, drive evolution over the two-body relaxation time-scale. The evolution is towards a thermal velocity distribution, in which stars of different mass have the same energy (Spitzer 1987). This thermalization also induces mass segregation. As the system evolves towards energy equipartition, high-mass stars lose energy, decrease their velocity dispersion and tend to sink towards the central regions. The opposite happens for low-mass stars, which gain kinetic energy, tend to migrate towards the outer parts of the system and preferentially escape the system in the presence of a tidal field.
As first pointed out by Spitzer (1969), not all self-gravitating systems can attain complete energy equipartition, i.e. a mass-dependent velocity dispersion scaling as σ(m) ∝ m−0.5. For example, in a simple two-component model with light and heavy stars of masses m1 and m2, respectively, equipartition is possible only if the mass fraction in heavy particles is smaller than a critical value: M2/M1 ≲ 0.16(m1/m2)3/2, where M1 and M2 are the total masses in stars of mass m1 and m2, respectively (Spitzer 1969). With too many massive particles, no equipartition is possible, and the heavy particles tend to become a self-gravitating system, producing a deep core collapse while continuing to transfer energy to the lighter stars.
Subsequent research has refined our knowledge of the conditions required to establish energy equipartition. This was studied for two-component systems using a variety of numerical methods, including pioneering work by Spitzer & Hart (1971) and Inagaki & Wiyanto (1984) with Fokker-Planck and Monte Carlo schemes, followed by more realistic simulations both with a Monte Carlo code (Watters, Joshi & Rasio 2000; Fregeau et al. 2002) and with direct N-body integration (Khalisi, Amaro-Seoane & Spurzem 2007). Vishniac (1978) generalized the analytical Spitzer instability analysis to include a continuous mass spectrum. He showed that clusters with realistic mass functions, such those of the Salpeter (1955) form, are unable to attain energy equipartition. With a complementary approach based on multi-component King distribution function modelling, Kondrat'ev & Ozernoy (1982) showed that even if a system attains equipartition in the energy phase space, the mass-dependent kinematics does not necessarily scale as σ(m) ∝ m−0.5.
Much of the theoretical interest in equipartition has focused on how energy exchange affects the process and time-scale of core collapse in globular clusters. Both analytically and numerically, it has been established that the core collapse time-scale in a two-component model is inversely proportional to the ratio of the heavy to light particle masses (e.g. Portegies-Zwart & McMillan 2000; Khalisi et al. 2007). This has the important consequence that young star clusters can undergo a runaway central collapse of massive stars within the first few million years after their formation, possibly providing a pathway to the formation of intermediate-mass black holes (IMBHs; Portgies-Zwart et al. 2004).
One of the directly observable consequences of the drive towards energy equipartition is spatial mass segregation. In simulations, the amount of mass segregation reaches a steady-state configuration within a few initial relaxation times (Gill et al. 2008). The presence of an IMBH, or of a stellar-mass black hole binary, in the core of a stellar cluster reduces the amount of mass segregation that develops (Baumgardt, Makino & Ebisuzaki 2004; Trenti et al. 2007b; Gill et al. 2008; Umbreit & Rasio 2013).
Mass segregation has been measured in several globular clusters using high-quality Hubble Space Telescope (HST) data. This only requires observations of stellar positions and luminosities (on the main sequence, luminosity correlates with mass). Such observations have confirmed the qualitative picture that massive stars are preferentially found in the core (de Marchi & Paresce 1994; Andreuzzi et al. 2000; Paust et al. 2010). However, interpretation of such data requires detailed dynamical models. These are often constructed assuming energy equipartition for all components through Michie–King models (e.g. Gunn & Griffin 1979; Meylan 1988; de Marchi, Paresce & Pulone 2000). The accuracy of this is unclear, given the theoretical results described above which indicate that globular clusters may not generally be in energy equipartition.
A preferred approach is to compare data directly to the results of numerical simulations. Detailed, data-model comparisons for globular clusters such as NGC 2298 and M10 have shown a remarkable quantitative agreement with the mass segregation predictions from N-body simulations (Pasquato et al. 2009; Beccari et al. 2010; Umbreit & Rasio 2013).1 However, such comparisons are challenging to carry out for general data sets. It not only requires detailed numerical simulations, but also the simulations must also be ‘observed’ to mimic the magnitude limits, completeness and crowding effects in the data. These observational effects generally vary with radial distance within a system, and between systems.
Mass segregation provides only an indirect measure of energy equipartition: stellar energies can only be estimated statistically from stellar positions, and this requires assumed knowledge about the dynamical state and gravitational potential of the system. It has not been possible historically to measure σ(m) in globular clusters directly from the knowledge of individual stellar velocities. Line-of-sight velocities of stars can be measured from spectra, but those are difficult to obtain for faint stars below the main-sequence turn-off. Stars in globular clusters with measured line-of-sight velocities are therefore generally giant stars. These stars all have very similar mass (because stellar evolution proceeds rapidly after the main-sequence turn-off), making it impossible to determine how the velocity dispersion σ in a cluster depends on stellar mass m.
This situation is now changing due to the advent of HST studies of stellar proper motions in globular clusters, which can quantify the kinematics of the stars as a function of their position along the main sequence (i.e. their mass). Anderson & van der Marel (2010) presented measurements for more than 100 000 stars in the central region of Omega Cen, finding σ ∝ m−0.2. Proper motion catalogues for some two dozen additional clusters are under constructions (Bellini, van der Marel & Anderson 2013). This opens up a new observational window into the dynamics of globular clusters.
To understand and exploit these new data there is a need for new analysis of models to predict in detail the mass- and spatially dependent kinematics of globular clusters as a function of initial conditions and evolutionary state. With new data and new analysis in hand, there is the potential to validate our understanding of globular cluster structure and evolution at a new level. Moreover, knowledge of the σ(m) relation may constrain structural parameters that are difficult to assess otherwise, such as the possible presence of a central IMBH.
The goal of this paper is to make the first step towards modelling mass-dependent kinematics in the era of detailed proper motions measurements. We analyse a sample of realistic direct N-body simulations of star cluster evolution, and we also use the models to interpret the specific observational results obtained for Omega Cen (after rescaling model relaxation times to the one of Omega Cen to account for the larger number of stars compared to the particles we can simulate). The structure of the paper is as follows. In Section 2 we introduce the numerical simulations that we have carried out, and we describe how we analyse simulation snapshots to construct σ(m). The results of our analysis are presented in Section 3. We compare the model predictions to Omega Cen observations in Section 4, and find excellent consistency between models and observations. We summarize our key findings and conclude with an outlook for future studies in Section 5.
2 N-BODY MODELS
2.1 Setup and methodology
We analyse the stellar dynamics in the direct N-body simulations previously carried out by Trenti, Vesperini & Pasquato (2010) to investigate the evolution of structural parameters in star clusters. For full details on the code and the simulation setup we refer to that paper (and previous investigations in the same framework by Trenti, Heggie & Hut 2007a; Gill et al. 2008; Pasquato et al. 2009). To summarize, we follow the dynamical evolution of simulated star clusters using the nbody6 code (Aarseth 2003), which guarantees an exact treatment of multiple interactions between stars by employing special regularization techniques, without resorting to the introduction of softening. The dynamics of the system are thus followed with extremely high accuracy, at the price of using a lower number of particles compared to more approximate methods (e.g. Monte Carlo codes).
We simulate systems with N = 32768 to N = 65536 particles, with an initial mass function (IMF) constructed to reproduce the long-term evolution of star clusters that are ≳10 Gyr old. As described in Trenti et al. (2010), we start from either a Salpeter (1955) or a Miller & Scalo (1979) IMF and then apply an instantaneous step of stellar evolution with the Hurley et al. (2000) evolutionary tracks to obtain a main-sequence turn-off at 0.8 M⊙. Stars in the range 0.8 M⊙ ≤ m < 8.0 M⊙ become white dwarfs (with final masses prescribed by Hurley et al. 2000), more massive stars up to 25 M⊙ become neutron stars, while above 25 M⊙ we form black holes in the 5–10 M⊙ mass range. Our standard assumption is to retain 100 per cent of the dark remnants without assigning them velocity kicks, but we explore a lower retention fraction (30 per cent) of neutron stars and stellar mass black holes in two runs. During the simulation, only gravitational interactions are considered and stars are not evolved further. This simplified approach is ideal to highlight the effects of gravitational forces on the long-term evolution of star clusters and the drive towards energy equipartition, without the added complication of disentangling dynamics from energy injection induced by stellar evolution (through loss of mass with negative energy). Stellar evolution affects star cluster structure significantly only during the first few hundred Myr (e.g. see Hurley 2007; Mackey et al. 2008), so in our analysis we are only neglecting steady, low levels of mass loss induced by stellar evolution at late times. These should not impact significantly the dynamics, and indeed comparison between models with and without stellar evolution does not show significant differences with respect to predictions for mass segregation (see fig. 2 in Gill et al. 2008). Based on that comparison, we expect that our approach provides an approximate, yet accurate description of the current evolution of globular clusters.
The initial conditions in the position and velocity space are drawn from a King distribution function (King 1966), with scaled central potential W0 = 3, 5, 7. Initially, all particles of mass m are drawn from the same velocity distribution, hence at any given radius σ(m) is constant. Our runs include a primordial binary fraction f = Nb/(Ns + Nb) ranging between 0 and 0.1, with Ns and Nb being the number of singles and binaries, respectively. All binaries are ‘hard’ in the Heggie (1975) classification (i.e. semi-axis typically smaller than ∼10 au for a typical globular cluster with central velocity dispersion of 10 km s−1). One of our N = 32768 runs contains a central IMBH, with the BH mass set at 1 per cent of the total cluster mass. Table 1 gives an overview of all the simulations performed and analysed.
Summary of N-body simulations and energy equipartition results.
| N | f | IMF | W0 | thalf/trh(0) | tmax/trh(0) | ηmax | η∞ |
|---|---|---|---|---|---|---|---|
| (1) | (2) | (3) | (4) | (5) | (6) | (7) | (8) |
| 65536 | 0.00 | MS | 3 | 1.0 | 7.2 | 0.124 ± 0.019 | 0.072 ± 0.022 |
| 65536 | 0.02 | MS | 3 | 1.5 | 4.7 | 0.124 ± 0.024 | 0.063 ± 0.026 |
| 65536 | 0.055 | MS | 3 | 1.1 | 4.9 | 0.119 ± 0.018 | 0.075 ± 0.016 |
| 65536* | 0.00 | MS | 5 | 0.9 | 3.4 | 0.144 ± 0.006 | 0.085 ± 0.006 |
| 65536 | 0.02 | MS | 5 | 1.0 | 3.9 | 0.141 ± 0.008 | 0.084 ± 0.008 |
| 65536 | 0.00 | Sal | 7 | 1.3 | 6.2 | 0.150 ± 0.004 | 0.098 ± 0.012 |
| 32768 | 0.00 | MS | 7 | 0.6 | 2.9 | 0.150 ± 0.008 | 0.094 ± 0.006 |
| 32768 | 0.00 | MS | 7 | 0.5 | 2.4 | 0.159 ± 0.007 | 0.078 ± 0.011 |
| 32768 | 0.00 | MS | 7 | 0.6 | 2.8 | 0.158 ± 0.008 | 0.086 ± 0.009 |
| 32768 | 0.01 | MS | 7 | 0.6 | 2.7 | 0.156 ± 0.007 | 0.086 ± 0.011 |
| 32768 | 0.03 | MS | 7 | 0.5 | 2.8 | 0.134 ± 0.008 | 0.088 ± 0.007 |
| 32768 | 0.05 | MS | 7 | 0.5 | 2.3 | 0.137 ± 0.009 | 0.076 ± 0.016 |
| 32768 | 0.10 | MS | 7 | 0.5 | 2.1 | 0.127 ± 0.008 | 0.069 ± 0.007 |
| 32768 | 0.00 | Sa | 7 | 0.8 | 4.9 | 0.151 ± 0.007 | 0.090 ± 0.011 |
| 32768† | 0.00 | MS | 7 | 0.5 | 2.2 | 0.180 ± 0.011 | 0.085 ± 0.012 |
| 32768† | 0.00 | Sa | 7 | 0.5 | 2.6 | 0.181 ± 0.010 | 0.101 ± 0.009 |
| 32769‡ | 0.00 | MS | 7 | 0.8 | 4.4 | 0.120 ± 0.010 | 0.097 ± 0.007 |
| 32768§ | 0.00 | MS | 3 | 1.6 | 6.3 | 0.146 ± 0.008 | 0.084 ± 0.011 |
Notes. N-body simulations of star clusters in a tidal field with self consistent King model initial conditions. Column (1): number of particles N. Column (2): binary fraction f. Column (3): IMF used (Sa: Salpeter power law; MS: Miller & Scalo). Column (4): initial concentration of the density profile (King index W0); Columns (5)–(8): equipartition results for single main-sequence stars, quantified as described in Section 3.1.2; Column (5): time thalf to reach half of the maximum equipartition; Column (6): time tmax to reach the maximum equipartition; Column (7): maximum equipartition ηmax reached, where σ(m) ∝ m−η. Column (8): late-time asymptotic equipartition η∞ of the system as a whole. Columns (5)–(7) pertain to the innermost 10 per cent of the stars as seen in projection, while column (8) pertains to the system as a whole.
*: canonical simulation discussed in Section 3.1; †: 30 per cent NS/BH retention; ‡: mIMBH = 0.01mcluster; §: rt = 6.28 (compact initial conditions where the Roche lobe is under-filled by a factor of 2).
The simulated star clusters are tidally limited and particles experience a tidal force from a point-like parent galaxy, assuming that the cluster is in circular orbit at a distance selected so that the tidal radius is self-consistently defined by the King density profile, and all models fill their tidal radius initially (except for one compact simulation listed in Table 1). Hence, models have different tidal field strengths for different W0 values (see Trenti et al. 2007a, 2010 for a full definition of the tidal field equations).
2.2 Structural evolution
We refer to Trenti et al. (2010) for a detailed discussion of the evolution of the cluster structural parameters. To summarize, after a few relaxation times, all clusters tend to evolve towards a quasi-universal core-halo structure with a central concentration (measured either as the core to half-mass radius ratio rc/rh or as core to tidal radius ratio rc/rt) which is independent of its value at the beginning of the run. The long-term equilibrium value for the concentration is defined uniquely by the efficiency of the central energy production due to dynamical processes: runs with only single particles undergo a marked core collapse and have higher concentration, while in runs with primordial binaries the core collapse is halted at lower central densities because of efficient energy input by three body encounters. The run with an IMBH has the largest core at late times. Once the long-term rc/rh ratio has been established, the system undergoes a self-similar expansion at fixed concentration, until the majority of the stars have been lost by tidal evaporation, or the mechanism of central energy production is depleted (for example because of disruption of all primordial binaries).
This classical picture for the dynamical evolution of a globular cluster is clearly present when one considers three-dimensional, mass-based definitions of the core and half-mass radius (Fregeau & Rasio 2007; Trenti et al. 2007a). The situation becomes more complicated when simulations are instead ‘observed’, namely when only two-dimensional, light-based definitions for structural parameters are constructed (Trenti et al. 2010). For example, it is then possible that clusters without primordial binaries still show a large core at late times if the core is dominated by heavier dark remnants (neutron stars and stellar mass black holes; Morscher et al. 2013).
2.3 Analysis of stellar dynamics
Our analysis here differs from that in Trenti et al. (2010) in that we now consider the stellar dynamics in the simulations. Simulation snapshots with particle positions and velocities were saved every 10 dimensionless time units, yielding several tens of snapshots per relaxation time. For each snapshot, at time t, we binned the particles to derive the velocity dispersion σ(m, r, t) as a function of mass and projected radius. Mass binning was carried out in intervals of 0.1 M⊙. Two-dimensional (projected) radial bins were defined by Lagrangian radii, each containing 10 per cent of the particles in the snapshot.
We took the following steps to minimize noise from low particle numbers. First, for a given projection of the particle positions in two dimensions, we measured the velocity dispersion along each of the three independent Cartesian coordinates, and then rescaled the results to two-dimensional projection by averaging in quadrature and rescaling to two dimensions. This procedure is equivalent to measuring three-dimensional velocity dispersions, and then rescaling the results to two dimensions with a multiplying factor |$\sqrt{2/3}$|, and has been done as a way to reduce shot noise in our results.2 Secondly, we created projections for the radial distribution of the stars along three orthogonal directions and averaged them. And thirdly, we averaged together 30 independent neighbouring time snapshots. These steps allow us to achieve an effective number of particle velocities in our analyses that for our N = 65536 runs is comparable to the number of stars in a massive globular cluster like Omega Cen.
We determined the functional dependences of σ(m, r, t) separately for single main-sequence stars, binary stars and compact remnants (white dwarfs, neutron stars and stellar mass black holes) in the simulations. For comparison to observational results, we focus in the following primarily on the results for single main-sequence stars. In reality, some stars in observational catalogues may be unresolved binaries. However, we found that our main results described below did not change significantly if binary stars in the simulations were included in the single-star analyses (i.e. treating each binary of total luminosityL as a single star of that luminosity).
3 EQUIPARTITION RESULTS
3.1 Canonical simulation
We describe first the results for a ‘canonical’ simulation: a model with N = 65536 stars, a Miller & Scalo IMF, no primordial binaries and a King concentration parameter W0 = 5 (see Table 1). This model has a moderate initial concentration and external tidal field strength. As discussed in Trenti et al. (2010), the structural evolution of this cluster is fairly proto-typical. Starting from an initial concentration c = −log10(rt/rc) ∼ 1, it undergoes core-collapse in about t ∼ 7trh(0). At this stage, its observed concentration (based on the core radius observed from the surface brightness profile) has reached a quasi-equilibrium value c ∼ 1.7. The three-dimensional concentration is instead higher (c ≳ 2.5) as the 3D core contracted to reach densities sufficient to produce a few binaries through three body encounters. At t ≳ 7trh(0), the system continues to evolve with self-similar density and surface-brightness profiles, progressively losing mass as a result of the external tidal field until complete dissolution at t ∼ 16trh(0).
3.1.1 Mass dependence of kinematics
Fig. 1 shows σ(m), determined as described in Section 2.3, for the innermost radial Lagrangian bin (10 per cent enclosed mass) at t = 5.1trh(0). This is during the initial core contraction as the system is on its way towards core collapse. Red points pertain to single stars along the main sequence, while blue points pertain to compact remnants which are generally heavier. Single stars are found up to the turn-off mass of 0.8 M⊙, while the lightest compact objects have masses of ∼0.55 M⊙.
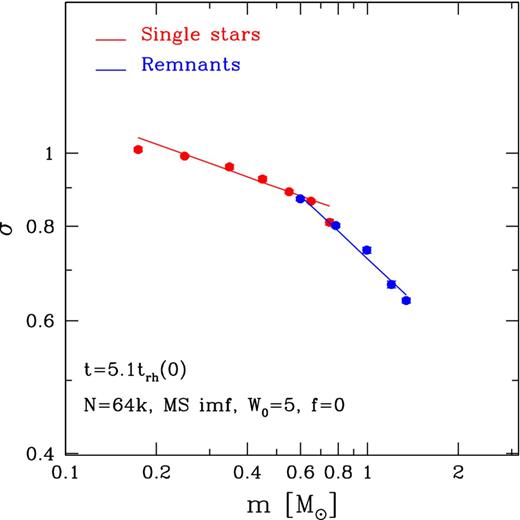
Velocity dispersion σ as a function of particle mass m around time t = 5.1trh(0) for particles at the centre of the system (two-dimensional projected radius r < 0.78rc) in our canonical N-body simulation (the N = 65536 run with W0 = 5, a Miller & Scalo (1979) IMF, and no primordial binaries). The red points with error bars are for single main-sequence stars, while the blue points are for compact remnants. Lines show the best-fitting power-law relation σ(m) ∝ m−η for each set of objects, with η = 0.14 for single main-sequence stars and η = 0.34 for compact remnants.
The main-sequence stars and the compact remnants have comparable dispersions over the mass range where both types of objects exist, 0.55 ≲ m ≲ 0.8 M⊙. However, when the full range is considered over which each object type is found, the compact remnants have a significantly steeper σ(m) relation than the main-sequence stars (approximately m−0.34 versus m−0.14, respectively). Neither type of object achieves energy equipartition, but the heavier compact objects are closer to it than the lighter main-sequence stars. This behaviour is qualitatively consistent with the stability analysis presented by Vishniac (1978), given that the remnants have a significantly steeper mass function than the main-sequence stars (see Fig. 2). This makes it easier for the population in the 0.7–2 M⊙ mass range to thermalize. The steep mass function for remnants is due to the significant mass loss experienced by massive stars before they become remnants, and is relatively insensitive to the adopted IMF. The generic shape of σ(m) in Fig. 1 is therefore typical for all our simulations.
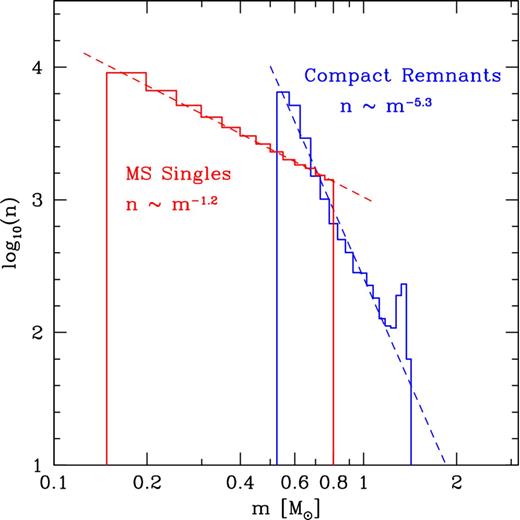
Mass function for the particles of an N-body run (including, e.g., our canonical simulation) starting from a Miller & Scalo 1979 IMF, evolved to a turn-off mass of 0.8 M⊙. The red histogram represents main-sequence stars, and the blue one compact remnants. Approximate power-law fits are shown as dashed curves, which have slopes m−1.2 and m−5.3, respectively. Since the mass function for remnants is much steeper, it is easier for them to approach energy equipartition (see Fig. 1).
The relation σ(m) in Fig. 1 shows what appears to be a break centred around m ≈ 0.7 M⊙, with some additional curvature towards lower masses. Fig. 2 shows that m ≈ 0.7 M⊙ is also the mass at which the density of main-sequence stars is equal to the density of the remnants, so this might provide some clues to the origin of the break.3 The Vishniac (1978) analysis suggests that more energy equipartition is possible for a sub-population within a given mass range, when the lighter counterparts are much more abundant. So thermalization is more likely for objects above 0.7 M⊙, as there are plenty of lower mass particles along a steep mass function (m−5.3). By contrast, the lowest mass remnants and the main-sequence stars below 0.7 M⊙ are less able to thermalize efficiently, because the mass function is only increasing mildly (m−1.2). In conclusion, this might explain the break in Fig. 1.
Fig. 1 shows that the σ(m) relations for single main-sequence stars and compact remnants separately are both reasonably well fit by a power law of the form σ(m) ∝ m−η. The compact remnants are only of theoretical interest as they are not directly observable. In the following, we therefore focus our attention only on the main-sequence stars, which can be observed. Using the σ(m, r, t) profiles constructed as described in Section 2.3, we fit for each radial Lagrangian bin r and at each time t the mass-dependent kinematics assuming a power law σ(m) ∝ m−η over the mass range 0.2 ≤ m/M⊙ ≤ 0.7. Here η is a free parameter, with η = 0 corresponding to absence of equipartition (velocity dispersion independent of mass), 0 < η < 0.5 corresponding to partial equipartition and η = 0.5 corresponding to complete equipartition. The quantity η is a well-defined fit-parameter that can be compared across models, even when the σ(m) relation shows some residual curvature, as e.g. in Fig. 1.
3.1.2 Radial and time dependence of equipartition
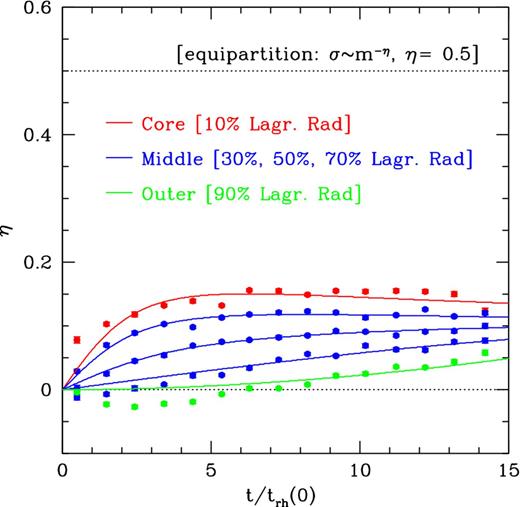
The degree of energy equipartition as a function of time, η(t), is shown for different Lagrangian radii in the canonical simulation in Fig. 3. At t = 0, the system starts (by construction) with no equipartition at all. As time progresses, there is a relatively rapid linear rise in η(t) for the inner Lagrangian radii. This is followed by a flattening towards a maximum value around η ≈ 0.15 that is reached after a few initial half-mass relaxation times. Subsequently, the value of η drops slowly.4 For the outer Lagrangian radii, the value of η(t) evolves on a longer time-scale, reflecting the longer relaxation time in the outskirts of the system. For all radii there is convergence to a value around η ≈ 0.10 at late times. However, because of the slower development of equipartition, the outer regions do not first ‘overshoot’ this value by reaching a maximum at early times, as seen for the inner Lagrangian radii.
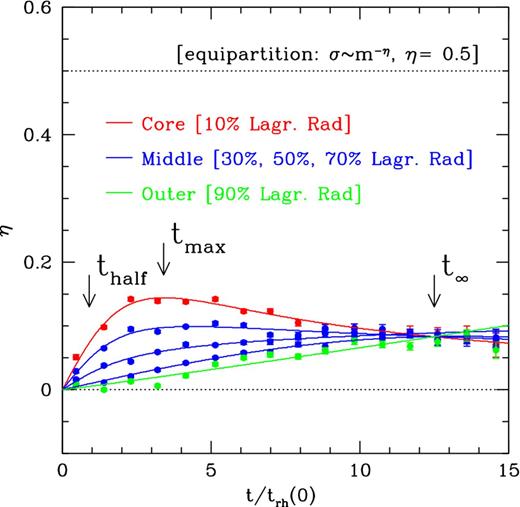
Time evolution of the energy equipartition indicator η (the power-law slope in the relation between velocity dispersion and mass, σ ∝ m−η) for single main-sequence stars in our canonical N-body simulation. Data points with error bars were determined directly from the simulation snapshots, as described in Sections 2.3 and 3.1.1. Solid curves are fits of the form given by equation (2). Red refers to the innermost 10 per cent of the main-sequence stars in projection; blue refers to three projected annuli containing 10 per cent of the particles each, and ending at 30 per cent, 50 per cent and 70 per cent of the enclosed particle number; green refers to the outer Lagrangian bin at 90 per cent of the enclosed particle number. The time along the abscissa is expressed in units of the initial half-mass relaxation time trh(0). These results for the canonical simulation are representative of the general behaviour of our N-body simulations. The inner region of the system reaches a higher degree of equipartition within a few relaxation times than the outer regions. An increase in η takes longer to develop at large radii. However, at later times, the whole system converges towards a common value of η. Arrows indicate the characteristic times defined in Section 3.1.2. Complete energy equipartition (η = 0.5) is never attained, confirming previous investigations based on stability analysis.
To compare the results of different simulations, it proved convenient to extract the following quantities, which capture the essence of the time evolution of equipartition. The quantities were determined for all simulations from the empirical fits of the form given by equation (2), rather than from the individual simulation snapshot data points, because the latter are available only at discrete times.
ηmax: the maximum η that is reached in the central region, defined here as the innermost Lagrangian radius (inner 10 per cent of the projected mass).
tmax: the time at which the central region achieves η = ηmax.
thalf: the time at which the central region achieves η = 0.5ηmax. This value is defined more robustly than tmax, since η(t) tends to flatten near its maximum.
t∞: the late time t > tmax at which the η values for all Lagrangian radii are most similar (defined as minimum dispersion in η).
η∞: the value of η at t = t∞ averaged over all Lagrangian bins. This represents approximately the long-term asymptotic value of η for the system as a whole.
We list these quantities in Table 1 for all simulations. We omit t∞ since it is not very robustly determined, lacks a clear physical meaning, and may depend on the (arbitrary) time at which the simulation is ended. Since η(t) is roughly flat at large times, η∞ by contrast is defined more robustly.
For the canonical simulation, thalf = 0.9trh(0), tmax = 3.4trh(0) and t∞ = 12.5trh(0). These times are indicated with arrows in Fig. 3. Half of the maximum equipartition develops rather quickly in the central region of the system, while the maximum value is reached only around half-way to core-collapse. The maximum equipartition is characterized by ηmax = 0.144 ± 0.006, and the long-term asymptotic value is η∞ = 0.085 ± 0.006.
The analysis discussed above was carried out using projected radii, which are the only observable quantities. The results show that the canonical simulation never attains complete energy equipartition. However, at early times the particles in the projected core are closer to complete equipartition than what is found for all particles at late times. So it is expected that stars in the three-dimensional core might achieve an even higher degree of equipartition at early times. We analysed η also for the three-dimensional core, and found that this is indeed the case. However the effect is very modest, and the three-dimensional core is only marginally closer to equipartition (by Δη ≈ 0.05 at t = tmax). Therefore, no region in the simulation is attaining complete energy equipartition, in full agreement with the analytical stability analysis of Vishniac (1978).
3.2 Dependence on model parameters
3.2.1 Sample statistics
We have found that the analysis of energy equipartition across our sample of N-body simulations shows a surprisingly uniform and consistent picture. All the runs behave to first approximation like the canonical run discussed in Section 3.1. Figs 4 and 5 show scatter-plot representations, the results for thalf, tmax, ηmax and η∞ for all of the simulations. The uncertainties in |$\eta _{\text{max}}$| and η∞ are generally small, Δη ≲ 0.01, and are smaller than the scatter between different simulations.
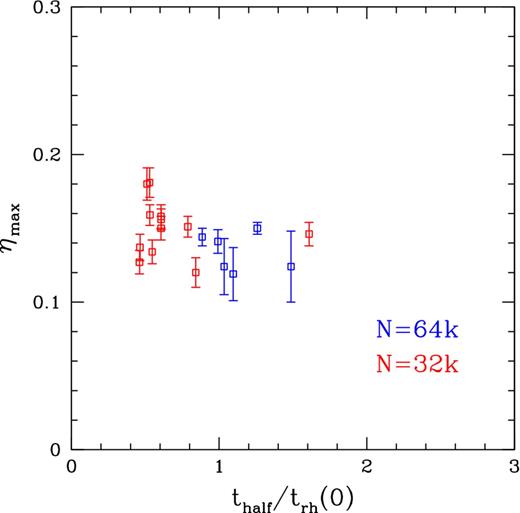
Scatter plot of equipartition results, showing ηmax versus thalf for all of the N-body simulations. The velocity dispersion of single main-sequence stars scales as σ ∝ m−η, and the quantity ηmax is the maximum power-law slope η for the innermost 10 per cent radial Lagrangian bin in projection. The quantity thalf is the time at which this radial bin reaches η = 0.5ηmax. Simulations with N = 32k particles are shown in red, and those with N = 64k particles in blue. The initial rise in η(t) is approximately linear, so all simulations have essentially achieved a near-maximum equipartition in their cores after t ≳ 3trh(0).
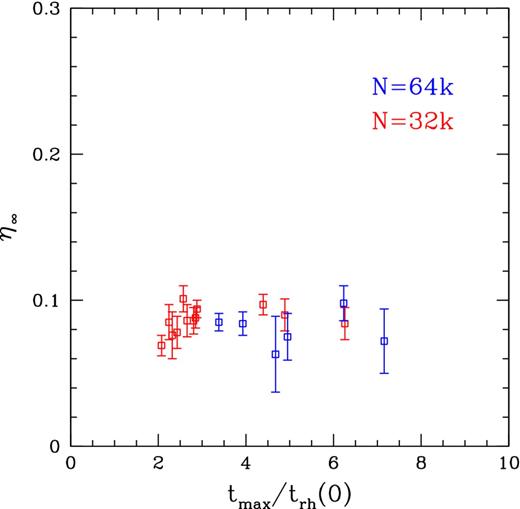
Scatter plot of equipartition results, showing η∞ versus tmax for all of the N-body simulations. The velocity dispersion of single main-sequence stars scales as σ ∝ m−η, and the quantity η∞ is the asymptotic power-law slope towards which the system as a whole converges at late times. The quantity tmax is the time at which the innermost 10 per cent radial Lagrangian bin in projection achieves its maximum value ηmax. Simulations with N = 32k particles are shown in red, and those with N = 64k particles in blue. The quantity η∞ has a near-universal value of 0.08 ± 0.02 across all simulations, and is very far from complete equipartition (η = 0.5).
The value of ηmax varies from ηmax = 0.12 achieved by the run with a central IMBH and by a run with low concentration (W0 = 3) and primordial binaries (f = 0.055) to ηmax = 0.18 for the runs with a low-retention fraction of neutron stars and stellar mass black holes. Runs with a higher fraction of primordial binaries develop less equipartition than their similar counterparts with single stars only, although the effect is overall modest [e.g. from ηmax = 0.159 to ηmax = 0.127 going from f = 0 to f = 0.1 for the series of runs with N = 32768 particles, W0 = 7 and a Miller & Scalo (1979) IMF]. Comparing runs with a Salpeter (1955) versus Miller & Scalo (1979) IMF does not show any significant difference (we are neglecting stellar evolution which could change somewhat this conclusion, but we discuss in Section 2.1 how we expect such impact to be modest at most). Table 1 also shows that lower initial concentration W0 generally yields slightly lower ηmax. As discussed in Section 3.2.2, this is most likely due to the different tidal field strength assumed in simulations with different W0, rather than due to the concentration itself.
The long-term asymptotic value η∞ is even more uniform across the sample of simulations than is ηmax. Its value ranges from η∞ = 0.063 to η∞ = 0.101. The sensitivity of η∞ to model parameters is qualitatively similar to that for ηmax, and there is a mild correlation between the two quantities across the sample. A Spearman rank correlation test gives a correlation r = 0.36, which is significant at greater than 90 per cent confidence for our sample of 18 simulations. Since some of the mechanisms that drive the suppression of the equipartition are most active in the core rather than in the whole system, such as the presence of an IMBH, it is not surprising to observe only a modest correlation.
The time-scale needed to approach maximum equipartition, as measured by either thalf or tmax, varies more between simulations. The value of thalf/trh(0) ranges from approximately 0.5 to 1.6. The initial rise in η(t) is approximately linear, so this implies that after t ≳ 3trh(0) all systems have essentially achieved a near-maximum equipartition in their cores. The actual values of tmax/trh(0) show considerable variation though, ranging from 2.1 to 7.2. This is because the η(t) profile beyond the maximum is often nearly flat for the innermost Lagrangian bin, so that tmax is not robustly determined. An example of this is provided in Fig. 6, which is similar to our canonical simulation in Section 3.1, but pertains to an initial King concentration index W0 = 7.
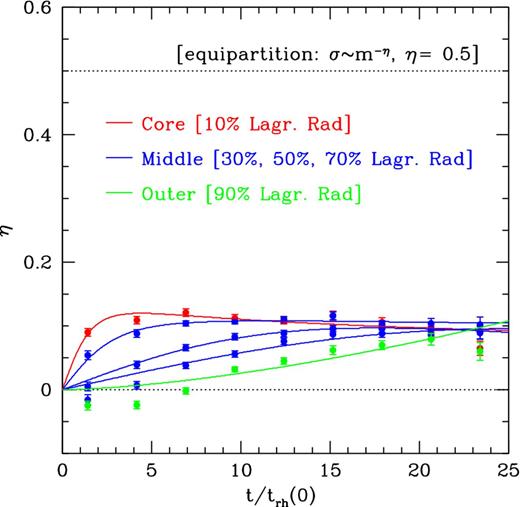
Time evolution of the energy equipartition indicator η (the power-law slope in the relation between velocity dispersion and mass, σ ∝ m−η) for single main-sequence stars in a simulation with N = 65536 particles, W0 = 7, a Salpeter (1955) IMF, and no primordial binaries. The overall evolution is similar to that for the canonical simulation (see Fig. 3, which uses the same layout and colour-coding). However, the present simulation shows ‘energy divergence’ in the outer parts at early times, with evolution towards η < 0 (i.e. high-mass stars have higher velocity dispersion than low-mass stars). This transient behaviour is possibly related to ejection of particles from the core into the outer parts of the system because of the dynamical interactions (see Section 3.3). This simulation also shows that the best-fitting function of the form given by equation (2) may underestimate a very rapid rise in η(t) at early times, yielding a value of thalf that is biased high.
Fig. 4 shows that the runs with N = 65536 particles tend to have longer thalf/trh(0) than those with N = 32768. However, this may be due to small systematic errors in the determination of thalf. Fig. 6 shows that the steep initial rise in η(t) in the inner Lagrangian bin is not always well reproduced by the fit of the functional form in equation (2). The values of ηmax, η∞ and tmax do not show any clear trends with particle number. This suggests that our simulations have sufficient N to determine real physical trends (as opposed to numerical artefacts, transients, or shot-noise dominated features), and that any dependence on N is properly accounted for by expressing time-scales in units of trh(0).
The equipartition time-scales thalf and tmax do not show obvious correlations with other parameters or with the model initial conditions. There is a hint of negative correlation between thalf and ηmax (Fig. 4), but we are hesitant to attach much significance to this, given the possibility of small systematic errors in the determination of thalf. No obvious correlation is present between tmax and η∞ (Fig. 5).
3.2.2 Interpretation
The maximum equipartition value ηmax correlates with model initial conditions in a way that can be understood based on the physical insights, stability analyses and mass segregation research discussed in Section 1.
It has been shown previously that the presence of an IMBH suppresses mass segregation. So the effect is naturally to reduce the amount of energy equipartition, measured by η, as well. Fig. 7 shows the η(t, r) profiles for our simulation with an IMBH. These can be compared to the results in Fig. 6 for a similar model (with twice the number of particles) without an IMBH. The inclusion of an IMBH yields a modest reduction in ηmax. We attribute this to the fact that the IMBH generally has at least one particle tightly bound to it (often a compact remnant). This binary system scatters single main-sequence stars out of the core, independently of their mass (as these third bodies have masses much smaller than the IMBH binary). This partially counters the natural tendency for more massive main-sequence stars to segregate into the core and have a lower velocity dispersion compared to lighter counterparts.
Time evolution of the energy equipartition indicator η (the power-law slope in the relation between velocity dispersion and mass, σ ∝ m−η) for single main-sequence stars in a simulation with a central IMBH, N = 32769 particles, W0 = 7, a Miller & Scalo (1979) IMF, and no primordial binaries. The overall evolution is similar to that for the corresponding simulation without a central IMBH (see Fig. 6, which uses the same layout and colour-coding). However, the IMBH suppresses the amount of equipartition that is achieved (see Section 3.2.2), yielding somewhat lower η, especially for the innermost radial Lagrangian bin. This simulation also shows the same ‘energy divergence’ towards η < 0 in the outer parts at early times as in Fig. 6.
Primordial binaries also act towards suppressing mass segregation, with a qualitatively similar mechanism. So it is not surprising that we generally find a decrease in ηmax with increasing f (see Table 1). And stellar mass black holes tend to form BH–BH binaries, which also act in a similar way. Hence, it is not surprising that our two simulations with a low retention fraction of neutron stars and BHs yield the highest values of ηmax (i.e. achieving the most equipartition in their central region).
Finally, we find that runs with a steeper IMF yield similar ηmax but marginally higher η∞. This is consistent with the analysis of Vishniac (1978). With a steeper IMF, heavy particles can transfer their kinetic energy more efficiently to their lighter counterparts, since those are more numerous. Hence, more equipartition can be reached.
The theoretical expectation is that the initial concentration of the system should not play a significant role in determining ηmax. This is because after several relaxation times the system has evolved towards a quasi-equilibrium state with a universal concentration, independently from where it started from (Trenti et al. 2010). As mentioned in Section 3.2.1, our results taken at face value do not confirm this. We find lower ηmax in simulations started with lower W0. However, this is most likely because of the effects of the tidal field on the kinematics of the system. The concentration in the initial conditions of most of our simulations is self-consistently associated with the assumed tidal field strength. Instead, our simulation starting from low initial concentration W0 = 3, but with an under-filled tidal Roche lobe, yields similar ηmax as a simulation starting with W0 = 7. So we conclude tentatively that concentration does not affect equipartition, while a strong tidal field has a mild effect of suppressing the maximum η.
3.3 Energy divergence
The expectation based on generic thermodynamic arguments is that clusters evolve towards energy equipartition (even if they may never reach complete equipartition). So if one starts from a state with η = 0 (velocity dispersion independent of mass m), one expects evolution towards a state in which high-mass stars have lower velocity dispersions than low-mass stars (i.e. η > 0). Interestingly, we have found a few instances in our simulations where this does not hold true. Instead, there is what one might call ‘energy divergence’, where part of system evolves towards a state where high-mass stars have higher velocity dispersions than low-mass stars (i.e. η < 0).
We find such energy divergence only in some of our simulations, and only for the outer ∼20–30 per cent of the particles during the first few initial half-mass relaxation times. The η(t, r) profiles shown in both Figs 6 and 7 provide examples of this. The energy divergence appears transient, and it develops over the same time-scale over which maximum energy equipartition develops in the core. Because of this, we interpret the energy divergence as a result of dynamical interactions in the core. These interactions eject to the outer regions of the system particles that have partially thermalized at a higher velocity dispersion, and that tend to be heavier than those native in the outer regions because of central mass segregation.
Support for this scenario comes from the fact that the two simulations that clearly show this feature are the IMBH run (Fig. 7) and a run that forms a BH–BH binary and starts from a high core density (W0 = 7; Fig. 6). In both cases, it is expected that main-sequence stars in the core are scattered out nearly independently of their mass (Gill et al. 2008). After several half-mass relaxation times, this transient disappears once partial equipartition has time to develop in the outer regions as well.
We also find η < 0 in some of our simulations at very late times, when the system has lost more than 80 per cent of its mass. However, this may very well be because very few main-sequence stars are remaining, so that the measurement of η suffers from significant numerical noise. We therefore do not attach much physical significance to those instances of energy divergence.
4 APPLICATION TO OMEGA CEN
With the advent of HST proper motion studies of the internal kinematics in globular clusters (see Section 1), it is now becoming possible to actually measure the amount of equipartition in globular clusters. With the models presented in this paper, this opens up the possibility of detailed data-model comparisons. As a first application, we consider here the case of the galactic globular cluster Omega Cen (NGC 5139).
Anderson & van der Marel (2010) determined a proper motion catalogue for the core of Omega Cen from ACS/WFC data with a 4-year time baseline. The relation between σ and m for stars along the main sequence with m = 0.5–0.8M⊙ is shown in their fig. 25(c). They showed that a power-law σ = m−η with η ≈ 0.2 describes the data reasonably well. This implies that Omega Cen is between the extremes of no equipartition and complete equipartition. This is qualitatively similar to what we find generically in our N-body simulations. It is also consistent with earlier work by Anderson (2002), which showed that there is mass segregation in Omega Cen, but not as much as predicted by multi-mass Michie–King models that assume complete equipartition.
Andrea Bellini (private communication 2013) refined the proper motion catalogue of Anderson & van der Marel (2010) in the context of an ongoing HST Archival study of two dozen globular clusters (Bellini et al. 2013). He added more recent WFC3/UVIS data in many filters. This increases the time-baseline of the Omega Cen data to 8 years, and reduces all proper motion errors correspondingly. For the same sample of stars as in the ‘central field’ of Anderson & van der Marel (2010), including stars down to m ≈ 0.3M⊙ but using improved proper motions, he finds that η = 0.16 ± 0.05. This is the value that we will adopt here for our data-model comparison. The error bar includes the contributions of both random and systematic errors. Random errors are obtained from a least-squares fit to the σ(m) data, with propagation of the random uncertainties for individual mass bins. Systematic errors reflect, e.g. variations in best-fitting η values depending on exactly which WFC3/UVIS filters are included in the construction of the catalogue.
For a quantitative data-model comparison, we need to estimate the dynamical age of Omega Cen. McLaughlin & van der Marel (2005) showed that the surface brightness is well fitted by a King model with |$W_0=6.2^{+0.2}_{-0.1}$|, |$c=1.31^{+0.05}_{-0.03}$|, |$r_{\rm c}=141.2^{+6.5}_{-12.69}$| arcsec and LV, tot = 10.06.10 ± 0.02. van der Marel & Anderson (2010) derived from a dynamical model for the spatially resolved kinematics a distance D = 4.7 ± 0.06 kpc and mass-to-light ratio M/LV = 2.64 ± 0.03 in solar units. From these values we infer using equation (1) a relaxation time trh = 109.96 yr at the half-light radius rh = 6.8 pc. For an assumed age of 13 Gyr, this implies t = 1.43trh. Note that our rescaling of the simulation results to the relaxation time age of Omega Cen can be done because we are neglecting stellar evolution. Otherwise, rescaling the dynamical times would have modified the physical age of the stars, changing the dynamics (for example by having a different turn-off mass).
For comparison to our simulations, we need to know the age in units of the initial half-mass relaxation time trh(0), and not the current half-mass relaxation time trh. Because of a combination of tidal evaporation of particles and contraction/expansion of the system, there is not a well-defined relation between current and initial relaxation time. In the case of a system similar to Omega Cen, it is possible that trh(t) is either larger or smaller than trh(0), primarily depending on the retention fraction of stellar mass black holes (and on the presence/absence of a central IMBH), and on the initial concentration of the system. If either stellar mass black holes or an IMBH is present in the system, then it is likely there has been expansion of the half-light radius fuelled by energy generation in the core of the system, which implies trh(t) > trh(0). On the other hand, if Omega Cen lacks massive dark remnants, it is possible that its half-light radius has undergone contraction since the cluster formation. Conservatively, we assign an uncertainty of 35 per cent to the dynamic age of the system: t = (1.43 ± 0.5)trh(0). This uncertainty includes both contributions propagated from the current model parameters that describe Omega Cen, and from the systematic unknowns on the composition and expansion/contraction history of the cluster.
To compare the observed amount of energy equipartition in the central field of Anderson & van der Marel (2010) to the simulations, we use the simulated Lagrangian bin that contains the inner 10 per cent of the particles in projection. When the simulation is scaled to the size of Omega Cen, these particles have a similar median projected radius as the observed field.5 The comparison between the measured η for Omega Cen and the predictions of all of the N-body simulations is shown in Fig. 8.6
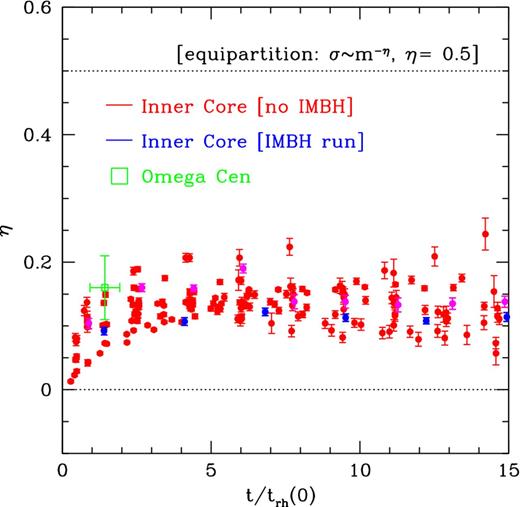
Data-model comparison of energy equipartition in Omega Cen. The time evolution of η (the power-law slope in the relation between velocity dispersion and mass, σ ∝ m−η) is shown as in Figs 3, 6 and 7. Data points show the results from the N-body simulation snapshots for the innermost 10 per cent of the main-sequence stars in projection. All N-body simulations are included, and are generally shown in red; the simulation that includes an IMBH is shown in blue, and the simulation that is similar to that but without the IMBH is shown in magenta. The observed η for Omega Cen is plotted with error bars in green at the current dynamical age t/trh(0). Overall, there is excellent consistency between simulations and observations, supporting the view that globular clusters are not generally in energy equipartition.
Given the dynamical age of Omega Cen, the simulations predict η to be in the range 0.07–0.15. The measured η = 0.16 ± 0.05 falls within this range. So overall, there is excellent consistency between simulations and observations. The simulation with an IMBH predicts a slightly lower η than observed, while the simulation with the same initial conditions but no IMBH fits better. However, a broader suite of simulations with IMBHs would be needed to place any quantitative constraints on the possible presence of an IMBH in Omega Cen (a topic that continues to be debated; e.g. Noyola et al. 2010; van der Marel & Anderson 2010). With more sophisticated future analyses, smaller observational uncertainties, or larger samples of clusters, it may become possible to use observed η values to discriminate between different clusters models.
5 DISCUSSION AND CONCLUSIONS
It is widely believed, and commonly taught, that a globular cluster evolves, given a sufficiently long time, towards a state in which its stars are in energy equipartition (at least near the centre, where the relaxation times are shortest). If the mean kinetic energy |$\langle {1\over 2}m v^2\rangle$| becomes independent of mass m due to two-body relaxation (i.e. collisions), the velocity dispersion σ ≡ 〈v2〉0.5 scales as σ ∝ m−0.5. Some popular multi-mass dynamical models for globular clusters, the so-called Michie–King models, have this scaling built in by assumption (Gunn & Griffin 1979) and have been used in several studies (e.g. in recent years: Beccari et al. 2010; Paust et al. 2010; Maccarone & Peacock 2011; Sollima et al. 2012).
We have shown here that this paradigm is incorrect, using direct N-body simulations which are free of any assumption regarding energy equipartition. The luminous stars in a globular cluster that has evolved for a long time converge towards σ ∝ m−η, with η∞ ≈ 0.08 ± 0.02 independent of position in the cluster. In this state, the velocity dispersion is nearly independent of mass. The inner regions can reach values up to ηmax ≈ 0.2 after several initial half-mass relaxation times. Either way, the luminous stars in globular clusters with realistic IMFs always remain far from complete equipartition.
The physical mechanism that explains why some systems cannot attain energy equipartition, namely the Spitzer (1969) instability for a two-component system, has been know for a long time. Also, Vishniac (1978) showed that for a continuous mass function of the Salpeter form, energy equipartition is not attainable. However, the implications of these results have gotten little attention in the literature. This is probably because previous investigations focused solely on the stability of systems with respect to energy equipartition (e.g. Spitzer 1969; Vishniac 1978; Kondrat'ev & Ozernoy 1982) or the implied mass segregation. The latter is a consequence of energy equipartition but depends on other things as well (e.g. Khalisi et al. 2007; Gill et al. 2008; Pasquato et al. 2009).
No previous theoretical study appears to have addressed the dynamical evolution of realistic star cluster models with a specific focus on mass-dependent kinematics to determine exactly how close or far one expects systems to be from energy equipartition. We therefore made this the topic of the present paper. This analysis is particularly timely, because with the advent of HST proper motion studies, it has now become possible to actually measure the relation between σ and m in real clusters (Anderson & van der Marel 2010). Measurements of this relation for main-sequence stars in some two-dozen clusters are forthcoming (Bellini et al. 2013). This opens up a whole new discovery space. Detailed data-model comparisons of mass-dependent kinematics have the potential to shed new light on globular cluster dynamics and on their evolution.
We analysed the stellar dynamics in the direct N-body simulations previously carried out by Trenti et al. (2010). We quantified the relation between σ and m, as function of time and position in the cluster, for realistic IMFs and initial conditions. We find that this relation is well fitted by a power law of the form σ ∝ m−η, both for single main-sequence stars and for compact remnants. Compact remnants tend to have higher η than main-sequence stars (but still η < 0.5), due to their steeper (evolved) mass function. In the present paper we have focused mostly on the main-sequence stars, which are actually observable. Our main conclusions from this analysis are as follows:
The value of η generally increases linearly in the first few initial half-mass relaxation times (trh(0)). The increase is faster for Lagrangian bins closer to the centre, where relaxation times are shorter. The central bin (containing the inner 10 per cent of the stars as seen in projection) reaches a maximum ηmax ≈ 0.15 ± 0.03. The increase to this value is mostly completed by t ≈ 3trh(0). At large times, all radial bins convergence on an asymptotic value η∞ ≈ 0.08 ± 0.02.
No simulated system ever reaches a state close to complete equipartition with η = 0.5. Even our most favourable conditions for equipartition to develop in the core, that is a steep IMF and low retention fraction of remnants, still yield only ηmax ≲ 0.19. Also, restricting the analysis to particles at the centre of the system in a three-dimensional, rather than projected, sense does not change our conclusions (although this does yield a slight increase Δη ≈ 0.05).
Partial energy equipartition develops in an overall strikingly similar way across all our numerical experiments, despite the variety of initial conditions employed (compare e.g. Figs 3, 6 and 7). The maximum and asymptotic η values do not differ much between runs (e.g. see Table 1 and Figs 4 and 5). Some trends are present depending on IMF and the content of compact remnants and binaries, and those trends can be understood based on simple physical arguments (see Section 3.2.2).
The simulation with a central IMBH has the least amount of equipartition (as measured by ηmax) among the sample of initial conditions considered. This result is consistent with the suppression of mass segregation that we have observed in simulations with a central IMBH (Trenti et al. 2007b; Gill et al. 2008; Pasquato et al. 2009). Further investigations with a larger sample of runs (especially with an IMBH) are required to fully characterize the generality of this result. Either way, this does suggest a new method for constraining the possible presence of an IMBH in a globular cluster, namely through the slope η of the σ–m relation.7 This is completely independent from methods based on the radial velocity dispersion profile σ(r) (e.g. van der Marel & Anderson 2010), but can be pursued with similar (proper motion) data sets.
Any existing results derived from dynamical modelling that assumed complete energy equipartition by construction may be affected by unknown biases that will need to be carefully evaluated. For example, past studies have often relied on multi-mass Michie–King models (e.g. de Marchi et al. 2000; Beccari et al. 2010), and the underlying equipartition assumption of such models does not appear to be correct. It would be worthwhile for future studies to quantify any biases that might be introduced, or to modify the underlying model assumption to σ ∝ m−η with |$\eta \not= 0.5$|.
Comparison of our simulations to a measurement of η from HST proper motions in the core of Omega Cen yields good agreement. This supports the view that globular clusters are not generally in energy equipartition.
The authors are grateful to Jay Anderson and Andrea Bellini for collaboration on related projects, and for providing observational drivers for this theoretical work. Andrea Bellini kindly provided his latest proper motion results on Omega Cen, which were compared to our simulations in Section 4. The authors thank Adriano Agnello for useful suggestions and discussions. Support of HST Theory proposals HST-AR-11284 and HST-AR-12156 was provided by NASA through grants from STScI, which is operated by AURA, Inc., under NASA contract NAS 5-26555. MT acknowledges support from the Kavli Institute for Theoretical Physics, through the National Science Foundation grant PHY05-51164. This research was supported in part by the National Science Foundation through TeraGrid resources provided by the National Center for Supercomputing Applications (grants TG-AST090045 and TG-AST090094). This project is part of the HSTPROMO collaboration,8 a set of HST projects aimed at improving our dynamical understanding of stars, clusters and galaxies in the nearby Universe through measurement and interpretation of proper motions.
This procedure implicitly assumes isotropy in the three-dimensional velocity distribution, as expected for a collisionally relaxed stellar system. We did verify that our results do not change (except for somewhat increased noise) if we compute two-dimensional velocity dispersions directly.
This is obtained considering all particles in the system. In general the distributions change with radius because main-sequence stars and remnants have different mass-segregation profiles. However, the intersection point of the two curves does not depend on radius, since by definition particles at the intersection point of the two curves have the same mass in both samples, and hence the same mass segregation profile.
This drop in η is likely due to the formation of binaries in the core. These provide heating that acts to reduce mass segregation and the approach to equipartition.
This comparison does not account for all the details of the observations and of the cluster. For example, the field observed for proper motions is not a circle. Omega Cen is elongated and rotating, unlike the simulated clusters. And finally, the mass function in our simulations was not tailored to fit specific observations of Omega Cen.
Most of our simulations have initial concentration W0 = 5 or 7, which is close to the current value |$W_0=6.2^{+0.2}_{-0.1}$| for Omega Cen.
Searching for an equipartition signature from an IMBH in the cluster core has the potential to provide a diagnostic at earlier times in the life of a system than does mass segregation, since mass segregation is a consequence of equipartition. In fact, t ≳ 5trh(0) is required to discriminate systems with or without an IMBH from mass segregation (Gill et al. 2008), while potentially a signature in η can be seen already at t ≳ 2trh(0).
For details see HSTPROMO home page at http://www.stsci.edu/~marel/hstpromo.html
