


Abstract
Swift J1745−26 is an X-ray binary towards the Galactic Centre that was detected when it went into outburst in 2012 September. This source is thought to be one of a growing number of sources that display ‘failed outbursts’, in which the self-absorbed radio jets of the transient source are never fully quenched and the thermal emission from the geometrically thin inner accretion disc never fully dominates the X-ray flux. We present multifrequency data from the Very Large Array, Australia Telescope Compact Array and Karoo Array Telescope (KAT-7) radio arrays, spanning the entire period of the outburst. Our rich data set exposes radio emission that displays a high level of large-scale variability compared to the X-ray emission and deviations from the standard radio–X-ray correlation that are indicative of an unstable jet and confirm the outburst's transition from the canonical hard state to an intermediate state. We also observe steepening of the spectral index and an increase of the linear polarization to a large fraction (≈50 per cent) of the total flux, as well as a rotation of the electric vector position angle. These are consistent with a transformation from a self-absorbed compact jet to optically thin ejecta – the first time such a discrete ejection has been observed in a failed outburst – and may imply a complex magnetic field geometry.
INTRODUCTION
Once thought to be an anomaly, relativistic jets are now accepted to be a standard feature of stellar mass black holes in actively accreting low-mass X-ray binary (LMXB) systems (e.g. Mirabel & Rodríguez 1998; Fender 2006), possibly remaining active in quiescence (e.g. Gallo et al. 2006). During outburst, powered by increased accretion on to the black hole, the radio jets evolve through various phases: initially increasing in power before being quenched and, later, reactivated. The morphology of the radio jets depends on (Fender 2006) the observed X-ray ‘states’ (see e.g. McClintock & Remillard 2006; Belloni 2010). In the hard state, when the X-ray spectrum is dominated by power-law emission from the optically thin, geometrically thick inner regions, the radio jets are described by self-absorbed synchrotron emission with a flat (α ∼ 0) or inverted spectrum (α > 0), where Fν ∝ να; this is interpreted as an optically thick, compact jet. In the soft or thermal-dominant state, when the X-ray spectrum is dominated by a thermal blackbody component from the accretion disc that extends down to the innermost stable circular orbit (ISCO), the radio jets are observed to be quenched by a factor of at least 700 (e.g. Coriat et al. 2011; Russell et al. 2011). In the transition between hard and soft, defined by various classes of intermediate states, the radio is in some cases observed to become optically thin (α < 0) and to exhibit flares; in a number of sources, these have been spatially resolved (e.g. Tingay et al. 1995; Mirabel & Rodríguez 1998; Miller-Jones et al. 2012) as discrete ejecta.
The connection between the radio and X-ray properties of LMXBs is further demonstrated by the strong correlation that exists between their X-ray and radio luminosities in the hard state (e.g. Hannikainen et al. 1998; Corbel et al. 2000, 2003, 2013a; Gallo, Fender & Pooley 2003). In recent years, a number of outliers to this correlation have been identified – including XTE J1859+226 (Corbel et al. 2004), IGR J17497−2821 (Rodriguez et al. 2007), Swift J1753.5−0127 (Cadolle Bel et al. 2007), H1743−322 (Coriat et al. 2011), MAXI J1659−152 (Jonker et al. 2012) and XTE J1752−223 (Ratti et al. 2012) – which called into question the universality of the relationship. However, it is now accepted that these outliers form a distinct population (Gallo, Miller & Fender 2012) that form a secondary (radio quiet) branch obeying its own correlation. Furthermore, at low luminosities a transition is observed between the two branches (Coriat et al. 2011; Jonker et al. 2012; Ratti et al. 2012). Interestingly, it has recently been suggested that AGN might show the same bimodal correlation (King et al. 2013), supporting the idea that the same physical mechanisms extract energy from black holes at very different mass scales.
How and when the quenching and reactivation of the jets occur during the intermediate states, and what causes the discrete ejecta are still poorly understood. In fact, in an increasing number of ‘failed outbursts’, the system never transitions to the soft state, the self-absorbed radio jets are never fully quenched and the geometrically thin accretion disc likely remains truncated at a radius greater than the ISCO and never fully dominates the observed X-ray flux (e.g. nine sources in Brocksopp, Bandyopadhyay & Fender 2004, and references therein; Wijnands & Miller 2002; Capitanio et al. 2009; Ferrigno et al. 2012; Soleri et al. 2013). In some outbursts, multiple radio flares are observed when the jet is repeatedly suppressed and reactivated in the intermediate states before, or instead of, a full state transition (Fender, Belloni & Gallo 2004). Such outbursts may reveal new information on jet suppression and reactivation in both failed and successful outbursts of X-ray binaries.
Radio jets are normally described by their photometric, spectral and, occasionally, spatial properties, as summarized above, but only a few have been observed to exhibit polarization, which can be used to infer physical properties. While optically thick and thin synchrotron emission from the jet can, in the presence of an ordered magnetic field, produce linear polarizations of up to ≈10 or ≈70 per cent, respectively (Longair 1994), relatively few LMXBs have been observed to do so (e.g. Fender 2003 and references therein; Brocksopp et al. 2007, 2013). If detected, polarization can be used to infer properties of the jet, such as orientation, and of the magnetic field of the jet and the surrounding medium (e.g. Stirling et al. 2004). However, the magnetic field is not necessarily ordered and a number of mechanisms – such as multiple, unresolved components that cancel each other out, or spatially dependent Faraday rotation – can suppress the resulting net polarization (see e.g. Brocksopp et al. 2007 and references therein).
Swift J1745−26
The transient black hole candidate Swift J1745−26 (also known as Swift J174510.8−262411) was discovered in the Galactic Centre region (l, b = 2| $_{.}^{\circ}$|11, 1| $_{.}^{\circ}$|40) by the Burst Alert Telescope (BAT) on board the Swift satellite on 2012 September 16 at 09:16 ut (MJD 561 86.386 18) (Cummings et al. 2012a). The narrow-field instruments on Swift – the X-ray Telescope (XRT) and the Ultraviolet/Optical Telescope – began observing the source approximately 1260 s after the trigger and detected an X-ray counterpart (Cummings et al. 2012b; Sbarufatti et al. 2012). While no optical/UV source was detected by Swift [unsurprising given that the extinction in that direction of E(B − V) ≈ 3.3 (Schlegel, Finkbeiner & Davis 1998) implies ≳10 mag (Cardelli, Clayton & Mathis 1989) of attenuation in any of the Swift observing bands], an infrared counterpart was identified on the basis of variability against archival images (Rau et al. 2012). It was suggested that the source was an LMXB black hole system on the basis of X-ray (Swift and INTEGRAL) spectral and timing observations. These were also used to classify its state at various epochs throughout the outburst as being either hard or hard intermediate (e.g. Belloni et al. 2012; Grebenev & Sunyaev 2012; Tomsick, DelSanto & Belloni 2012; Vovk et al. 2012; Sbarufatti et al. 2013) suggesting that this was a ‘failed outburst’. The black hole nature of the source is further supported by optical observations during outburst which display a broadened Hα emission line indicative of a black hole accretor (Muñoz-Darias et al. 2013).
Observations at the Karl G. Jansky Very Large Array (VLA) localized the position of the detected radio counterpart to be RA = 17:45:10.849 ± 0.001, Dec. = −26:24:12.60 ± 0.011 (J2000; Miller-Jones & Sivakoff 2012) while observations at the Australia Telescope Compact Array (ATCA) found a spectral index consistent with optically thick synchrotron emission from a partially self-absorbed compact jet (Corbel et al. 2012). In this paper, we present the full sets of radio data from ATCA, VLA and Karoo Array Telescope (KAT-7) monitoring observations of Swift J1745−26 obtained over the period of the outburst. In Section 2, we introduce the observations and reduction methods, while in Section 3 we discuss the results of our photometric and spectral analyses of the data and discuss their physical implications for the system. We summarize our findings in Section 4.
OBSERVATIONS AND ANALYSIS
Radio data
VLA
Swift J1745−26 was observed by the VLA from 2012 September 18 to November 17 (16 epochs in the most extended, A, configuration) at multiple frequency bands from 1 to 48 GHz (Table 1), though on the majority of the epochs the source was only observed up to 26 GHz. Each frequency was comprised of two basebands, with eight spectral windows of 64 2 MHz channels each – giving a bandwidth of 1.024 GHz per baseband. The exception is the 1.5 GHz band, which has 16 spectral windows of 64 1 MHz channels each, again giving a bandwidth of 1.024 GHz. Flagging, calibration and imaging of the data followed standard procedures and were carried out within the Common Astronomy Software Application (casa) package (McMullin et al. 2007). The 1.5 GHz band is affected by a high level of radio frequency interference (RFI) which reduces the usable bandwidth to 512 MHz, spread over the baseband.
Band names, central frequencies, bandwidths and systematic errors of the radio observations.
| Band | Freq. | Bandwidth | Systematic |
|---|---|---|---|
| (GHz) | (MHz) | (per cent) | |
| VLA: | |||
| L | 1.5 | 1024 | 1 |
| C5 | 5.0 | 1024 | 1 |
| C7 | 7.5 | 1024 | 1 |
| U14 | 14.4 | 1024 | 3 |
| U17 | 17.2 | 1024 | 3 |
| K21 | 20.8 | 1024 | 3 |
| K26 | 25.9 | 1024 | 3 |
| Ka32 | 31.5 | 1024 | 3 |
| Ka38 | 37.5 | 1024 | 3 |
| Q42 | 41.5 | 1024 | 5 |
| Q48 | 47.5 | 1024 | 5 |
| KAT-7: | |||
| 1.8 | 234 | – | |
| ATCA: | |||
| 5.5 | 2048 | 1 | |
| 9.0 | 2048 | 1 |
The primary calibrator used as the bandpass and polarization angle calibrator, and to set the amplitude scale in all bands, was 3C286 (a.k.a. J1331+3030). The choice of secondary calibrator was dependent on the frequency of the observations, with J1751−2524 being used at frequencies <10 GHz, J1744−3116 being used at frequencies from 10 to 20 GHz and J1745−2900 being used at frequencies >20 GHz. The polarization leakage calibrator, where polarization calibration was performed, was J1407+2827. Images were made and phase self-calibration was then performed on a per-baseband basis. Due to the large fractional bandwidth (Δν/ν) of the 1.5, 5.0 and 7.5 GHz bands, additional self-calibration on a per-spectral-window basis was applied.
The flux densities of the source were measured by fitting a point source in the image plane (Stokes I), and, as is usual for VLA data, systematic errors of 1 per cent (<10 GHz), 3 per cent (10–40 GHz) or 5 per cent (>40 GHz) were added. In the 1.5, 5.0, 7.5 14.4 and 17.2 GHz bands, Stokes Q and U fluxes were also measured at the position of peak flux (Table 2). Due to the birefringence of the local or interstellar medium, Faraday rotation (see Section 2.4) will cause a rotation of the linear polarization vectors. Over the wide fractional bandwidth of the 1.5 GHz band, this will cause a smearing out of any polarization signal over each 64 MHz spectral window; hence, the Stokes Q and U fluxes must be extracted on a per-channel basis.
Sample radio flux densities of source, Fν, at frequency, ν, and Stokes Q and U flux densities at that frequency (all given before systematic errors are added). Full, plain-text table is available online.
| Epoch | ν | Fν | Q | U |
|---|---|---|---|---|
| (MJD) | (GHz) | (mJy) | (mJy beam−1) | (mJy beam−1) |
| 561 87.991 | 5.0 | 6.77 ± 0.13 | −0.025 ± 0.021 | −0.113 ± 0.021 |
| 561 87.991 | 7.5 | 6.26 ± 0.03 | −0.075 ± 0.012 | −0.074 ± 0.012 |
| 561 89.210 | 5.5 | 14.40 ± 0.70 | – | – |
| 561 89.210 | 9.0 | 13.70 ± 0.60 | – | – |
| 561 90.087 | 5.0 | 16.66 ± 0.06 | 0.063 ± 0.022 | −0.206 ± 0.024 |
| 561 90.087 | 7.5 | 15.92 ± 0.07 | 0.035 ± 0.023 | −0.205 ± 0.025 |
| 561 91.327 | 1.90 | 19 ± 12 | – | – |
ATCA
The ATCA carried out a long-term monitoring campaign on Swift J1745−26 at 5.5 and 9 GHz during 24 epochs from 2012 September 19 to 2013 March 27. Observations were carried out using the Compact Array Broadband Backend (Wilson et al. 2011) with the array in a number of configurations ranging from H168 to 6A. Each frequency band was composed of 2048 channels of 1 MHz. We used PKS 1934−638 for absolute flux and bandpass calibration, and J1710−269 to calibrate the antenna gains as a function of time. Flagging, calibration and imaging were carried out with the Multichannel Image Reconstruction, Image Analysis and Display (miriad) software (Sault, Teuben & Wright 1995). The flux densities of the source were measured by fitting a point source in the image plane (Table 2). Systematic errors for the ATCA fluxes are approximately 1 per cent.
KAT-7
Observations with the seven-dish MeerKAT test array, KAT-7 (for further details, see Armstrong et al. 2013) were performed at a central frequency of 1.822 GHz during 13 epochs from 2012 September 13 to November 11. The maximum and minimum baselines of the array are 192 and 24 m, respectively. PKS 1934−638 was used as the primary (bandpass and flux) calibrator while J1713−2658 was used as the secondary (gain and phase) calibrator during all epochs. The 234 MHz bandwidth was made up of 600 channels, each 390.625 kHz wide.
Visibility data were flagged with AOFlagger,2 which removed an average of 1.9 per cent of the recorded data due to RFI, before calibration and image analysis were performed with the casa radio astronomy package (McMullin et al. 2007). Source flux densities (Table 2) were obtained by subtracting the quiescent field (observed on 2013 June 6, after the source had faded at radio frequencies) in the image plane, and then measuring the residual at each epoch, as detailed in Armstrong et al. (2013).
OVRO
We attempted to observe the source at 15 GHz with the Owens Valley Radio Observatory (OVRO) 40 m telescope, within the regular OVRO blazar monitoring programme (Richards et al. 2011). However, all observations were non-detections or unreliable due to the low declination and low observing elevation of the source (Hovatta, private communication).
X-ray data
For the purpose of comparison, Swift X-ray light curves were obtained from the XRT online tool3 (Evans et al. 2009) and the BAT transient monitor4 (Krimm et al. 2013). Both these resources offer count rate light curves (and, for the XRT, hardness ratios defined by the ratio of 1.5–10 keV/0.3–1.5 keV count rates) extracted using standard procedures (Fig. 1). The unsampled period of X-ray data is when the source was unobservable due to the position of the Sun. Due to the source's proximity to the Galactic Centre, the MAXI X-ray monitor aboard the International Space Station (Matsuoka et al. 2009) was unable to obtain data on the source during the outburst.
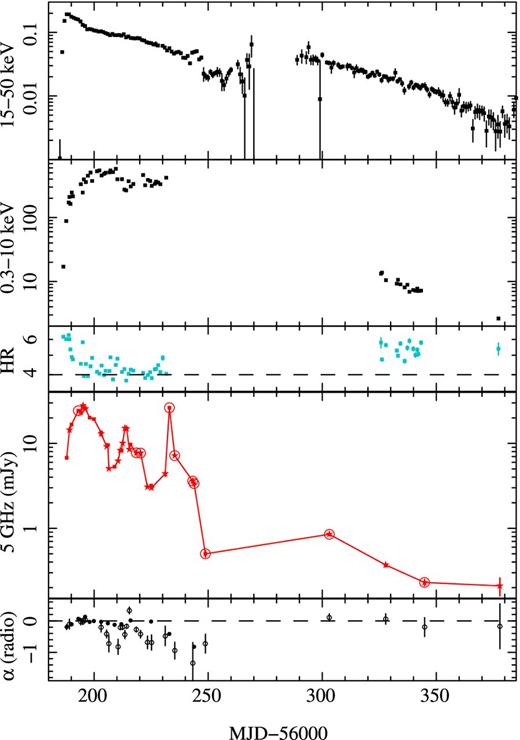
Hard (BAT; 15–50 keV) and soft (XRT; 0.3–10 keV) X-ray light curves (counts per second), the soft X-ray hardness ratio (1.5–10 keV/0.3–1.5 keV), the 5 and 5.5 GHz radio light curves (mJy; squares and stars, respectively), and the radio spectral index over the period of our observations. The dashed horizontal lines on the hardness ratio and radio spectral index are purely to guide the eye as to the relative behaviour throughout the outburst. Connecting lines are used to demonstrate the general behaviour of the radio light curve, but we caution that it is highly dependent on sampling; the encircled radio fluxes are the epochs that were not included on the correlation plot (Fig. 5) due to a lack of quasi-simultaneous X-ray flux. The radio spectral indices represented by hollow circles are epochs with only two observed frequencies, and whose errors may therefore be underestimated.
To calculate X-ray luminosities, via fluxes, in the 1–10 and 3–9 keV ranges, average XRT spectra were obtained from the XRT online tool. The periods of the spectra were chosen so that they coincided with the initial, rising period of the XRT light curve (MJD 561 80–562 00), the softest period of the outburst (MJD 562 00–562 50) and the late-time period when the hardness ratio had recovered to its original value (MJD 563 20–563 80). Only at early times – when the hardness ratio, and hence spectra, was obviously evolving – will using an average spectrum cause an error, but any such error will be negligible compared to other uncertainties in estimating the luminosities. The spectra were fitted with a simple absorbed power law in xspec (photon index, Γ ≈ 1.5–2.5, column density, NH ≈ 1–1.4 × 10²², in agreement with the automated fits of the online tool); including a blackbody component in the fit made no discernible improvement. Count rate to unabsorbed flux conversions of 2.1 × 10⁻¹⁰, 3.4 × 10⁻¹⁰ and 1.1 × 10⁻¹⁰ erg cm−2 count−1 (1–10 keV) or 1.1 × 10⁻¹⁰, 1.2 × 10⁻¹⁰ and 0.6 × 10⁻¹⁰ erg cm−2 count−1 (3–9 keV) were derived from the average spectra over the three epochs. A more complete treatment of the X-ray data is beyond the scope of this work and is the subject of another work (Sbarufatti et al., in preparation).
Spectral indices
We fit (linearly in log–log space) the derived radio flux densities, Fν, against frequency, ν, to obtain the spectral index, α, of the radio spectra at each epoch. The flux density of each band was used, except in the case of the 1.5 GHz band where flux densities per 64 MHz spectral window were used, but we obtain similar values if we also use the per-spectral-window flux densities at 5.0 and 7.5 GHz. All epochs were reasonably well fitted by a single power law with no need for additional components. On many of the epochs, only two radio bands were observed (either 5 and 7.5 GHz or 5.5 and 9 GHz), and on these days the spectral index is underconstrained by the data and hence may be less accurate. In the bottom panel of Fig. 1 and the second panel of Fig. 2, we have therefore drawn a distinction between these points and those that used a broader fit to measure the index.
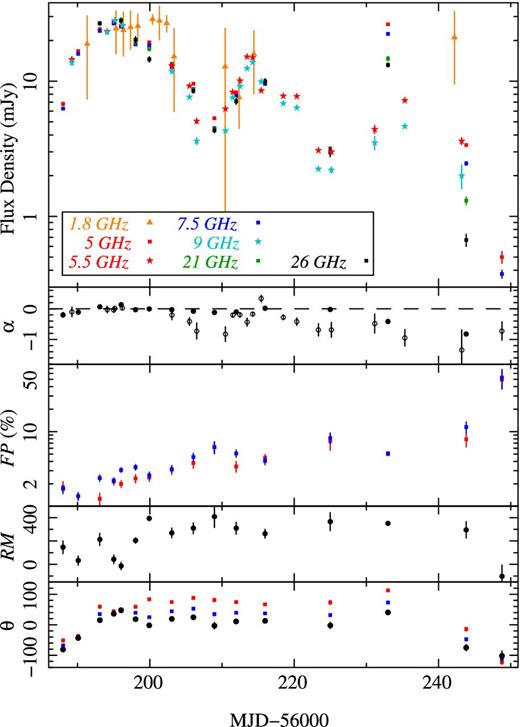
Radio light curves, spectral and polarization parameters of the source during outburst. The upper panel shows the flux densities at each of the seven radio frequencies observed (legend is common to all panels; VLA observations are represented by squares, ATCA observations by stars and KAT-7 by triangles), while the second panel shows the radio spectral index (as in Fig. 1 the spectral indices represented by hollow circles are epochs with only two observed frequencies). The third panel shows the fractional polarizations, FP, at two of those frequencies (5 and 7.5 GHz). The fourth and fifth panels show the rotation measure, RM, and intrinsic electric vector position angle (EVPA; black circles), θ, derived from the observed polarization angles (shown in blue and red in the final panel).
Polarization
The polarization parameters were derived from the measured flux densities of the Stokes Q and U images: linear polarization, |${\rm LP} = \sqrt{Q^2 + U^2}$|; fractional polarization, |${\rm FP} = 100 \sqrt{Q^2 + U^2}/I$|; and polarization angle, |${\rm PA} = 0.5 \arctan (U/Q)$|, which is degenerate such that derived angles may be offset by an integer multiple of ±180° from the true value. The derived polarimetric parameters at 5.0, 7.5, 14.4 and 17.2 GHz are presented in Table 2 (and, for 5.0 and 5.5 GHz, plotted in Fig. 2) but we could only place (3σ) upper limits of ≲6 mJy (≲30–50 per cent) on polarization in the 1.5 GHz band, for the three epochs of 1.5 GHz observations.
Faraday rotation in the local or interstellar medium causes a rotation of the polarization vectors at wavelength, λ, such that the intrinsic electric vector position angle (EVPA) of the source is related to the observed polarization angle, PA, by EVPA = PA − RMλ2. The rotation measure is given by |${\rm RM} \propto \int _0^d \!n_{{\rm e}} B_{||} \,{\rm d}l$|, where ne is the electron number density, B|| is the magnetic field strength parallel to the line of sight and d is the distance to the source (e.g. Saikia & Salter 1988; Johnston-Hollitt, Hollitt & Ekers 2004; Schnitzeler 2010). Given observed polarization angles at multiple wavelengths, the RM and EVPAs (plotted in Fig. 2) are derived from a linear fit of PA versus λ2.
RESULTS AND DISCUSSION
Light curves, spectral indices and polarization
As the radio light curves at frequencies ≥5 GHz (Fig. 2) share a similar morphology over the sampled epochs, we consider only the most well-sampled radio frequency (5 and 5.5 GHz) for comparison to the X-ray light curves (Fig. 1). The radio light curves, even though undersampled compared to the X-ray data, display a higher level of large-scale variability (we cannot comment here on the smaller scale, shorter time-scale variability due to the limited sampling of the radio light curves). The broad-band light curves peak initially in the hard X-rays (15–50 keV) at MJD ∼ 561 88, followed by the radio at MJD ∼ 561 95 and only then by the soft X-rays (0.3–10 keV) at MJD ∼ 562 00–562 10. During the rise of the soft X-ray emission, the X-ray source softens to a hard intermediate state (Belloni et al. 2012) and the soft X-ray hardness ratio (1.5–10 keV/0.3–1.5 keV) reaches its minimum value (Fig. 1, third panel). After the initial rise to ∼30 mJy at MJD ∼ 561 95, the radio light curve displays a weaker peak of ∼10 mJy at MJD ∼ 562 14 and a bright ‘flare’ of ∼30 mJy at MJD ∼ 562 33. We note, given the rise time of the flare (≲1.8 d) and the light-curve sampling, that other similar flares could have occurred but gone undetected, demonstrating the importance of high-cadence radio observations of outbursts. In contrast to the radio light curve, neither the hard, nor soft, X-ray bands exhibit any corresponding variation in flux. When the X-ray light curve – at least at hard energies – does display variability from approximately MJD ∼ 562 45 until MJD ∼ 562 70, there is little or no radio data with which to compare. At late times (around MJD 563 00), after observations of the source had become unconstrained by the Sun position, the fluxes of both radio and hard X-rays were observed to have increased from the previous measurements. By MJD 563 25 the X-ray hardness had increased towards its initial values, indicating that the source had reverted to the canonical hard state from the hard intermediate state.
The radio light curve at 1.8 GHz clearly exhibits a different morphology from the higher radio frequencies. Though its exact form is difficult to constrain because of the sampling and uncertainties, it seems to plateau, rather than peak, at MJD ∼ 561 95 or possibly later. This is similar behaviour to that exhibited by the soft X-rays (0.3–10 keV), but because of the sampling a more detailed comparison is not possible. It is not uncommon to observe such later peaking and flatter light curves at lower frequencies in synchrotron flaring sources (e.g. Miller-Jones et al. 2009; Armstrong et al. 2013). The lower frequency emission is expected to peak at greater radii (later times) in an expanding jet (e.g. van der Laan 1966; Hjellming & Johnston 1988) causing the light curve to be smoothed out and producing a low-frequency lag.
Due to the relatively sparsely sampled optical (Muñoz-Darias et al. 2013) and radio light curves, nothing more than a cursory comparison is possible (Fig. 3). While both peak at approximately the same time, the radio increases more rapidly and by a larger factor than the optical; likewise the radio decreases more quickly and by a larger factor after that initial peak. The optical light curve exhibits no discernible rise corresponding to the radio peak at MJD ∼ 562 14, nor to the preceding dip 6 d earlier (throughout which, the radio spectrum is approximately flat). This lack of a direct relationship between the two wavelengths implies that if the jet makes a contribution to the optical flux, it is not the dominant emission mechanism (as has been observed in the near-infrared; e.g. Jain et al. 2001; Corbel & Fender 2002; Chaty et al. 2003; Russell et al. 2006, 2013); this is consistent with the detection by Muñoz-Darias et al. of a strong Hα emission line that they ascribe to X-ray reprocessing in the accretion disc. However, we cannot rule out that the jet might contribute to the optical flux and hence we cannot place any limits on the frequency at which the jet transitions from optically thin to optically thick emission.
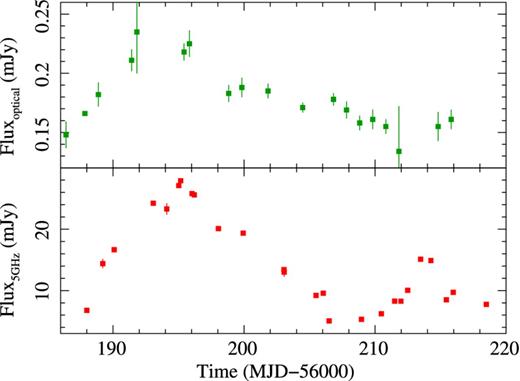
Optical (i′-band, uncorrected for reddening) light curve (Muñoz-Darias et al. 2013) and the 5, 5.5 GHz light curves over the same period for comparison.
As mentioned above, the multifrequency radio light curves (Fig. 2) display similar morphologies as that discussed for the 5 and 5.5 GHz light curves. While the light curves display high levels of variability, the spectral index over most of the outburst is relatively stable at α ∼ 0, only deviating from that flat spectrum at MJD ≳ 562 25 and returning to α ∼ 0 by MJD ∼ 563 00. This decrease of α indicates a steepening of the spectrum and occurs over the same period that the level of fractional polarization increases to ≳7 per cent at the two frequencies where polarimetry is available. It should be noted that the level of fractional polarization increases gradually, and relatively steadily, over the entire period of the outburst sampled from a starting level of ∼1 per cent to its maximum level of ∼50 per cent.
The derived RM of the interstellar medium seems to display a high level of variation during the first 14 d; however, since it is derived from only two frequencies, it may be inaccurate and its variability exaggerated. While we are unable to confirm variability, we note that the observed polarization angles at each frequency exhibit relative changes (Fig. 2, lower panel) over the same period that the RM changes most significantly, suggesting that the variation is real. At epochs between MJD 561 99 and 562 44, the RM is consistent with a value of 347 ± 17 rad m−2 which is comparable to the values found by Roy, Pramesh Rao & Subrahmanyan (2008) for extragalactic sources in this region (RM ≈ 200-1000 rad m−2); at other epochs, assuming that the variability is real, the RM is significantly lower. This suggests a change of the magnetic field strength parallel to the line of sight (B||) or a change of the electron density (ne) in the region of the source. The EVPA displays a steady shift from the initial angle of ∼ −80°, peaking at the same time as the peak in flux, before becoming relatively stable at approximately 0°–30°. At late times (>MJD 562 40), it displays another ∼90° rotation back to its approximate initial position.
Interpretation
The flat radio spectrum of α ∼ 0 and the low level of polarization (≲ 10 per cent) up to MJD 562 25 – spanning both the rise and second peak – are consistent with the radio emission originating from a compact, self-absorbed jet which is expected to exist in the hard state. Assuming a uniform magnetic field, such a jet is expected to have a maximum fractional polarization, FP ≲ 300/(6p + 13) ≈ 11 per cent (Longair 1994) using the canonical value of the electron energy distribution index, p = 2.4. This implies that, even though the X-ray hardness ratio had dropped somewhat, the source did not make a full transition to a soft, thermal dominant, state where the compact jets are expected to be quenched; this is consistent with what was found from the X-ray observations (Belloni et al. 2012). In the hard state of other LMXBs, the compact, self-absorbed jets are observed to be relatively steady and correlated to the X-ray emission (e.g. Corbel et al. 2013a), though it often becomes unstable as the source softens (Fender et al. 2004). Here we see variability by up to a factor of ∼10, uncorrelated to the X-ray emission, in an intermediate state which we will discuss further in Section 3.4.
The radio data from MJD 562 25 to 562 50, comprising the ‘flare’ at MJD ∼ 562 33, display greatly steepened radio spectral indices (≪0) and a high level of polarization, which rises to values inconsistent with those expected from self-absorbed emission but consistent with those of optically thin emission (where FP ≲ 100(p + 1)/(p + 7/3) ≈ 72 per cent; Longair 1994). This implies that the flare is an optically thin ejection event in contrast to optically thick/self-absorbed peaks at earlier times. It has recently been shown that the radio spectral index may display steep values due to a quenching of higher radio frequencies near the hard-to-soft state transition (Corbel et al. 2013b; Russell et al. 2013; van der Horst et al. 2013). However, the spectrum of this flare exhibits no such deviation from a power law so there is no evidence that the spectral steepening is not due to optically thin ejecta. Additionally, such quenching would not cause the observed increase in flux over the flare. While the discrete ejection is expected in the intermediate state, as the source crosses the ‘jet line’ (Fender et al. 2004; Fender, Homan & Belloni 2009), it is interesting to note that this is the first time that such an event has been observed in a failed outburst. It should be cautioned that, since the X-ray data do not span the entire period when the jet is optically thin, we cannot rule out that the source may have made a transition to a full soft state. Further analysis of X-ray data from Swift and INTEGRAL is necessary to confirm this but seems unlikely to support such a transition (Del Santo et al., in preparation).
Electric vector position angle
The intrinsic EVPA displays a rotation of ∼90° at early times while the jet is self-absorbed (low level of polarization, ≲10 per cent, and a flat spectrum) and returns to initial values when the jet displays evidence of changing to being optically thin (steepening spectral slope and increased level of polarization). The latter rotation coincides with a significant reduction of the RM while the earlier rotation occurs during a period of variable RM due to, e.g., a variation of the magnetic field strength (B||) or electron density (ne) in the region of the source.
Due to absorption effects, the EVPA of the steady, self-absorbed jet is expected to be aligned parallel to the magnetic field, which is in turn expected to be parallel to the jet axis (e.g. Ginzburg & Syrovatskii 1969; Longair 1994). Hence, the EVPA of ∼0°–30° from MJD 561 95 to 562 40 is a good indicator that the jet is approximately orientated in the north-north-east direction. This, however, is impossible to confirm without high spatial resolution imaging, which is made difficult towards the Galactic Centre by angular broadening at low radio frequencies. The variable EVPA at the onset of the outburst may not, and likely does not, indicate changes of the jet orientation, which we assume is relatively stable at the core. Variable EVPAs, or ‘rotator events’, have previously been observed in the LMXBs GRO J1655−40 (Hannikainen et al. 2000) and GRS 1915+105 (Fender et al. 2002) and in a number of AGN (see Saikia & Salter 1988, and references therein) but are not thought to indicate a physical rotation of the jet. Instead, they are thought to be caused by changes in the magnetic field or shock conditions – which, as demonstrated by the variability of the RM, is clearly applicable here – or possibly by a twisted or helical magnetic field (e.g. Gómez et al. 2008; Marscher et al. 2008).
The EVPA of the optically thin ejecta is expected to be aligned perpendicular to the magnetic field (e.g. Ginzburg & Syrovatskii 1969; Longair 1994). In the simplest geometry, where the dominant magnetic field is due to shock compression (Laing 1980), the field is parallel to the shock front (i.e. perpendicular to the jet axis) and hence the EVPA is parallel to the jet axis, as it was in the self-absorbed case. Thus, the rotation we observe when the jet becomes optically thin is not expected in this basic description. However, the emission from the discrete ejecta may not be described by this simple geometry but by local or large-scale variations of the magnetic field or particle density near the source that may have much more complex structures (Fig. 4). For example, large-scale helical magnetic fields may dominate at large distances from the black hole (e.g. Gómez et al. 2008; Marscher et al. 2008); lateral expansion of the ejecta may produce (via compression) a dominant magnetic field parallel to the bulk motion of the ejecta; the field may be elongated due to velocity shear (Aloy et al. 2000); knots or hotspots might exist, where the local magnetic field and particle density are compressed or distorted by a bow shock and particles flow along the shock front to illuminate the jet-aligned magnetic field behind the shock (Dreher, Carilli & Perley 1987). These field variations can also explain increases (or decreases, depending on the magnetic field direction) in the measured RM at late times. Such spatially dependent magnetic variations have been directly imaged and resolved by interferometry in both LMXBs (e.g. Miller-Jones et al. 2008) and, more commonly, AGN (e.g. Lister & Homan 2005; Gómez et al. 2008; Homan et al. 2009), but it is not possible to do so for the unresolved jets of Swift J1745−26.
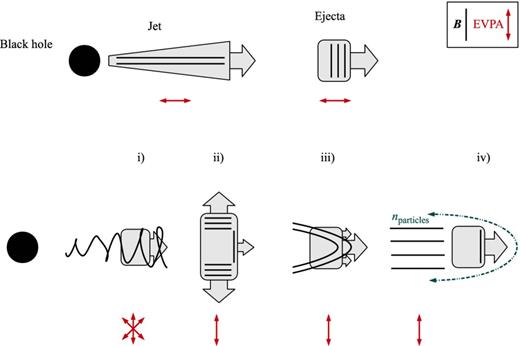
Schematic of the various magnetic field (B) geometries, EVPAs and bulk motions (represented by arrow orientation and size) discussed in Section 3.2. Top: the basic magnetic field geometry along the jet and at the ejecta shock front due to compression. Bottom: four possible geometries due to (i) a helical field, (ii) lateral expansion and compression, (iii) velocity shear and (iv) bow shock. All these may cause a dominant magnetic field orientation, and hence EVPA, that may deviate significantly from that expected in the simplest geometry.
Flare energetics
Assuming a representative black hole mass of 8 M⊙ (Kreidberg et al. 2012), the Eddington luminosity is LEdd ≈ 1.3 × 1038(M/M⊙) erg s−1 = 1 × 1039 erg s−1. The observed soft X-ray (1–10 keV) flux at the time of the flare, FX ≈ 1 × 10⁻⁷ erg cm−2 s−1, corresponds to X-ray luminosities of LX ≈ 4–12 × 1038 erg s−1 for distances of 5–8.5 kpc. This implies that the source is at a significant fraction of the Eddington luminosity (even without a bolometric correction), though it does not seem to have transitioned to the soft state at the time of the discrete ejection event. This is consistent with the hard-to-soft state transition X-ray luminosities inferred by Dunn et al. (2010) that approach LEdd and are an order of magnitude greater than the inferred soft-to-hard state transition luminosities. However, further discussion requires a more detailed X-ray spectral analysis, which is beyond the scope of this work.
Radio–X-ray correlation
We plot the hard-state X-ray–radio luminosity correlation (see Section 1) using representative data from the upper (GX 339−4; Corbel et al. 2013a, assuming, as they do, a distance of 8 kpc; Zdziarski et al. 2004) and lower (H1743−322; Coriat et al. 2011) branches (Fig. 5). For comparison, we calculate the luminosities of Swift J1745−26 over/at the same energies as Corbel et al. (2013a) and Coriat et al. (2011), at various distances (though we only plot 8 kpc for clarity) and only at epochs where X-ray observations occurred within 24 h of the radio observations (the arrow represents the direction of temporal evolution).
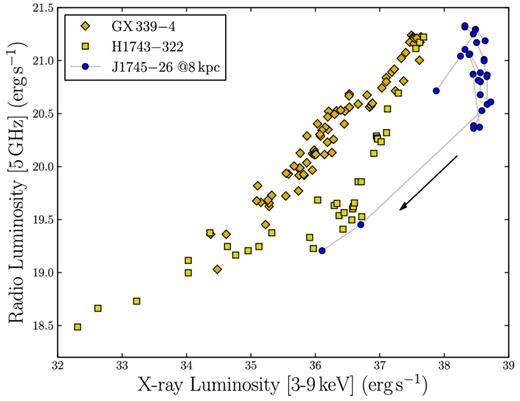
The hard-state X-ray–radio luminosity correlation shows representative data from the upper (GX 339−4; Corbel et al. 2013a) and lower (H1743−322; Coriat et al. 2011) branches, overlaid by our data for Swift J1745−26 at an assumed distance of 8 kpc (the arrow represents the direction of temporal evolution).
The distance to Swift J1745−26 is highly uncertain; based on optical and X-ray fluxes at the peak of outburst, Muñoz-Darias et al. (2013) suggest a, poorly constrained, distance of 1–7 kpc and given the source position, close to the Galactic Centre, it is unlikely to be further than 8.5 kpc. We find that at all these distances, the luminosities of the source fall below the correlation, except for the two late-time points (MJD 563 28 and 563 77) that fall on the lower branch for distances 7–8.5 kpc. By comparison with Fig. 1, these two points are the only points on the correlation that occur when the observed hardness ratio displays a steady, high value (which may indicate that the system is in the canonical hard state). All other points occur as the X-rays are rising to peak and the hardness ratio is softening (MJD 561 87–562 00), or during the intermediate state when the X-rays are softest (MJD 562 00–562 32); the majority of the points on the plot are likely deviant from the correlation because they do not occur during the hard state. The lack of hard-state luminosities makes it difficult to confirm whether the points fall on the hard-state correlation and hence to use the correlation to constrain the distance to Swift J1745−26.
The form of the deviation from the correlation is similar to that observed for GX 339−4, which was interpreted as the jet turning on and off in the intermediate state (Corbel et al. 2013a). While the jet of Swift J1745−26 is never fully quenched, this deviation further confirms that the source was in an intermediate, as opposed to hard state, for the majority of our observations. In this state, the compact jet (the flare is not sampled due to a lack of simultaneous X-ray observations) displayed a high level of light-curve variability suggesting an unstable jet with variable power. Unlike GX 339−4, which shows an X-ray hysteresis between the on/off deviation, we observe no such difference (similar to MAXI J1659−152; van der Horst et al. 2013); this is because GX 339−4 evolved through the stages of the standard hardness intensity diagram (e.g. Homan et al. 2001; Homan & Belloni 2005; Belloni 2010) while, as a failed outburst, Swift J1745−26 did not. Such an interpretation is independent of the distance to the source and consistent with our interpretation of the radio light curves and spectral indices.
CONCLUSION
We obtained multifrequency radio data of the black hole LMXB, Swift J1745−26 from the VLA, ATCA and KAT-7 radio arrays during the failed outburst of 2012–2013. For the majority of the observations, the radio spectral and polarimetric data are consistent with self-absorbed synchrotron emission from a compact jet and, as expected, the X-ray light curves and hardness ratios imply a source in the canonical hard or intermediate state. The radio light curves display a high level of large-scale variability compared to the X-ray emission, and deviations from the standard radio–X-ray correlations, which we interpret as the unstable compact jet's energy decreasing and increasing in the intermediate state (without ever fully quenching). From the measured Stokes polarimetry parameters, we infer the orientation of the unresolved jet as being approximately north-north-east.
For a period the radio data display strong evidence – steep spectral index and a very high level of polarization – for a discrete ejection event. While discrete ejecta are expected in the intermediate state, as the source crosses the ‘jet line’, it is interesting to note that this is the first time that such an event has been observed in a failed outburst where the soft state has not been reached. Though the distance to the source is poorly constrained, for a range of physically realistic distances we find, as expected, that the minimum energy required to launch such a discrete flaring event is a significant proportion of the Eddington luminosity, which suggests a very high level of accretion. Coincident with the discrete ejection event, we observe a rotation of the EVPA inferring a complex and variable magnetic field geometry in the vicinity of the source. Future, multiwavelength analysis of this outburst, particularly at X-ray and optical wavelengths, that can constrain the physical parameters of the accretion disc should allow the state of the system to be accurately determined and hence better describe the relationship between the observed radio jet and the accretion disc.
We thank A. H. Bridle for useful discussions on magnetic field geometries and J. P. Macquart for useful discussions on the estimates of polarization. We also thank T. Hovatta for her assistance with OVRO observations. This work was supported by Australian Research Council grant DP120102393. MC and RPA acknowledge the financial assistance of the National Research Foundation (NRF) through an SKA SA Fellowship. GRS is supported by an NSERC Discovery Grant. SC acknowledges the financial support from the UnivEarthS Labex programme of Sorbonne Paris Cité (ANR-10-LABX-0023 and ANR-11-IDEX-0005-02). DMR acknowledges support from a Marie Curie Intra European Fellowship within the 7th European Community Framework Programme under contract no. IEF 274805. The Australia Telescope Compact Array is part of the Australia Telescope National Facility which is funded by the Commonwealth of Australia for operation as a National Facility managed by CSIRO. The National Radio Astronomy Observatory is a facility of the National Science Foundation operated under cooperative agreement by Associated Universities, Inc. This research has made use of NASA's Astrophysics Data System and the SIMBAD data base, operated at CDS, Strasbourg, France. Swift XRT data were supplied by the UK Swift Science Data Centre at the University of Leicester and Swift BAT transient monitor results were provided by the Swift/BAT team.
All uncertainties in this paper are quoted and/or plotted at the 1σ confidence level.
REFERENCES
SUPPORTING INFORMATION
Additional Supporting Information may be found in the online version of this article:
Table 2. Sample radio flux densities of source, Fν, at frequency, ν, and Stokes Q and U flux densities at that frequency (all given before systematic errors are added) (Supplementary Data).
Please note: Oxford University Press are not responsible for the content or functionality of any supporting materials supplied by the authors. Any queries (other than missing material) should be directed to the corresponding author for the article.
