


Abstract
Polarization measurements of the microquasar Cygnus X–1 exist at γ-ray, X-ray, ultraviolet, optical and radio frequencies. The γ-ray emission has been shown to be highly linearly polarized. Here, we present new infrared polarimetric data of Cygnus X–1 taken with the 10.4 m Gran Telescopio Canarias and the 4.2 m William Herschel Telescope. We show that the broad-band, radio-to-γ-ray flux spectrum and polarization spectrum in the hard state are largely consistent with a simple phenomenological model of a strongly polarized synchrotron jet, an unpolarized Comptonized corona and a moderately polarized interstellar dust component. In this model, the origin of the γ-ray, X-ray and some of the infrared polarization is the optically thin synchrotron power law from the inner regions of the jet. The model requires the magnetic field in this region to be highly ordered and perpendicular to the axis of the resolved radio jet. This differs from studies of some other X-ray binaries, in which the magnetic field is turbulent, variable and aligned with the jet axis. The model is able to explain the approximate polarization strength and position angle at all wavelengths including the detected X-ray (3–5 keV) polarization, except the observed position angle of the γ-ray polarization, which differs from the model by ∼60°. Past numerical modelling has shown that a curved synchrotron spectrum can produce a shift in position angle by ∼60°, which may account for this.
INTRODUCTION
X-ray binaries are binary systems in which a compact object, a black hole (BH) or a neutron star, accretes matter from a companion star. The polarization properties of emission from black hole X-ray binaries (BHXBs) have been well studied at radio frequencies (see Fender 2006 for a review), and have recently been given some attention at optical and infrared (IR) frequencies. In the optical regime, polarization due to the scattering of intrinsically unpolarized thermal emission can be modulated on the orbital period, which places constraints on the physical and geometrical properties of the system (Dolan & Tapia 1989; Gliozzi et al. 1998). At radio, and in some cases at optical/IR frequencies, variable polarization can be due to synchrotron emission from the jets launched via the process of accretion on to the BH or neutron star in X-ray binaries (Hannikainen et al. 2000; Brocksopp et al. 2007; Russell & Fender 2008; Shahbaz et al. 2008; Russell et al. 2011b).
More than 30 years ago, a few measurements of polarization from X-ray binaries were made at X-ray energies using the Bragg crystal polarimeters aboard the OSO 8 satellite. The linear polarization of the high-mass X-ray binary (HMXB) and microquasar, Cygnus X–1, was measured to be 2–5 per cent at 2.5–5.2 keV (the confidence level was 3.9σ at 2.6 keV; Long, Chanan & Novick 1980). Since then, no X-ray detector has had the capabilities to measure the polarization properties of X-ray binaries more accurately. More recently, the INTEGRAL satellite has been used, using novel techniques, to estimate the polarization of the Crab (Dean et al. 2008), Cygnus X–1 (Laurent et al. 2011; Jourdain et al. 2012) and some γ-ray bursts (Götz et al. 2009, 2013) at hard X-ray–γ-ray energies. The γ-ray polarization of Cyg X–1 was found to be very high, 67 ± 30 per cent at 0.4–2 MeV using the Imager on Board the INTEGRAL Satellite instrument on board INTEGRAL (Laurent et al. 2011), later confirmed using the Spectrometer on INTEGRAL instrument, 76 ± 15 per cent at 0.23–0.85 MeV (Jourdain et al. 2012). The only viable mechanism for producing such high polarization at these energies is optically thin synchrotron emission, and it was claimed that the high-energy electrons in the jet are the origin of the polarization (Laurent et al. 2011; Jourdain et al. 2012). Detailed spectral modelling of the keV–MeV (e.g. McConnell et al. 2002; Zdziarski, Lubiński & Sikora 2012; Del Santo et al. 2013) and keV–GeV (Malyshev, Zdziarski & Chernyakova 2013; Zdziarski, Pjanka & Sikora 2013) emission of Cyg X–1 has confirmed the presence of an MeV tail in the hard state, which could either be due to hybrid Comptonization or due to a synchrotron component. Here we adopt the state classifications of Belloni (2010). If the high levels of polarization at 0.2–2 MeV are robust, synchrotron is the favoured mechanism, and jet models are consistent with the MeV tail being the high-energy extension of the optically thin synchrotron power law extending from IR wavelengths (Rahoui et al. 2011; Zdziarski et al. 2012, 2013; Malyshev et al. 2013). Alternatively, it has been suggested that a hot accretion flow could also produce synchrotron emission that is highly polarized at MeV energies; this requires one-dimensional motion of electrons along highly ordered magnetic field lines in the inner regions of the hot flow (Veledina, Poutanen & Vurm 2013). In this case, a small region of the hot flow accreting from a preferential direction would presumably have to dominate the MeV emission, because the field lines threading the flow from all parts of the inner accretion disc would have different orientations.
Optically thin synchrotron emission is intrinsically polarized. If the local magnetic field in the emitting region is uniform (ordered), a net linear polarization is observed. If the field is tangled, the differing angles of the polarized light suppress the observed, average polarization. The maximum polarization strength is ∼70–80 per cent, in the case of a perfectly ordered field (e.g. Rybicki & Lightman 1979; Björnsson & Blumenthal 1982) and is dependent only on the degree of ordering of the field and the energy distribution of the electron population (see also Section 3). When the radio emission of BHXBs is consistent with optically thin synchrotron (this typically occurs during X-ray state transitions), this polarization signature is commonly detected at relatively high levels, ∼10–30 per cent (e.g. Hannikainen et al. 2000; Fender et al. 2002; Brocksopp et al. 2007; Miller-Jones et al. 2008; Roberts et al. 2008; Curran et al. 2013), and the emission here is from discrete jet ejections or interactions with the interstellar medium (ISM) and is often resolved in radio images. The position angle (PA) of polarization in these ejections is often (but not always) approximately parallel to the axis of the resolved radio jet, implying that the electric field is parallel to the jet axis and the magnetic field is orthogonal to the jet axis. This may be due to the compression of tangled magnetic field lines in shocks downstream in the flow or collisions with dense regions of the ISM, resulting in a partially ordered transverse field.
Compact, conical jets are known to produce a flat or slightly inverted spectrum from radio to IR frequencies in BHXBs (0 ≤ αthick ≤ +0.5, where Fν ∝ να; Fender et al. 2000, 2001; Corbel & Fender 2002; Gallo et al. 2007; Migliari et al. 2007; Gandhi et al. 2011; Rahoui et al. 2011; Russell et al. 2013c). These continuously launched jets are different from the discrete ejections; their spectra are composed of overlapping, self-absorbed (optically thick) synchrotron components originating from distributions of electrons with various energies propagating down the jet, much like those of active galactic nuclei (AGN; Blandford & Konigl 1979; Kaiser 2006). In BHXBs these compact jets are produced when the source is in the hard X-ray state (e.g. Gallo, Fender & Pooley 2003). Linear polarization has been detected from this optically thick flat spectrum at a level of a few per cent at radio frequencies in a few BHXBs (e.g. Gallo et al. 2004; Brocksopp et al. 2013). At some frequency, generally considered to lie in the IR regime, this synchrotron spectrum breaks to one which is optically thin, with −1 ≤ αthin ≤ −0.4. The power-law spectrum of the optically thin emission has been identified and isolated in several BHXBs in the IR/optical (e.g. Hynes et al. 2003, 2006; Homan et al. 2005; Kalemci et al. 2005; Chaty, Dubus & Raichoor 2011) and the break itself has been detected in a few BHXBs in the mid-IR (Corbel & Fender 2002; Gandhi et al. 2011; Rahoui et al. 2011; Russell et al. 2013a).
To date, few studies have attempted to uncover the polarimetric signature of the optically thin synchrotron emission from compact jets that exist in the hard state in BHXBs. This emission originates close to the base of the jet, in a region likely associated with the start of the particle acceleration in the jet (e.g. Polko, Meier & Markoff 2010). The polarization seen from this region could have a higher level of ordering compared to further out in the jet, since the field may maintain a high level of ordering over the smaller emission region (Blandford & Konigl 1979). Polarimetric measurements of the optically thin power law therefore provide a powerful tool to uncover the nature of the magnetic field structure in this region, which is important for models and simulations of jet production. In the optical/IR regime of X-ray binaries, other components such as the accretion disc and companion star often dominate, suppressing any synchrotron contribution to the polarization, but when the synchrotron makes a strong contribution, intrinsic polarization has been detected (e.g. Dubus & Chaty 2006; Russell & Fender 2008; Shahbaz et al. 2008; Chaty et al. 2011; Russell et al. 2011b). The fractional linear polarization (FLP) is of the order of ∼1–10 per cent, with evidence for rapid variations in some sources on time-scales of seconds to minutes. The PA is usually approximately orthogonal to the axis of the resolved radio jet when this angle is known, which implies that the magnetic field is parallel to the jet axis. The observations to date are consistent with a variable, predominantly tangled magnetic field geometry, with field lines preferentially orientated along the jet axis.
Here, we present new, high-precision NIR polarization measurements of Cyg X–1, a persistently active X-ray binary that is known to launch a powerful jet (Gallo et al. 2005; Russell et al. 2007). We gather archival flux spectral energy distributions (SEDs) and all polarization measurements of the source published to date, and attempt to model the multiwavelength flux spectrum, FLP spectrum and PA spectrum self-consistently. Section 2 describes the data collection and treatment, and the model and results are presented in Section 3. A discussion is provided in Section 4, including predictions for future X-ray polarization detections of X-ray binaries. The conclusions are summarized in Section 5.
DATA COLLECTION
Mid-IR polarization observations with the Gran Telescopio Canarias
CanariCam polarimetric observations of Cyg X–1 were taken during 2013 August and October with the Gran Telescopio Canarias (GTC) on La Palma. We used the Wollaston prism, half-wave retarder (half-wave plate, HWP) and the Silicate filter Si-4 centred at 10.3 μm (bandwidth 0.9 μm) to obtain dual-beam linear polarimetry of our targets. We observed Cyg X–1 for a total of 131 min with a chop angle of 90°, chop throw of 8 arcsec, nod angle = −90° and nod throw of 8 arcsec. To measure the instrumental polarization, an unpolarized standard star HD 184827 was observed. We also observed the polarized star MWC 349 in order to determine the PA offset. These calibration observations were taken every time Cyg X–1 was observed. The amount of precipitable water vapour (PWV) in the atmosphere in terms of millimetres was measured by the IAC real-time PWV monitor during each observation. The October observations were taken under much better PWV conditions compared to the August observations (see Table 1 for a log of observations).
Log of GTC observations. All observations are at 10.3 μm (Si-4 filter).
| Target | ut date start | Exp. time | PWVa | Nature |
|---|---|---|---|---|
| HD 184827 | 2013-08-06 02:18 | 73 s | 12.8 | Zero pol. |
| Cyg X–1 | 2013-08-06 02:54 | 3 × 3 × 291 s | 13.1 | OB # 1 |
| MWC 349 | 2013-08-06 04:06 | 73 s | 12.0 | Polarized |
| HD 184827 | 2013-10-04 23:55 | 73 s | 4.2 | Zero pol. |
| Cyg X–1 | 2013-10-05 00:19 | 3 × 3 × 291 s | 5.2 | OB # 2 |
| MWC 349 | 2013-10-05 01:32 | 73 s | 6.8 | Polarized |
| Cyg X–1 | 2013-10-05 22:53 | 3 × 3 × 291 s | 6.1 | OB # 3 |
| HD 184827 | 2013-10-06 00:11 | 73 s | 4.6 | Zero pol. |
| MWC 349 | 2013-10-06 00:37 | 73 s | 6.4 | Polarized |
aPWV is the precipitable water vapour (mm).
In polarimetry mode, the HWP rotates automatically between the four PAs, 0°, 45°, 22| $_{.}^{\circ}$|5 and 67| $_{.}^{\circ}$|5. The rotation of the HWP is synchronized with the chopping and nodding so that the final raw image cube contains several extensions, each corresponding to a wave plate angle. The Stokes parameters for a source are determined from a combination of the ordinary and extraordinary images for each value of the HWP angle. The data were reduced using an automated set of pyraf scripts specifically created to measure the polarization of point sources, provided by the GTC science operations team. pyraf is a language for running iraf1 tasks that is based on the python scripting language (Greenfield & White 2000). Aperture photometry was performed on the target and calibration stars using a fixed aperture of radius 5 pixels. The Stokes parameters were determined using the formulae described in Tinbergen (2005). The results of these scripts were cross-checked with starlink2 package polpack, which was producing the same results within the errors.
The instrumental Stokes q and u values determined using the non-polarized star were subtracted from the individual Cyg X–1 q and u values on each date. These corrected values from the three dates were then combined to give q = 0.0039 ± 0.0284 and u = −0.0072 ± 0.0249 which equate to a polarization of FLP = 0.82 ± 2.57 per cent and a PA of 149° ± 96° (see Table 2 for polarization results). The 3σ upper limit is FLP < 8.53 per cent.
Cyg X–1 GTC polarization measurements.
| OB | Stokes q | Stokes u | Flux (Jy) |
|---|---|---|---|
| # 1 | 0.0101 ± 0.0258 | −0.0126 ± 0.0276 | 1.073a |
| # 2 | 0.0203 ± 0.0723 | −0.0093 ± 0.0601 | 0.34 |
| # 3 | −0.0186 ± 0.0367 | 0.0002 ± 0.0350 | 0.33 |
| Average | 0.0039 ± 0.0284 | −0.0072 ± 0.0249 |
| OB | Stokes q | Stokes u | Flux (Jy) |
|---|---|---|---|
| # 1 | 0.0101 ± 0.0258 | −0.0126 ± 0.0276 | 1.073a |
| # 2 | 0.0203 ± 0.0723 | −0.0093 ± 0.0601 | 0.34 |
| # 3 | −0.0186 ± 0.0367 | 0.0002 ± 0.0350 | 0.33 |
| Average | 0.0039 ± 0.0284 | −0.0072 ± 0.0249 |
aThis flux is likely to be inaccurate due to the worse PWV value on this date.
Log of WHT observations. All observations are of Cyg X–1.
| Date | ut start–end | Airmass | Filters | Modea |
|---|---|---|---|---|
| 2010-06-18 | 03:51–04:24 | ≤1.03 | J, H, KS | ROT |
| 2013-09-13 | 02:35–04:10 | 2.1–5.0 | J, H, KS | HWP |
| 2013-09-15 | 02:28–03:05 | 2.1–2.7 | Z | HWP |
| Date | ut start–end | Airmass | Filters | Modea |
|---|---|---|---|---|
| 2010-06-18 | 03:51–04:24 | ≤1.03 | J, H, KS | ROT |
| 2013-09-13 | 02:35–04:10 | 2.1–5.0 | J, H, KS | HWP |
| 2013-09-15 | 02:28–03:05 | 2.1–2.7 | Z | HWP |
aROT is the method of rotating the camera by 90°; HWP is the method of using the LIRIS half-wave plate.
For the three observations of Cyg X–1, we measured the total intensity ratio with respect to the mid-IR standard star HD184827 (Cohen et al. 1992). The flux density in the Si-4 filter (10.3 μm) of the standard is 10.925 Jy, and the flux densities of Cyg X–1 were 1.073, 0.34 and 0.33 Jy for the three observing blocks (OBs) #1, #2 and #3, respectively. The flux density is very similar for OBs #2 and #3, but differs by a factor of 3 for OB #1, which is very likely due to the much worse PWV on this date (see Table 1). We therefore discard this flux density value from the following analysis.
NIR polarization observations with the William Herschel Telescope
We observed Cyg X–1 with the Long-slit Intermediate Resolution Infrared Spectrograph (LIRIS) in imaging polarimetry mode on the 4.2 m William Herschel Telescope (WHT) at the Observatorio del Roque de los Muchachos, La Palma, Spain. The data were taken on 2010 June 18, 2013 September 13 and 15 (see Table 3 for the log of observations). Conditions were good on all dates, with some thin cirrus only on 2013 September 13. In 2010 the airmass was excellent, ≤1.03, and in 2013 the airmass varied between 2.1 and 5.0. Exposures were made in a five-point dither pattern, separately in Z, J, H and KS filters, and a neutral density filter was used due to the high brightness of the source. The Wollaston prism splits the incoming light into four simultaneous images, one at each of the four polarization angles: 0°, 45°, 90° and 135°. For the 2010 observations, half of the observations were made with the telescope rotator at 0° and half at 90°, in order to correct for the relative transmission factors of the ordinary and extraordinary rays for each Wollaston (see Alves et al. 2011; Zapatero Osorio et al. 2011). In 2013, we made use of the new, achromatic HWP recently available on LIRIS. The use of the HWP ensures that camera rotation is no longer necessary, and saves observing time since camera rotation significantly increases overheads.
The data reduction was performed using the lirisdr package developed by the LIRIS team in the iraf environment (for details, see Alves et al. 2011). Aperture photometry was then performed on the resulting combined images, and the normalized Stokes parameters q and u, and FLP and PA were measured using equations 11–13 in Alves et al. (2011) for the 2010 data. Errors on FLP and PA were computed using a Monte Carlo routine that propagates the errors associated with the raw counts at each polarization angle. For the 2013 data, equations presented in Pereyra & Acosta-Pulido (in preparation) that apply to HWP data were adopted (almost identical equations, except for sign changes in q and u). The instrumental polarization is known to be very small for LIRIS, <0.1 per cent (Alves et al. 2011). However, in J and H bands, in which the FLP agrees very well with that expected from interstellar dust in the 2010 data (see Section 3.3), we found that the measured PA was offset from the known optical PA of polarization due to interstellar dust by (3| $_{.}^{\circ}$|19 ± 0| $_{.}^{\circ}$|73) for the 2010 data. The most likely cause of this discrepancy is a small error due to the telescope rotator not having an orientation at exactly 0° and 90°, but instead being systematically offset by a few degrees. We therefore apply a systematic correction of +(3| $_{.}^{\circ}$|19 ± 0| $_{.}^{\circ}$|73) to the measured PA values in J, H and KS bands for the 2010 data.
The values of PA in 2013 differed from the optical dust PA by up to 7° ± 2°. Pereyra & Acosta-Pulido (in preparation) found that the PA of the polarized standard stars differed from their known optical PA values by up to ∼5° (see their tables 1 and 2), which could be due to the angle of the HWP being offset from the camera angle by this small amount. We therefore add ±5| $_{.}^{\circ}$|0 to the errors of PA for the 2013 data in which the HWP was used. For the 2013 data set, we were also able to measure the FLP of two field stars. This was not possible in 2010 since the camera rotation results in a small, 1 arcmin × 1 arcmin field being observed at both rotation angles, whereas the HWP does not rotate the camera and so FLP can be measured in the full 4 arcmin × 1 arcmin field. We measured the polarization of two field stars and found them to be polarized, with FLP values a factor of 1.06–1.40 greater than Cyg X–1 in all four filters. The PA of the polarization of the two field stars agreed to within 7° ± 4° of the optical interstellar value for Cyg X–1, indicating that the field stars are also polarized due to interstellar dust in the same direction as Cyg X–1. The field stars are fainter, and their polarization errors are larger, than those of Cyg X–1, and the exact optical PA due to dust may differ from star to star.
Using field stars from the Two Micron All Sky Survey (2MASS; Skrutskie et al. 2006), we measure magnitudes of J = 6.909 ± 0.036, H = 6.699 ± 0.018 and KS = 6.572 ± 0.023 for Cyg X–1 in 2010, which are on average just 0.05 mag fainter than the 2MASS listed magnitudes for the X-ray binary. In 2013, the magnitudes were J = 6.975 ± 0.029, H = 6.734 ± 0.019 and KS = 6.617 ± 0.017 (we were unable to flux calibrate the Z-band data since they are not included in 2MASS), an average of 0.10 mag fainter than the 2MASS magnitudes. Light curves were also produced from each of the individual exposures in 2010 when the conditions were more favourable, and we found that the source is intrinsically variable on short time-scales in the IR. We measured the fractional rms to be 4.6 per cent in J, 4.3 per cent in H and 4.9 per cent in KS band. The time resolution differed between the filters, so we binned the data such that the time resolution is 16 s in all filters, obtaining rms values of 3.2 ± 1.4 per cent in J, 4.3 ± 0.6 per cent in H and 1.5 ± 0.4 per cent in KS band (variability was detected at the 2.4σ, 6.9σ and 3.6σ confidence levels in the three filters, respectively).
Multiwavelength data collection
Cyg X–1 is bright, persistent and has been studied extensively for decades. As such, it boasts one of the most well sampled multiwavelength SEDs of any X-ray binary, spanning ∼16 orders of magnitude in frequency, from the MHz low-frequency radio regime to the GeV high-energy γ-ray regime. Polarimetric measurements have also been made at radio, optical, ultraviolet (UV), X-ray and γ-ray energies. Here, we combine our new mid-IR and NIR data with those previously reported in the literature. Table 4 summarizes the flux measurements of Cyg X–1 collected for this paper, and all polarization measurements of the source are given in Table 5. For many measurements, FLP and its error were calculated by propagating the errors associated with the Stokes parameters q and u. We therefore take into account polarization bias (Wardle & Kronberg 1974) for measurements in which this was not already accounted for. Polarization bias has the effect of increasing the estimated FLP if the errors on q and u are large (usually due to low signal-to-noise ratio, S/N), because FLP is a positive quantity whereas q and u can be positive or negative. The bias-corrected polarization is |${\rm FLP}_{\rm corr} = \sqrt{1-(\Delta {\rm FLP}_{\rm obs} / {\rm FLP}_{\rm obs})^2}$|, where FLPobs and ΔFLPobs are the estimated FLP using the standard formula |${\rm FLP} = \sqrt{q^2 + u^2}$|, and its error by propagating the errors in q and u. The reported measurements of FLP generally have high S/N, and FLPobs − FLPcorr was found to be ≤0.02 per cent for all optical, UV and our new NIR data.
Summary of multiwavelength fluxes collected of Cyg X–1 in the hard state (flux upper limits are not included).
| Waveband | log(ν; Hz) | Reference |
|---|---|---|
| 235–610 MHz | 8.37–8.79 | Pandey et al. (2007) |
| 2.3–221 GHz | 9.36–11.34 | Fender et al. (2000) |
| 5.5–27 μma | 13.05–13.73 | Rahoui et al. (2011)b |
| 5–18 μm | 13.22–13.78 | Mirabel et al. (1996) |
| 2.3–10 μm | 13.48–14.12 | Persi et al. (1980) |
| 1.2–2.2 μm | 14.13–14.39 | Skrutskie et al. (2006) |
| 1.2–2.2 μm | 14.13–14.39 | This paper |
| 0.44–0.55 μm | 14.74–14.83 | Brocksopp et al. (1999) |
| 0.37 μm | 14.91 | Bregman et al. (1973) |
| 0.122–0.56 μma, c | 14.73–15.39 | Caballero-Nieves et al. (2009) |
| 3.5–160 keVa | 17.93–19.59 | Rahoui et al. (2011)b |
| 260–5400 keVa | 19.80–21.12 | Zdziarski et al. (2012) |
| 0.1–10 GeVa | 22.38–24.37 | Malyshev et al. (2013) |
aIncludes spectroscopic data. bData from Spitzer observation 1 as defined in Rahoui et al. (2011) were used, as the source was in the hard state and the jet was present. cThe UV data were taken when the source was in a soft state.
Multiwavelength linear polarization measurements of Cyg X–1.
| Waveband | log(ν; Hz) | MJD | X-ray | FLP (per cent) | FLP (per cent) | PA (°) | PA (°) | Ref. |
|---|---|---|---|---|---|---|---|---|
| state | Observed | Model | Observed | Model | ||||
| 5 GHz | 9.70 | 499 17 | Hard | <10 | 9.9 | – | 69.5 | 1 |
| 10.3 μm (Si-4 band) | 13.46 | 565 10, 565 70 | Soft | <8.53 | 0.00 | – | 136.8 | 2 |
| 2.16 μm (KS band) | 14.14 | 553 65 | Hard | 0.84 ± 0.08 | 0.79 | 142.8 ± 3.0 | 145.8 | 2 |
| 2.16 μm (KS band) | 14.14 | 565 48 | Soft | 0.76 ± 0.07 | 0.51 | 131.5 ± 7.7 | 136.8 | 2 |
| 1.65 μm (H band) | 14.26 | 553 65 | Hard | 0.96 ± 0.06 | 1.23 | 136.1 ± 1.8 | 139.7 | 2 |
| 1.65 μm (H band) | 14.26 | 565 48 | Soft | 1.11 ± 0.07 | 1.10 | 144.0 ± 6.9 | 136.8 | 2 |
| 1.25 μm (J band) | 14.38 | 553 65 | Hard | 1.95 ± 0.07 | 2.07 | 137.5 ± 1.9 | 137.7 | 2 |
| 1.25 μm (J band) | 14.38 | 565 48 | Soft | 2.00 ± 0.07 | 2.00 | 141.0 ± 6.1 | 136.8 | 2 |
| 1.03 μm (Z band) | 14.46 | 565 50 | Soft | 2.72 ± 0.07 | 2.79 | 142.6 ± 5.8 | 136.8 | 2 |
| 0.64 μm (R band) | 14.67 | 470 39–470 44, 473 37–473 43 | Unknown | 4.40 ± 0.08 | 4.55 | 140.8 ± 0.5 | 136.9 | 3 |
| 0.55 μm (V band) | 14.74 | 470 39–470 44, 473 37–473 43 | Unknown | 4.77 ± 0.23 | 4.78 | 141.4 ± 1.4 | 136.9 | 3 |
| 0.44 μm (B band) | 14.83 | 470 39–470 44, 473 37–473 43 | Unknown | 4.70 ± 0.30 | 4.70 | 141.8 ± 1.8 | 136.9 | 3 |
| 0.37 μm (U band) | 14.91 | 423 04–423 16 | Unknown | 4.35 ± 0.16 | 4.27 | 139.7 ± 1.0 | 136.8 | 4 |
| 0.40–0.90 μma | 14.52–14.87 | 539 51, 539 55 | Hard | 3.3–4.8 | 3.4–4.5 | 135.9–137.1 | 137.0 | 5 |
| 2.6 keV | 17.80 | 427 24–434 57b | Hard | 2.44 ± 1.07 | 3.4 | 162 ± 13 | 159.5 | 6 |
| 5.2 keV | 18.10 | 427 24–434 57b | Hard | 5.3 ± 2.5 | 3.5 | 155 ± 14 | 159.5 | 6 |
| 130–230 keV | 19.50–19.75 | 527 97–551 84c | Hard | <20 | 5–11 | – | 159.5 | 7 |
| 230–370 keV | 19.75–19.95 | 527 97–551 84c | Hard | 41 ± 9 | 11–32 | 47 ± 4 | 159.5 | 7 |
| 230–850 keV | 19.75–20.31 | 527 97–551 84c | Hard | 76 ± 15 | 11–72 | 42 ± 3 | 159.5 | 7 |
| 400–2000 keV | 19.99–20.68 | –d | Hardd | 67 ± 30 | 38–80 | 40 ± 10e | 159.5 | 8 |
Notes: In the fifth and seventh columns the errors on the observed FLP and PA are given at the 1σ level (or for the optical photometric data, they represent the standard deviation of the values taken over all orbital phases). For the model values in the sixth and eighth columns, the model for the soft state assumes no jet synchrotron component in the IR. aIncludes spectroscopic data. bThree pointings were used over a 3 yr period; for exact dates see Long et al. (1980). cNine pointings were used over a 6 yr period; for exact dates see table 1 of Jourdain et al. (2012). dThe data were taken between 2003 and 2009 (no exact dates are given). eThe correct value of PA is given in Jourdain et al. (2012). References: (1) Stirling et al. (2001); (2) this paper; (3) Dolan (1992); (4) Nolt et al. (1975); (5) Nagae et al. (2009); (6) Long et al. (1980); (7) Jourdain et al. (2012); (8) Laurent et al. (2011).
Data were collected during periods in which the source was in a hard X-ray state (when this was known), since this is when compact jets are expected to be produced. For all data taken in or after 1996, the X-ray all-sky monitors of the Rossi X-ray Timing Explorer (Bradt, Rothschild & Swank 1993) and the Monitor of All-sky X-ray Image (Matsuoka et al. 2009) were used to classify the X-ray state of Cyg X–1 on each date, using the classification scheme of Grinberg et al. (2013). We find that Cyg X–1 was in the hard state when our NIR data were taken in 2010. However, in 2013, Cyg X–1 resided in the soft state on all dates when our mid-IR and NIR data were acquired. We therefore caution that the compact jet may not make a contribution to the polarization in the 2013 data since the source was not in the hard state. We include UV flux spectra that were taken during a soft state, but since the unvarying companion dominates at these wavelengths (the corona and jet are >2–3 orders of magnitude fainter), we can include these flux measurements in our SED. Absorbed data were de-reddened using the extinction to the source, AV = 2.95 mag (Wu et al. 1982; Rahoui et al. 2011; Xiang et al. 2011), and adopting the IR/optical/UV extinction laws of Cardelli, Clayton & Mathis (1989), Pei (1992) and Chiar & Tielens (2006). Unabsorbed X-ray and mid-IR spectra were taken from Rahoui et al. (2011) (observation 1 as defined by the authors, during which the source was in a hard state), and unabsorbed X-ray and γ-ray data were taken from Zdziarski et al. (2012) and Malyshev et al. (2013).
A TOY MODEL FOR THE MULTIWAVELENGTH FLUX AND POLARIZATION OF | ${\boldsymbol\rm Cyg}$| X–1
The flux spectrum
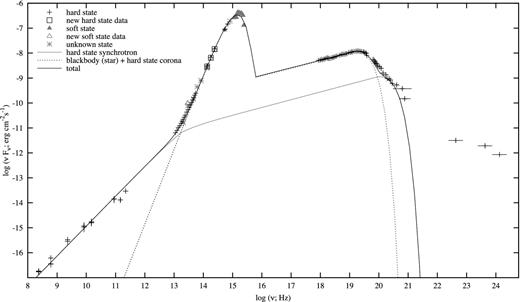
The broad-band, radio-to-γ-ray flux density (Fν) spectrum of Cyg X–1 in the hard state is presented in the upper-left panel of Fig. 1, and the same is presented in Fig. 2 as an SED (νFν). We also show UV and IR soft state data as grey triangles. The supergiant O star dominates the IR/optical/UV emission and can be approximated by a single-temperature blackbody. While the jet produces the flat/inverted optically thick radio synchrotron spectrum, Fender et al. (2000) showed that this spectrum extends to millimetre wavelengths, and Rahoui et al. (2011) found evidence for variable synchrotron emission at mid-IR wavelengths. Broad-band models applied to data of Cyg X–1 (e.g. Markoff, Nowak & Wilms 2005; Nowak et al. 2011; Rahoui et al. 2011; Zdziarski et al. 2012, 2013) typically include a Comptonized corona, which most likely dominates the X-ray flux, and a jet, which dominates the radio–mm regime and may make a significant contribution to the IR, X-ray and γ-ray flux.
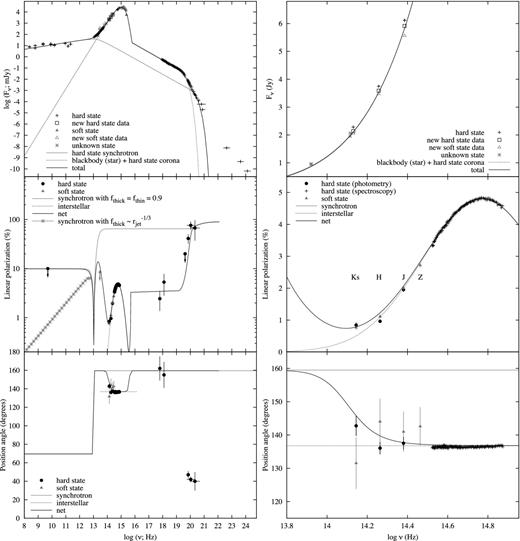
Left: radio-to-γ-ray flux density spectrum (Fν; upper panels), FLP spectrum (centre panels) and polarization PA (lower panels) of Cyg X–1. Right: the same as the left-hand panels but just the NIR–optical region, showing how the interstellar model approximates the IR–optical data (see also Nagae et al. 2009), except in the KS band most evidently in the hard state. See Tables 4 and 5 for data references and Table 6 for our model parameters.
Here, we adopt a simple toy model of a synchrotron jet, a blackbody from the companion star, and a Comptonized corona approximated by a power law with an exponential cutoff. The aim is to approximately reproduce the observed spectrum phenomenologically, in order to use this as an input spectrum for the polarization model described below. The jet consists of a broken power law describing the optically thick and optically thin regions of the synchrotron spectrum, with some curvature at the frequency of the spectral break, νb (e.g. Blandford & Konigl 1979). Rahoui et al. (2011) performed spectral modelling of broad-band SEDs of Cyg X–1 which included mid-IR Spitzer spectra, and their fits favoured a break in the jet spectrum at νb ∼ 3 × 10¹³ Hz, with the optically thin power law extending to higher frequencies. In order to explain the high-energy tail in the γ-ray spectrum and the high level of polarization, it was claimed that this optically thin synchrotron power law extends to the γ-ray regime (e.g. Laurent et al. 2011; Rahoui et al. 2011; Jourdain et al. 2012). This has recently been tested by applying jet models to the broad-band SED of Cyg X–1 in the hard state (Zdziarski et al. 2012, 2013; Malyshev et al. 2013), including constraints from new γ-ray detections at GeV energies by Fermi (both the average hard state flux and flares have been detected; Bodaghee et al. 2013; Malyshev et al. 2013). The flux spectrum is consistent with the optically thin synchrotron power law from the jet to extend to γ-ray energies and account for the MeV tail with a cutoff in that regime, and this is the preferred interpretation if the high-polarization measurements are robust (Zdziarski et al. 2012, 2013; Malyshev et al. 2013).
These results have direct implications for the expected polarization as a function of frequency in the SED of Cyg X–1, since the polarization properties of optically thin synchrotron emission are well understood, allowing us to use polarimetry to test these models. Below we compare the observed broad-band polarization properties of Cyg X–1 with that expected from a synchrotron jet, the spectrum of which (and its contribution to the total flux) is defined here by the model approximating the flux spectrum.
Initially, we adopted the best-fitting model parameters reported by Rahoui et al. (2011) in order to explain the jet spectrum. We find that the model can approximately reproduce the radio–mm data [we include significantly more data covering a larger frequency range compared to Rahoui et al. (2011) but our data are not quasi-simultaneous]; the scatter in the data reflect the variability seen of a factor of a few in flux in the hard state due to the data not being simultaneous. However, the model underpredicts the mid-IR flux at ∼1013 Hz. Rahoui et al. (2011) account for this by including an additional power law, which is claimed to be bremsstrahlung from the stellar wind of the companion. We adopt a more inverted optically thick spectral index (αthick = 0.2) and find that a bremsstrahlung component is no longer required. The radio-to-UV data and the high-energy tail can be approximated by the jet component and the blackbody from the companion. Although the radio-to-mm SED of Cyg X–1 was shown to be approximately flat (Fender et al. 2000), the average radio spectral index that included contemporaneous low-frequency radio data was found to be αthick = 0.26 ± 0.10 (at 0.6–15 GHz; Pandey et al. 2007). We therefore favour a model without a bremsstrahlung component and with an inverted optically thick jet spectrum. Our model is presented in the upper panels of Fig. 1.
We see from Fig. 1 that as expected, the jet dominates the hard state radio–mm–mid-IR spectrum, the companion becomes the brightest emitter in the mid-IR–NIR–optical–UV regime, the corona dominates the X-ray flux and the jet spectrum accounts for the γ-ray MeV tail (at ν ∼ 1020 Hz; see also Malzac, Belmont & Fabian 2009; Laurent et al. 2011; Rahoui et al. 2011; Jourdain et al. 2012). It has been demonstrated that synchrotron self-Compton (SSC) emission and/or Compton upscattering of blackbody stellar emission can account for the GeV (ν ∼ 1022–1024 Hz) flux in the hard state (Malyshev et al. 2013; Zdziarski et al. 2013). Since no GeV polarization measurements have been made, and the GeV-emitting component does not seem to dominate at energies lower than the GeV regime, we have no need to include an extra component in our model at GeV energies.
The polarization spectrum
The above equations are used to predict the FLP of the jet spectrum. At IR/optical/UV frequencies, the companion star dominates which, by definition for a blackbody, is expected to be unpolarized. The observed FLP will therefore drop at IR and higher frequencies as the synchrotron contribution to the total flux decreases with increasing frequency. However, optical FLP values of 3–5 per cent are well documented in the literature for Cyg X–1, and almost all of this FLP has an interstellar dust origin. A small fraction of optical FLP has been found to be due to scattering in the stellar wind of the companion and varies on the orbital period, and an additional long-term (decades) variation which may be caused by scattering by a varying asymmetric stellar wind or other circumstellar matter (for a detailed study, see Nagae et al. 2009). We adopt the interstellar dust polarization model of Serkowski, Mathewson & Ford (1975), which has been fitted to optical spectra of Cyg X–1 by Nagae et al. (2009), and we use the parameters measured by Nagae et al. (2009). The detail of the model and data in the optical–IR region of the spectrum can be seen in the right-hand panels of Fig. 1.
Photons from the Comptonized corona may be emitted isotropically, and if no relativistic, beaming or bulk motion effects are present, then one may expect a very low net polarization for the corona. Comptonization of disc photons is expected to be low (Schnittman & Krolik 2009; Maitra & Paul 2011) since the disc photons have a low net polarization (even when taking relativistic effects into account, the peak FLP is predicted to be 1–5 per cent; e.g. Dexter & Quataert 2012). Relativistic reflection on the disc surface could produce up to ∼10 per cent observed X-ray polarization depending on the height of the primary source and the viewing angle (e.g. Dovc̆diak et al. 2011; Goosmann & Matt 2011; Marin et al. 2013). Compton scattering of unpolarized disc photons by a relativistic jet can produce FLP ∼ 3–20 per cent depending on the viewing angle (McNamara, Kuncic & Wu 2009). In the commonly used Comptonized corona model, the seed photons are from the disc (but some may also be from the jet), so the corona is expected to be not much more than 5 per cent polarized (see also Poutanen 1994; Schnittman & Krolik 2010; Veledina et al. 2013). In our toy model, we assume zero polarization for this component, FLPcomp = 0.
SSC emission can be polarized by up to ∼30–50 per cent of the original synchrotron source polarization, for Lorentz factors of 2–10 (likely typical for BHXBs) (Celotti & Matt 1994; Poutanen 1994; McNamara et al. 2009; Krawczynski 2012). For a maximum synchrotron polarization of ∼82 per cent, the maximum FLP of the SSC component is ∼25–41 per cent, which is significantly lower than the highest γ-ray FLP of 76 ± 15 per cent detected from Cyg X–1. Unlike synchrotron emission, FLP of SSC emission is dependent on frequency and viewing angle. Broad-band models predict a more curved spectrum for the SSC component (e.g. Markoff et al. 2005; Nowak et al. 2011), and recent works favour this component to peak in the GeV regime (Malyshev et al. 2013; Zdziarski et al. 2013). For a recent discussion on the different sources of X-ray polarization in BHXBs, see Schnittman et al. (2013).
Chosen model parameters
The resulting FLP spectrum and PA spectrum are shown in the centre and lower panels of Fig. 1, respectively. We adopt the values f = 0.9 and PAthin = 159| $_{.}^{\circ}$|5 (which is the mean PA of the radio jet on the plane of the sky; Stirling et al. 2001). By choosing these values, the observed FLP and PA at all frequencies can be recovered by the model, with one exception: the PA of the γ-ray polarization differs from that of the model by ∼60°. The high value of f is required in order to produce a synchrotron spectrum that can account for the very high γ-ray FLP. We find that by adopting this value of f, the expected lower FLP in X-ray is also consistent with the model, since the (assumed to be unpolarized) corona dominates the X-ray flux, with the synchrotron power law contributing ∼5 per cent of the flux. In the case of a constant value of f along the length of the jet (β = 0), the model predicts that the FLP in radio is ∼10 per cent, which is just consistent with the observed upper limit (Stirling et al. 2001). However, if the magnetic field becomes less ordered with distance along the jet such that |$f \propto r_{\rm jet}^{-1/3}$| (β = 1/3), the predicted radio polarization is <1 per cent. For many BHXBs, the flat spectrum radio emission is polarized at a level of a few per cent (e.g. Gallo et al. 2004; Brocksopp et al. 2013), so for Cyg X–1 the likely value of β is between 0 and 1/3.
The optical and NIR FLP in the hard state can be well described by the model; we find that the J- and H-band data fit very well on the extrapolation of the interstellar dust model, but the FLP is slightly higher than expected from the dust model in the lowest frequency filter, KS band (see Fig. 1, right-hand panels). The model predicts an upturn in the FLP at frequencies lower than ∼KS band, whereby the highly polarized jet synchrotron emission starts to make a stronger contribution. At the frequency of the jet spectral break, the FLP is expected to drop to zero and at lower frequencies the FLP becomes that expected for optically thick synchrotron emission. The deviation of the KS-band data from the interstellar model is most prominent in the hard state data from 2010, but the 2013 FLP taken in the soft state also appears to be higher than the interstellar model, possibly implying a synchrotron component present in the soft state. However, the measured mid-IR polarization of FLP = 0.82 ± 2.57 per cent from the 2013 soft state data is significantly lower than what the model predicts for the hard state jet at this frequency. The 3σ upper limit of FLP < 8.53 per cent is still slightly lower than the model prediction of about 11 per cent for the hard state. In addition, the NIR fluxes in 2013 were significantly fainter (by 3.6σ, 4.3σ and 6.8σ confidence levels in J, H and KS) than the 2MASS fluxes, whereas the 2010 fluxes are all consistent with 2MASS within 3σ. This is consistent with a flux drop due to the lack of jet contribution in the soft state. A lower mid-IR flux in the soft state compared to the hard state was also seen by Rahoui et al. (2011).
By adopting the value PAthin = 159| $_{.}^{\circ}$|5, the model is also able to recover the observed X-ray PA. We find that the γ-ray FLP actually requires the X-rays to be polarized on a level of a few per cent, as observed, under the assumption of a synchrotron jet origin. The optical–NIR FLP and PA values are consistent with interstellar dust, but we find that around the NIR KS band, the model predicts a smooth shift in PA between that expected from the optically thin synchrotron jet (PAthin = 159| $_{.}^{\circ}$|5) and that of the interstellar dust component (PAdust = 136| $_{.}^{\circ}$|8). The observed KS-band PA in the hard state is ∼6° higher than the J and H bands, and consistent with this smooth transition. Since the FLP is also higher than that expected from interstellar dust, the results imply that the polarimetric signature of the jet is detected at 2 μm. In the soft state, the PA values have larger errors due to the use of the HWP. In the Z, J and H bands, the PA is consistent with the models both with and without synchrotron. In the KS band, the PA is consistent within 1σ with the interstellar model but not the model with synchrotron included, which suggests that the synchrotron jet does indeed make a contribution in the hard state, but not in the soft state, as expected. The only NIR PA value that is inconsistent with the interstellar value is the KS-band PA in the hard state. It is worth noting that a weak radio jet may exist in the soft state of Cyg X–1 (Rushton et al. 2012) but is much fainter than the hard state jet (the 15 GHz radio flux density in the soft state can be up to two orders of magnitude lower than the average hard state; e.g. Zdziarski et al. 2011). In other BHXBs the soft state jet, if it exists, is hundreds of times fainter in radio than the hard state jet (Coriat et al. 2011; Russell et al. 2011a).
The model is able to reproduce the very high observed γ-ray FLP, and a slight increase in FLP with energy is expected around the high-energy cutoff where the synchrotron spectral index becomes steeper. The model cannot explain the PA of the highly polarized γ-ray emission, which appears to imply a field that is misaligned with the jet axis in the γ-ray-emitting region of the jet. In Section 4.1, we discuss several reasons why this could be the case. The model implies a very ordered and very stable magnetic field near the base of the jet of Cyg X–1. The electric vector is parallel to the known radio jet axis PAjet, so the magnetic field lines are orientated perpendicular to the jet axis. The model parameter values are given in Table 6.
Model parameter values.
| Parameter | Value |
|---|---|
| Synchrotron jet: | |
| νb | 1.3 × 10¹³ Hz (23 μm) |
| νcut | 8 × 10¹⁹ Hz (330 keV) |
| p | 2.38 |
| αthin | −0.69 |
| αthick | +0.20 |
| f | 0.9 |
| PAthin | 159| $_{.}^{\circ}$|5 |
| PAthick | 69| $_{.}^{\circ}$|5 |
| PAjet | 159| $_{.}^{\circ}$|5 |
| O star companion: | |
| T | 1.8 × 10⁴ K |
| Interstellar dust: | |
| FLPdust, max | 4.8 per cent |
| νdust, max | 5.9 × 10¹⁴ Hz (0.5 μm) |
| PAdust | 136| $_{.}^{\circ}$|8 |
| Comptonized corona: | |
| νcompcut | 1.1 × 10¹⁹ Hz (45 keV) |
| αcomp | −0.70 |
| FLPcomp | 0 |
DISCUSSION
The highly ordered magnetic field in the jet of Cyg X–1
The results imply that the magnetic field near the base of the jet of Cyg X–1 is highly ordered, orthogonal to the jet axis and stable over several years, since the INTEGRAL polarization is measured over this time-scale. This is astonishing because in other X-ray binaries and AGN, the magnetic field ordering in this region of the jet is usually found to be much lower. In BHXBs and some neutron star X-ray binaries, the FLP is a few per cent and the magnetic field lines are usually preferentially parallel to the jet axis, with some evidence for variability on short time-scales, even in the cases where synchrotron emission appears to dominate the flux (see Russell et al. 2011b, and references therein). However, only a few systems have been studied to date.
Similar values of FLP are found from optically thin synchrotron emission in the compact jets of AGN. Gigahertz peaked-spectrum sources and compact steep-spectrum sources have jet spectral breaks at radio frequencies, and polarization measurements of the core, optically thin synchrotron emission have been obtained. The polarization is measured to be ∼1–7 per cent in the optically thin regime (for a review, see O'Dea 1998). This suggests a similarly tangled magnetic field in the core jet in both AGN and X-ray binaries (but not Cyg X–1). Blazars are synchrotron-dominated sources in which higher levels of FLP have been measured (tens of per cent and variable) but in these AGN, the flux and polarization are boosted by beaming effects (e.g. Marscher 2006). Knots and interactions downstream in AGN jets can also be highly polarized (e.g. Saikia & Salter 1988; Lister & Homan 2005; Perlman et al. 2006); these are analogous to the tens of per cent radio FLP measured from discrete ejecta detached from the core in X-ray binaries (e.g. Fender et al. 1999; Hannikainen et al. 2000; Brocksopp et al. 2007, 2013). The flat-spectrum (optically thick) radio jets of AGN are weakly polarized (FLP ∼ 1–5 per cent in most cases), similar to the optically thick radio jets of X-ray binaries. The magnetic field lines in flat-spectrum AGN cores do not have a preferential orientation, but span a wide range of PAs relative to the direction the jet is travelling in (Lister & Homan 2005; Helmboldt et al. 2007).
It is unclear why the jet in Cyg X–1 would have a less tangled magnetic field compared to other BHXBs and AGN. The magnetic field strength, which can be estimated from the optically thick–thin spectral break (e.g. Chaty et al. 2011; Gandhi et al. 2011), is actually similar to other BHXBs (Rahoui et al. 2011; Russell et al. 2013a), but nevertheless the field appears to be highly ordered compared to other systems. Cyg X–1 is the first HMXB in which the polarimetric signature of the jet has been measured (intrinsic IR polarization was detected in Cyg X–3, but the jet contribution was uncertain; Jones et al. 1994). Accretion on to the BH in Cyg X–1 is relatively stable due to the stellar wind of the companion and the source always accretes at close to ∼1 per cent of the Eddington luminosity. This is in contrast to most BHXBs, which are transient low-mass X-ray binaries (LMXBs) with much weaker stellar winds. It is possible that the stability of the mass accretion rate in Cyg X–1 has caused the magnetic field structure in the inner jet to reach an equilibrium, whereas the rapidly changing accretion rate in transient BHXBs would not allow this to occur, possibly leading to more chaotic field structures in transient BHXBs.
On large scales, HMXB jets (and the photons they produce) interact with the stellar wind of the companion (e.g. Fermi LAT Collaboration 2009; Tavani et al. 2009; Corbel et al. 2012; Perucho & Bosch-Ramon 2012; Zdziarski et al. 2013), but on the small scales of the inner regions of the jets (considered to be distances ∼100Rg from the BH; where the gravitational radius is Rg = GM/c2) it is less clear why HMXB and LMXB jets would differ. It is worth noting that measurements of the spin of the BH in Cyg X–1 favour a high spin (close to maximally spinning; Gou et al. 2011; Fabian et al. 2012), which may or may not lead to changes in the jet properties (Fender, Gallo & Russell 2010; Narayan & McClintock 2012; Russell, Gallo & Fender 2013b; Steiner, McClintock & Narayan 2013). GRS 1915+105, which is also claimed to have a high BH spin (McClintock et al. 2006; Blum et al. 2009), is not highly polarized at IR wavelengths (Sams, Eckart & Sunyaev 1996; Shahbaz et al. 2008). Whatever the reason is for a more highly ordered field in the jet of Cyg X–1, the result hints at a fundamental difference between the conditions in the inner regions of the jets of HMXBs and LMXBs, and possibly a different jet launching process.
An alternative explanation for the high γ-ray FLP is that the emitting region is much smaller than the IR- and X-ray-emitting regions of the jet, possibly indicating a more highly ordered field on smaller spatial scales in the jet. Although the MeV photons are expected to come from the same distribution of electron energies as the X-ray and IR photons in the synchrotron plasma, the cooling time for γ-ray photons is shorter and so the γ-ray-emitting electrons radiatively lose their energy on shorter time-scales than X-ray-emitting electrons. The γ-ray-emitting regions would therefore be smaller than the X-ray-emitting regions, since the higher energy photons have less time to travel away from their emission sites. Any misalignment in the field orientation between these small regions in the jet will reduce the net polarization measured on large scales, so it is likely that the magnetic field will appear more uniform on small scales, and higher FLP will be produced at γ-ray energies. If this effect is responsible for the high γ-ray FLP, then the net field ordering could be much lower than f = 0.9 and our model could be overestimating the FLP from synchrotron at lower energies than γ-ray. However, if that is the case, then the X-ray and NIR (KS-band) FLP values cannot be explained.
The only parameter that our model cannot reproduce is the γ-ray PA; the observed PA differs by ∼60° from the model prediction. In our simple toy model, the PA is constant for optically thin synchrotron emission (see Björnsson & Blumenthal 1982; Blandford et al. 2002). However, electron distributions with a sharp break or cutoff could produce synchrotron emission with frequency-dependent PA (Nordsieck 1976; Björnsson 1985). In the γ-ray regime, our model favours a curved spectrum, with α decreasing with energy around/above the high-energy cutoff in the synchrotron spectrum. Numerical solutions have shown that the rate of change of PA with frequency can be large, especially for steeper spectra, while FLP may increase by only a factor ≤2 (Björnsson 1985). Since these are numerical and not analytical solutions, we have not included them in our model. Nevertheless, the curved γ-ray spectrum leads to the possibility that a change of PA could be expected. This shift in PA should only occur in the curved region, not in the power law at X-ray-to-IR frequencies. In the numerical results of Björnsson (1985), the PA changes smoothly by up to ∼60° (depending on various parameters) over two orders of magnitude in frequency for a spectrum that curves downwards at higher energies. This may therefore explain the apparent shift of 60° between the X-ray PA and the γ-ray PA, both of which originate in the optically thin synchrotron emission from the jet in our model.
Alternatively, the γ-ray PA could be probing a small region in the jet that has a different field orientation to the larger scale IR- to X-ray-emitting region. The jet in the AGN M87 has been spatially resolved at radio frequencies down to a few Schwarzschild radii from the BH, and the opening angle of the jet is seen to collimate, from ∼60° at ∼15–50Rg to ∼5°–10° at distances three orders of magnitude larger (e.g. Junor, Biretta & Livio 1999; Doeleman et al. 2012). Under the assumption that the jet of Cyg X–1 could also have an opening angle of 60°, if the emission from the jet could be limb brightened in a small region close to the jet base, the γ-ray PA could imply a magnetic field that is parallel to the ridge of the jet. This is illustrated by the schematic in Fig. 3. In this scenario, the magnetic field is orthogonal to the direction of the motion of the jet in the IR- to X-ray-emitting region (as implied by the model) and a small region closer to the BH produces the γ-ray emission in which the PA is changed by 60°. If the opening angle of the jet in the γ-ray-emitting region is 60°, the magnetic field is parallel to the ridge of the jet. This scenario could account for the apparent shift in PA by 60° between the X-ray and γ-ray. However, it is unclear how one small region of the limb-brightened jet would dominate the γ-ray emission. One may expect that if the jet is limb brightened, then emission should be seen from both ‘sides’ of the jet. If the magnetic field is parallel to the ridge of the jet, then an opening angle of 60° would produce an average, integrated magnetic field that is aligned with the jet axis and would produce lower net FLP. This scenario also requires the γ-ray emission to originate in a region of the jet that is closer to the BH than the IR- to X-ray-emitting region. This is not expected since in our model the same distribution of electrons produces the IR-to-γ-ray emission. We therefore favour the previous explanation – the 60° difference in PA between the X-ray and γ-ray is likely to be due to the steepening of the spectrum.
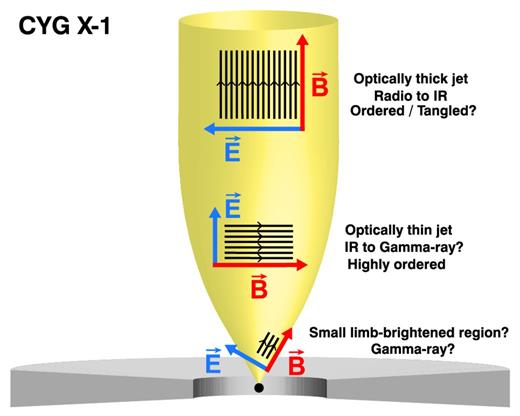
A schematic diagram of the Cyg X–1 jet. This visual illustration assumes (i) a highly ordered magnetic field in the optically thin region near the jet base (as implied by the observations), (ii) an ordered or tangled field in the large-scale jet (this can be tested using radio–mm polarimetry) and (iii) a jet opening angle of 60°, with the highly polarized MeV photons originating in a limb-brightened region with a magnetic field aligned with this angle (but PA rotation due to a steepening spectrum is more likely; see the text).
Evidence for a jet contribution to the X-ray and γ-ray flux
The models here generally assume that the optically thin synchrotron power law from the jet extends to X-ray energies, providing a low but significant contribution to the X-ray luminosity. In Cyg X–1, this power law dominates the γ-ray luminosity. Generally, the origin of the X-ray emission in X-ray binaries is still discussed at length, and the jet contribution is currently a hot topic of debate. When the X-ray spectrum can be described by a soft, thermal blackbody, the origin is usually attributed to the inner, hot regions of the accretion disc (one exception is the neutron star surface; Gilfanov 2010). In the case of BHXBs, this soft thermal component often dominates (the X-ray ‘soft state’) and when it does not, the X-ray spectrum can usually be described by a hard power law (the X-ray ‘hard state’; e.g. Belloni 2010). The inner, hot, possibly radiatively inefficient accretion flow/‘corona’ is generally considered to produce this power law, due to Compton upscattering of soft photons on hot electrons (see Gilfanov 2010 for a review).
Markoff, Falcke & Fender (2001) first proposed that optically thin synchrotron emission from the jet dominates the X-ray flux of the BHXB XTE J1118+480. This was based on broad-band, radio-to-X-ray spectral modelling when the source was accreting at ∼10−3LEdd, where the hard power law at X-ray energies could instead be explained by optically thin jet emission extending from the optical regime. These and similar models taking into account the jet and Comptonization were developed to explain the broad-band SEDs of BHXBs in the hard state, and it was shown that the synchrotron component probably produces some fraction of the X-ray flux in the hard state, but may not dominate (e.g. Markoff et al. 2003, 2005; Migliari et al. 2007; Maitra et al. 2009; Pe'er & Markoff 2012; Zdziarski et al. 2012).
More recently, empirical evidence for the jet producing the hard X-ray power law has been found in the BHXB XTE J1550−564. Here, the jet emission at optical/NIR frequencies was isolated from the emission from the accretion disc and companion star (Russell et al. 2010). This jet component was found to have a spectral index consistent with optically thin synchrotron emission during the fading hard state of its outburst in 2000. The spectral index between X-ray and NIR, the spectral index of the jet component measured at optical/NIR frequencies and the X-ray spectral index itself were all consistent with the same value. The NIR emission from the jet was also found to be linearly proportional to the simultaneous X-ray flux, and the evolution of the broad-band spectrum from optical to X-ray energies could be approximated by one single power law fading by one order of magnitude in flux. Since the optical/NIR optically thin emission originated in the jet (see also Chaty et al. 2011), this implied that the NIR–X-ray power law originated in the optically thin emission from the jet synchrotron spectrum during the fading hard state, at a luminosity of ∼(2 × 10⁻⁴–2 × 10⁻³) LEdd. Initially in the hard state decay, when the jet was brightening and the X-ray luminosity was higher, the X-ray power law must have originated in a different component – most likely Compton upscattering in the corona. Evidence to support this change in the source of the dominating X-ray emission comes from an excess in the X-ray light curve over an exponential decay at the epoch in which the jet would start to dominate, a slight change in the X-ray hardness and an increase in the X-ray rms variability.
A similar, but subtly different result has come from multiwavelength monitoring of the BHXB XTE J1752−223 (Russell et al. 2012). Here, the jet and accretion disc emission at optical/NIR frequencies were isolated during the decay of its 2009–2010 outburst using the same method as Russell et al. (2010). The optical jet emission was found to rise and fade during the fading hard state, in a similar fashion to XTE J1550−564. In the case of XTE J1752−223, the jet was contemporaneous with a clear X-ray flare with the same morphology in the light curve, implying again a common emission mechanism. The NIR–X-ray spectral index was consistent with optically thin synchrotron emission, but the X-ray timing and spectral properties before and during the flare were the same within errors. This implies that either the jet and corona have very similar timing properties (as appears to be the case; Casella et al. 2010) or the X-ray emission was not dominated by the jet. In both scenarios, the X-ray-emitting component must have been well correlated with the jet emission seen at optical/NIR frequencies (Russell et al. 2012).
Some additional works have also shown evidence for two components producing the X-ray power law in the hard state, one of which could be the jet. This was demonstrated for the plateau state of GRS 1915+105 (which is equivalent to the canonical hard state; Rodriguez et al. 2008a,b) and for GX 339–4 and GRO J1655−40 at low luminosities in the hard state (Sobolewska et al. 2011). In H1743−322, a change in the X-ray emission mechanism was also implied by the emission becoming radiatively efficient above a critical X-ray luminosity (Coriat et al. 2011). Finally, two components were fitted to the X-ray-to-γ-ray spectrum of Cyg X–1 (Laurent et al. 2011; Zdziarski et al. 2012, 2013), one which was approximately one order of magnitude (or more) fainter than the other at X-ray energies (see also Figs 1 and 2).
The above evidence suggests that at some stages of a BHXB outburst, the majority of the X-ray flux originates in optically thin synchrotron emission from the compact jets in the system. Since it preferentially occurs at low luminosities (≲10−3LEdd), where count rates are usually too low for accurate spectral fitting, and since it seems to have a similar power-law index and timing properties as the Comptonized corona (see also Casella et al. 2010), this synchrotron component has probably been largely overlooked so far. As has been demonstrated, the polarization properties of the synchrotron and Comptonization X-ray power laws are expected to differ, so differentiating between these two emission mechanisms will be possible with future X-ray polarimeters (see also Pe'er & Markoff 2012). For jet synchrotron emission, X-ray FLP of a few per cent could be detected, with variability in FLP on short time-scales. If a BHXB were found to have a magnetic field as ordered as that of Cyg X–1, and if the synchrotron component dominated the X-ray emission in that source at a certain time, one could expected very high (up to ∼70 per cent), transient X-ray FLP.
X-ray polarization capabilities on board new X-ray satellites have been proposed on numerous occasions, most recently on missions eventually dropped, such as the Gravity and Extreme Magnetism Small Explorer and the New Hard X-ray Mission (GEMS and NHXM; Black et al. 2010; Tagliaferri et al. 2012), but such facilities have yet to be approved and launched. However, promise of new X-ray polarimeters on stratospheric balloons in the near future (e.g. PoGOLite and X-Calibur; Guo et al. 2013; Pearce et al. 2013) may provide the most sensitive polarimetric X-ray measurements of any astrophysical sources to date.
CONCLUSIONS
We have presented new IR polarimetric data of Cyg X–1 using the 10.4 m GTC and the 4.2 m WHT. These measurements have been combined with radio, optical, UV, X-ray and γ-ray flux and polarization data from the hard state. We use a simple phenomenological model to estimate the contribution of the jet, Comptonized corona and stellar companion at all frequencies. We find that our model is able to reproduce the observed flux spectrum, polarization spectrum and PA spectrum in the hard state self-consistently if the jet has a highly ordered magnetic field near its base, and dominates the MeV energies and the IR-to-radio regime. The model requires the magnetic field to be perpendicular to the axis of the resolved radio jet in order to reproduce the observed X-ray and IR PA. Our results imply that the historical X-ray polarization measured in Cyg X–1 (Long et al. 1980) was in fact due to synchrotron emission from the jet, and does not require the Comptonized corona to be polarized even though it dominates the X-ray flux. The magnetic field must be highly ordered and stable over several years in order to explain the detections of highly polarized γ-rays (Laurent et al. 2011; Jourdain et al. 2012). Although interstellar dust is responsible for the majority of the optical and NIR J- and H-band polarization, the KS-band polarization is consistent with a contribution from the optically thin synchrotron power law from the inner regions of the jet, which extends to γ-ray energies. The observed PA of the γ-ray polarization differs from the model by ∼60°. This is most likely due to the break or cutoff in the synchrotron spectrum residing at these energies, and this steepening of the spectrum can be associated with PA shifts of ∼60° according to numerical work.
Our mid-IR and NIR data from the soft state in 2013 do not provide evidence for synchrotron emission in the soft state. Although the KS-band polarization is slightly higher than expected from interstellar dust, the PA is different in the soft state from the hard state (being consistent with the interstellar PA in the soft state), and the mid-IR FLP upper limit in the soft state is lower than the hard state model prediction.
The highly ordered magnetic field in the jet of Cyg X–1 is unprecedented, since other BHXBs and AGN tend to have predominantly tangled fields. However, Cyg X–1 is the first HMXB in which this has been well measured, and could imply a different field geometry in this type of accreting system. Our results could be confirmed and model parameters further constrained with more observations of Cyg X–1. The model predicts the following.
A high level of polarization in the mid-IR in the hard state – above ∼10 per cent at 10–20 μm. We have demonstrated that this is detectable with the mid-IR CanariCam polarimetric instrument on the 10.4 m GTC, but the source was not in the hard state when our data were taken, so similar data acquired in the hard state would be very valuable. If the high, ∼10 per cent FLP is detected at mid-IR frequencies, with the predicted PA of ∼160°, this would be a strong indication that the γ-ray polarization is robust and that the jet of Cyg X–1 indeed has a highly ordered magnetic field.
A shift in the PA by 90° around the frequency of the jet break. The change in FLP is more smooth than this sharp change in PA, so this is a useful prediction that can be tested with polarimetry at frequencies just lower and just higher than the jet break. If the PA shift is this sharp, it could even yield a more accurate jet break frequency than the flux spectrum and FLP can provide.
Radio FLP up to 10 per cent, if the magnetic field remains ordered down the length of the jet. More constraining radio polarimetric observations of Cyg X–1 can test whether the magnetic field structure changes as a function of the distance along the jet.
A steeply increasing FLP at hard X-ray–γ-ray energies, accompanied by a shift in PA by ∼60° to fit the γ-ray polarization measurements of INTEGRAL. Specifically, an increase from FLP ∼4 per cent at 50 keV to ∼50 per cent at 500 keV is inferred from the model. This could be tested with future X-ray polarimeters.
From observations of Cyg X–1 and other BHXBs, we predict that variable X-ray polarization from synchrotron emitting jets could be detected from accreting BHs by future X-ray polarimeters. Variable X-ray FLP of up to 10 per cent could be observed, opening up a new field of study that could be compared to models of jet production. Multiwavelength polarization campaigns could greatly advance our understanding of how accretion in the strong gravitational fields close to BHs can result in the launching of relativistic jets.
We thank José Acosta-Pulido and Antonio Pereyra for help with the LIRIS data reduction pipeline, Carlos Álvarez Iglesias for advice regarding the reduction of CanariCam polarimetric data and Gabriel Pérez Díaz (Servicio MultiMedia, IAC) for the schematic illustration (Fig. 3). We would also like to thank Sera Markoff, Victoria Grinberg, Julien Malzac and Marion Cadolle Bel for conversations on the subject and, in particular, Tom Maccarone for insightful discussions regarding the expected γ-ray emission from Comptonization of synchrotron photons. This work is based on observations made with the Gran Telescopio Canarias (GTC), installed at the Spanish Observatorio del Roque de los Muchachos of the Instituto de Astrofísica de Canarias, on the island of La Palma, and scheduled observations made with the WHT operated on the island of La Palma by the Isaac Newton Group in the Spanish Observatorio del Roque de Los Muchachos. pyraf is a product of the Space Telescope Science Institute, which is operated by AURA for NASA. DMR acknowledges support from a Marie Curie Intra European Fellowship within the 7th European Community Framework Programme under contract no. IEF 274805. DMR and TS acknowledge support from the Spanish Ministry of Science and Innovation (MICINN) under the grant AYA2010-18080.
iraf is distributed by the National Optical Astronomy Observatory, which is operated by the Association of Universities for Research in Astronomy, Inc., under cooperative agreement with the National Science Foundation, available at: http://iraf.noao.edu/.
