


Abstract
The number of known very high energy (VHE) blazars is ∼50, which is very small in comparison to the number of blazars detected in other frequencies. This situation is a handicap for population studies of blazars, which emit about half of their luminosity in the γ-ray domain. Moreover, VHE blazars, if distant, allow for the study of the environment that the high-energy γ-rays traverse in their path towards the Earth, like the extragalactic background light (EBL) and the intergalactic magnetic field (IGMF), and hence they have a special interest for the astrophysics community. We present the first VHE detection of 1ES 0033+595 with a statistical significance of 5.5σ. The VHE emission of this object is constant throughout the MAGIC observations (2009 August and October), and can be parametrized with a power law with an integral flux above 150 GeV of (7.1 ± 1.3) × 10−12 photons cm−2 s−1 and a photon index of (3.8 ± 0.7). We model its spectral energy distribution (SED) as the result of inverse Compton scattering of synchrotron photons. For the study of the SED, we used simultaneous optical R-band data from the KVA telescope, archival X-ray data by Swift as well as INTEGRAL, and simultaneous high-energy (HE, 300 MeV–10 GeV) γ-ray data from the Fermi Large Area Telescope (LAT) observatory. Using the empirical approach of Prandini et al. (2010) and the Fermi LAT and MAGIC spectra for this object, we estimate the redshift of this source to be 0.34 ± 0.08 ± 0.05. This is a relevant result because this source is possibly one of the 10 most distant VHE blazars known to date, and with further (simultaneous) observations could play an important role in blazar population studies, as well as future constraints on the EBL and IGMF.
1 INTRODUCTION
Blazars are the most commonly detected extragalactic very high energy (VHE) γ-ray sources, with steadily increasing numbers1 in the VHE regime (E > 100 GeV) in the past 15 yr of ground-based γ-ray astronomy. These objects are a subclass of Active Galactic Nuclei (AGNs) with a set of characteristic properties like strong continuum emission extending from the radio all the way to the γ-ray regime, high polarization (at both optical and radio frequencies) and rapid variability at all frequencies and on all time-scales probed so far. Blazars are thought to be AGNs with jets which are closely aligned with our line of sight. This type of AGN subclass emits a characteristic spectral energy distribution (SED) with at least two broad emission components: one peak with a maximum in optical to X-ray band and a second peak located in the γ-ray bands (Urry&Padovani 1995). The first peak is commonly thought to be related to the synchrotron emission process in magnetic fields of the jets and the second peak is explained as inverse Compton (IC) scattering of low-energy photons (Rees 1967). If the low-energy photons which undergo the IC process are the synchrotron photons, the process is known as the Synchrotron Self Compton (SSC) mechanism (Tavecchio, Maraschi & Ghisellini 1998). Alternatively, the origin of the low-energy photons can be external to the jet due to external Compton scattering (EC; Dermer & Schlickeiser 1993).
1ES 0033+595 is a blazar near the Galactic plane at coordinates (J2000) RA: 00h35m52|${^{s}_{.}}$|63 and Dec.: 59°50′04|${^{\prime\prime}_{.}}$|56 (Giommi et al. 2002), belonging to the BL Lac type. It is classified as an extreme high-frequency peaked (HBL) object with synchrotron emission peaking near 1019 Hz (Nieppola, Tornikoski & Valtaoja 2006). So far, optical observations of 1ES 0033+595 were not able to resolve the host galaxy to determine a photometric redshift and thus the redshift of the blazar remains uncertain. A tentative redshift of 0.086 was derived by Perlman, and mentioned in Falomo & Kotilainen (1999) as a private communication, however, to the best of our knowledge the details are not yet published. From the Hubble Space Telescope (HST) images the only information that could be derived was the brightness of the nucleus and an upper limit to the brightness of the surrounding nebulosity, from which a lower limit of z > 0.24 has been derived by Sbarufatti, Treves & Falomo (2005).
1ES 0033+595 was first detected as a hard X-ray source by the Einstein Slew Survey in 1992 (Elvis et al. 1992). In 1996, it was observed by the HST as part of the snapshot survey of BL Lac objects, and was resolved into two point-like sources with a separation of 1.58 arcsec (Scarpa et al. 1999). These two objects with nearly identical brightness were explained as multiple images of a gravitationally lensed system. However, the Very Large Array (VLA) astrometric observations performed in 1997 did not detect a second radio source, ruling out that possibility (Rector, Gabuzda & Stocke 2003). 1ES 0033+595 was observed by the X-ray satellite BeppoSAX in 1999 December. Due to high Galactic absorption, it could only be detected in the LECS instrument above 0.4 keV and in the PDS instrument up to ∼60 keV (Costamante et al. 2001). The source was also detected with the INTEGRAL satellite in 2003 in the 20–50 keV energy band with a statistical significance of 5.2σ (den Hartog et al. 2006). In addition, during INTEGRAL observations in 2005 (Kuiper et al. 2005), the source was a factor of 2.4 brighter. The fact that all three X-ray observations show different flux levels emphasize very well the variable X-ray nature of this BL Lac object. With its large field of view and nearly continuous sky coverage the Burst Alert Telescope (BAT) instrument on board the Swift satellite also detected 1ES 0033+595 during the first 22 months (2004 December–2006 October) of observation (Tueller et al. 2010), and has been included in the 22, 58, and 70-month BAT catalogues.2
In the HE γ-ray range, the source has been continuously detected by the Fermi Large Area Telescope (LAT). The source was reported for the first time after the first 5.5 months of sky survey observations (Abdo et al. 2009). Since then it has been part of the Fermi first bright AGN catalogue, with a spectrum consistent with a flat power law with Γ = 2.00 ± 0.13 and a flux of F(>200 MeV) = (20.3 ± 5.1) × 10−9 cm−2 s−1 (Abdo et al. 2009). In the VHE γ-ray band this source was first observed for 12 h in 1995 December by the Whipple Observatory. These observations yielded only upper limits, F(>350 GeV) < 2.1 × 10⁻¹¹ erg cm−2 s−1, equivalent to 20 per cent of the Crab nebula flux (Horan et al. 2004).
MAGIC observations of this source were motivated by the BeppoSAX observations (Costamante & Ghisellini 2002). Therein 1ES 0033+595 was one of the most promising candidate TeV emitters. MAGIC observed this object in 2006 and later in 2008 for about 5 h. From these observations, only a flux upper limit at 95 per cent confidence level was obtained: F(>170 GeV) <2.4 × 10⁻¹¹ cm−2 s−1, 9.7 per cent of the Crab nebula flux (Aleksić et al. 2011b). New observations in 2009 during the commissioning phase of the MAGIC stereoscopic system led to the discovery of the source in the VHE γ-ray range (Mariotti 2011; Uellenbeck et al. 2012), as described in this paper.
2 OBSERVATIONS AND DATA ANALYSIS
Observations of 1ES 0033+595 performed in each energy band are described below.
2.1 VHE data: MAGIC
MAGIC is a system of two 17 m-dish Imaging Atmospheric Cherenkov Telescopes (IACTs) located at the Roque de los Muchachos observatory (28.8°N, 17.8°W, 2200 metres above sea level), in the Canary Island of La Palma. Since 2009 the MAGIC telescopes have carried out stereoscopic observations with a sensitivity of <0.8 percent of the Crab nebula flux, for energies above ∼300 GeV in 50 h of observations (Aleksić et al. 2012a). The trigger energy threshold of the system is the lowest among the currently operating IACTs, with an accessible energy range between 50 GeV and several TeV.
The MAGIC telescopes observed 1ES 0033+595 from 2009 August 17 until October 14, for a total observation time of 23.5 h. These observations were performed during the commissioning phase of the MAGIC stereoscopic system. During this time, the data taking was carried out using the so-called ‘soft stereo trigger mode’, i.e. using the MAGIC-I trigger system and operating MAGIC-II in ‘slave mode’. Compared to the standard trigger mode adopted for regular stereoscopic observations (the so-called full stereo trigger mode, where the Cherenkov events are triggered simultaneously by both telescopes), the ‘soft stereo trigger mode’ has slightly less sensitivity at the energies below ∼150 GeV. In order to take the non-standard trigger condition into account, dedicated Monte Carlo (MC) γ-ray simulations were generated and adopted in this analysis.
The observations of 1ES 0033+595 were carried out in the so-called wobble mode (Fomin et al. 1994), in which the pointing direction alternates every 20 min between two positions, offset by ±0| $_{.}^{\circ}$|4 in RA from the source. The data were taken at zenith angles ranging between 31° and 35°, which resulted in an analysis energy threshold (defined as the peak of the MC γ-ray simulated energy distribution for an energy distribution of photon index 3.8 after all analysis cuts) of ∼90 GeV.
After the application of standard quality checks based on the rate of the stereo events and the distributions of basic image parameters, 19.7 h of effective on-time events were selected to derive the results. The rejected data were affected mainly by non-optimal atmospheric conditions during the data taking.
The data analysis was performed using the standard software package mars (Albert et al. 2008c; Aliu et al. 2009), including the latest standard routines for the stereoscopic analysis (Lombardi et al. 2011; Aleksić et al. 2012a). After the calibration (Albert et al. 2008b) and the image cleaning of the events, the information from the individual telescopes is combined and the calculation of basic stereo image parameters is performed. For the γ/hadron separation and γ-direction estimation a multivariate method called Random Forest (RF; Albert et al. 2008a) is applied. For the former task, the algorithm employs basic image parameters (Hillas 1985), timing information (Aliu et al. 2009), and stereo parameters (Aleksić et al. 2012a) to compute a γ/hadron discriminator called Hadronness by comparison of real (hadron-dominated) data with MC γ-ray simulations. The Hadronness parameter ranges from 0 (for showers confidently identified as initiated by γ-rays) to 1 (for those clearly showing the features of a hadronic cosmic ray initiated shower). Finally, the estimation of the energy of the events is achieved by averaging individual energy estimators for both telescopes based on lookup tables (Aleksić et al. 2012a).
The final analysis cuts applied to the 1ES 0033+595 data were optimized by means of contemporaneous Crab nebula data and MC simulations. In computing the significance of the signal coming from the 1ES 0033+595 sky region, single cuts in Hadronness and θ2 (see Section 3.1) optimized for energies close to the threshold were applied.3 Conversely, while deriving the spectrum and the light curve of the source, multiple cuts optimized in logarithmic energy bins were considered.
2.2 HE data: Fermi LAT
The Fermi LAT is a pair conversion telescope designed to cover the energy band from 20 MeV to more than 300 GeV. Normally it operates in all-sky survey mode, scanning the entire sky every 3 h. Therefore, it can provide observations of 1ES 0033+595 simultaneous with MAGIC. Fermi data presented in this paper were collected from 2009 August 17 to October 14. In addition, to make a comparison with the behaviour of the source over a wider time interval, we also show the data analysed from the beginning of the science phase of the Fermi mission, that is 2008 August 4 to 2011 October 28. Both sets of data were analysed with the Fermi Science Tools package version 09-27-01, available from the Fermi Science Support Center,4 and with the post-launch instrument response functions [IRFs, P7SOURCE_V6; Ackermann et al. 2012a. Only events belonging to the ‘Source’ class and located in a circular region of interest (ROI) of 10° radius, centred at the position of 1ES 0033+595, were selected. In addition, we excluded photons with zenith angles >100° to limit contamination from Earth limb γ-rays, and data taken when the rocking angle of Fermi was greater than 52° to avoid time intervals during which the Earth entered the LAT field of view. The data analysis of 1ES 0033+595 is challenging because this source is located near the Galactic plane. As a consequence, to reduce the contamination by the Galactic plane diffuse emission, we decided to restrict the study to the 300 MeV–300 GeV energy range where we can profit from the narrower point spread function to separate the γ-ray emission associated with our source from the intense Galactic foreground. The analysis in the time interval simultaneous with MAGIC observations was performed using an unbinned maximum likelihood method (Mattox et al. 1996). Instead, a binned maximum likelihood technique was used for the 38-month data set. All point sources from the 2FGL catalogue (Nolan et al. 2012) located within 15° of 1ES 0033+595, and a background model, were included in the model of the region. The background model used for the analysis includes a Galactic diffuse emission component and an isotropic component (including residual instrumental background), modelled with the files gal_2yearp7v6_v0.fits and iso_P7v6source.txt, which are publicly available.5 In the full energy range analysis, all point sources within the 10° radius ROI were fitted with their parameters set free, while sources beyond 10° radius ROI had their parameters frozen to the values reported in 2FGL. The normalizations of the background components were allowed to vary freely.
2.3 Optical data: KVA
The KVA (Kungliga Vetenskapsakademien) telescopes are located at La Palma but operated remotely by the Tuorla Observatory from Finland. These telescopes are used mainly for optical support observations for the MAGIC telescopes. Specifically, there is a 60 cm telescope which is used for polarimetric observations and a 35 cm telescope which performs simultaneous photometric observations with MAGIC. Furthermore, the smaller 35 cm telescope monitors potential VHE γ-ray candidate AGNs in order to trigger MAGIC observations if one of these selected objects is in a high optical state. Such observations are performed in the R band and the magnitude of the source is measured from CCD images using differential photometry. During the MAGIC observation of 1ES 0033+595 the average optical flux obtained by KVA was R=17.93 mag, which corresponds to 0.21 mJy. To derive this νFν in the optical band the contribution from a nearby star (0.22 mJy) was subtracted from the total measured flux (Nilsson et al. 2007). Moreover, the brightness was corrected for galactic absorption by R=2.35 mag (Schlegel, Finkbeiner & Davis 1998). The average νFν during the MAGIC observations corresponds to 8.5± 0.5× 10⁻¹² erg cm−2 s−1. As outlined in Fig. 1, during a 9-yr KVA survey, the source shows only a marginal flux variability and also during the MAGIC observation window (bottom panel in Fig. 1) no significant variability was found.
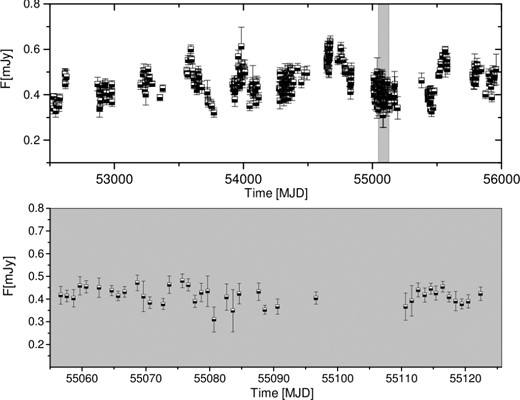
Optical R-band light curve from 9-yr monitoring observations performed by the Tuorla Observatory. The contribution of a nearby star (0.22 mJy) has not been subtracted. The MAGIC observation window in 2009 is shown as shaded in the top panel. The bottom panel shows the optical light curve along this time window.
2.4 X-ray data
We extracted a 4–10 keV light curve covering the time frame from 2009 August 17 until October 14 (the MAGIC observation window) from the Monitor of All-sky X-ray Image (MAXI) mission onboard the International Space Station (Matsuoka et al. 2009).6 This light curve is shown in Fig. 2. Fitting the X-ray light curve with a constant flux hypothesis yields a flux of (5.4 ± 0.7) × 10−3 photons cm−2 s−1 with a χ2/ndof = 19.1/7, that corresponds to a probability P(χ2) = 0.008. The source shows only marginally significant variability throughout the MAGIC observations. There are no Swift, XMM, or INTEGRAL flux points available which would match the MAGIC observation window. We have thus used data collected from the ASDC SED Builder tool7 during the observation period which are closer in time to the MAGIC observation period. All X-ray data points selected for this study are shown in Table 1.
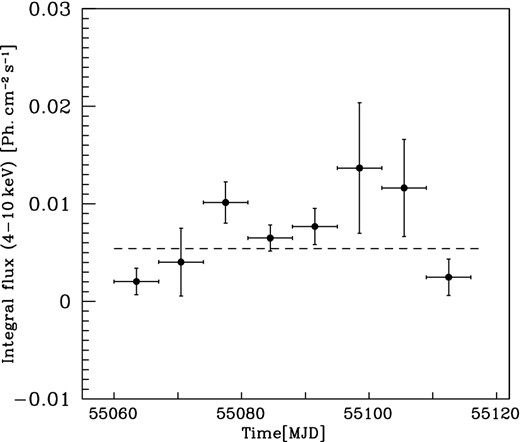
The light curve from the MAXI mission in the energy band of 4–10 keV from 2009 August 17 until October 14 with weekly time binning. The constant function resulting from the fit to the data is shown as dashed horizontal line.
3 RESULTS
3.1 MAGIC
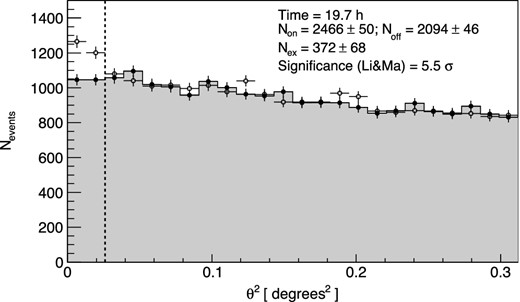
θ2 distributions of the 1ES 0033+595 signal (open circle) and background (filled circle) estimation from 19.7 h of MAGIC stereo observations taken between 2009 August 17 and October 14, above an energy threshold of 90 GeV. The region between zero and the vertical dashed line (at 0.026 deg2) represents the signal region.
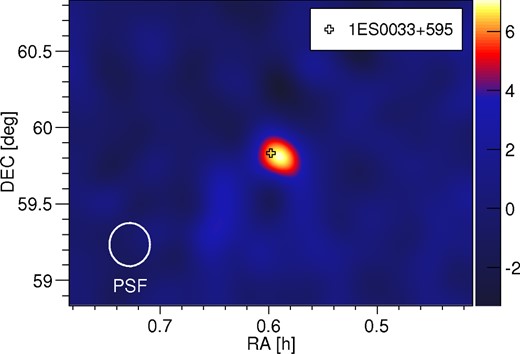
Significance map of the 1ES 0033+595 sky region from 19.7 h of MAGIC stereo observations above the estimated energy threshold of 90 GeV. The colour scale represents the TS value distribution. The white circle in the lower left indicates the point spread function (68 per cent containment) for this analysis.
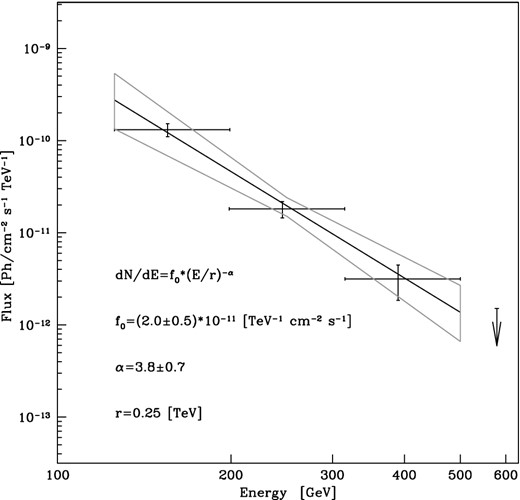
1ES 0033+595 differential energy spectrum measured by MAGIC between 125 GeV and 500 GeV. The power-law fit to the data is shown as a black line, while the uncertainty region is shown as grey bow tie. A flux upper limit calculated at a 95 per cent confidence level is also shown in the figure.
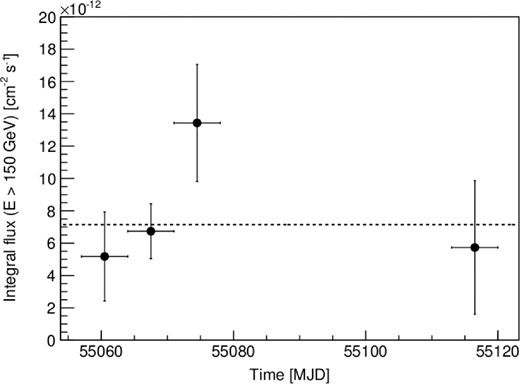
1ES 0033+595 light curve between 2009 August and October above an energy threshold of 150 GeV, and with a weekly time binning. No hints of significant variability are seen in the data. The dashed horizontal line represents the constant function resulting from the fit to the data.
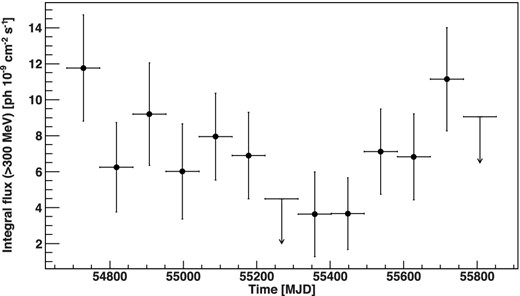
The light curve above an energy threshold of 300 MeV obtained by the Fermi LAT during 38 months of observation.
3.2 Fermi LAT
We obtained the following results for 1ES 0033+595. For the analysis of data simultaneous with MAGIC observations (2009 August 17 to October 14), the flux above 300 MeV is (8.0 ± 3.6) × 10−9 cm−2 s−1 and the photon index is 1.7 ± 0.2. For the 38-month time interval, the flux above 300 MeV is (6.6 ± 1.0) × 10−9 cm−2 s−1 and the photon index is 1.9 ± 0.1. The Fermi LAT light curve produced for the whole 38-month period is given in Fig. 7. For spectral analysis, in the first case we divided the full energy range in four energy bins: two bins for the 300 MeV–10 GeV range and two bins for the 10–300 GeV range. In the latter case, we divided the full energy range in six logarithmically equal energy bins. A separate fit in each energy bin was performed fixing the photon index of all the sources and the isotropic normalization to the values obtained from the likelihood analysis of the full energy range. For each energy bin, if the TS9 value was TS <9, then the values of the fluxes were replaced by 2σ confidence level upper limits. The latter were computed using the profile method (Rolke, López & Conrad 2005).
Systematic uncertainties in the LAT results of this source were found to be negligible with respect to the statistical ones. The two major sources of systematic errors that we considered were related to uncertainties in the absolute calibration of the LAT and to the modelling of interstellar emission. The first are due to the uncertainties in the LAT effective area and are typically ∼10 per cent (Ackermann et al. 2012a) and therefore negligible compared to the large flux variations observed. The latter could have had a major impact on the LAT measurements given the vicinity of the source to the Galactic plane. We decided to investigate them comparing the results obtained using the standard Galactic interstellar model (i.e. gal_2yearp7v6_trim_v0.fits, see footnote 3) with the results based on eight alternative interstellar emission models. The eight models were obtained by varying some of the most important parameters of the interstellar emission models, in a similar way to the approach of Pivato et al. (2013), and are based on a subsample of those examined by Ackermann et al. (2012b). As expected, the systematic uncertainties due to the modelling of the interstellar emission also were not relevant when compared with the statistical ones. This is due to the point-source morphology of 1ES 0033+595 and its hard photon spectrum, both characteristics helping to disentangling the source emission from the Galactic foreground.
4 INTERPRETATION
4.1 Redshift of 1ES 0033+595 from HE and VHE γ-ray data
As already mentioned in Section 1, the redshift of 1ES 0033+595 is uncertain. However, for the interpretation of our data (e.g. estimation of the intrinsic VHE γ-ray spectrum after Extragalactic Background Light -EBL- deabsorption) it is crucial to determine this parameter. For this reason, we use VHE and HE observations to constrain the redshift of the source by the empirical approach of Prandini et al. (2010; an updated work can also be found at Prandini, Mariotti & Tavecchio 2011). From the findings in Section 3.1, the VHE spectrum appears to be extremely soft (photon index α ∼ 4), as would be expected by the absorption of VHE photons by interaction with the EBL if the source is located at relatively large redshift (Stecker, de Jager & Salamon 1992). Such an absorption process depends on the energy of the photon and the distance it has travelled. The detection of spectra with indices Γ ∼ 4 from blazars located at redshift above 0.2 is consistent with the expectation for EBL absorption (Aleksić et al. 2012b).
One of the recently developed redshift determination methods is the empirical approach (Prandini et al. 2010), which is based on the assumption that the intrinsic spectrum at TeV energies (e.g. observed by MAGIC) cannot be harder than that in the GeV band (observed by Fermi LAT). The spectrum shown in Fig. 5 was corrected using an EBL model from Franceschini, Rodighiero & Vaccari (2008) in fine steps of redshift until the slope of the deabsorbed spectrum equals the one in the GeV band. In this case, a value of z = 0.58 ± 0.12 is obtained which corresponds to an upper limit on the redshift. An estimate of the likely redshift can be obtained using the inverse formula of Prandini et al. (2010), resulting in z = 0.34 ± 0.08 ± 0.05, where the first error (0.08) was calculated based on the uncertainties in photon indices of the source spectra measured by MAGIC and Fermi LAT, while the second error (0.05) is the method uncertainty, which comes from the spread in the results after applying the method to known redshift sources. In the following discussions, the new redshift estimation of z = 0.34 is used.
4.2 Spectral energy distribution
The emission characteristics of BL Lac objects are generally well reproduced by the one-zone leptonic model, in which a population of relativistic electrons inside a region moving down the jet emit through synchrotron and SSC mechanisms (Tavecchio et al. 1998). SSC models are generally successful in the modelling of HBLs like 1ES 0033+595, and will suffice for this first SED modelling of the source. Fitting EC or hadronic Mannheim (1993) models could be attempted in the future as more constraining multiwavelength data are obtained. It can also be noted that the one-zone SSC scenario can be a simplified approximation of complex process like emission from an inhomogeneous or stratified region, or a number of independent emission regions. Moreover, as reported in Sikora, Moderski & Poutanen (1997) the steady state emission can also be parametrized with a number of moving blobs that radiates only while passing through the standing shock. If this is the case, the observer can only see one blob at a given time, which is almost equivalent to the case of single blob emission. With the available data, we cannot distinguish between different scenarios, hence we adopt a single zone emission model (Maraschi & Tavecchio 2003) using the χ2-minimization method fully described in Mankuzhiyil et al. (2012). The emission region was assumed to be spherical, with radius R, filled with a tangled magnetic field of intensity B and relativistic electrons, emitting synchrotron and SSC radiation. The energy distribution of the electrons follows a smoothly broken power law with normalization K between the Lorentz factors γmin and γmax, with slopes n1 and n2 below and above the break at γbreak. The relativistic boosting is represented by the Doppler factor δ. In Fig. 8, we present, for the first time, the reconstructed SED from optical to TeV energies of 1ES 0033+595. The MAGIC data were corrected for the extragalactic absorption using the model of Franceschini et al. (2008), assuming a redshift of z = 0.34. Since this source is also very weak in the HE γ-range, besides the simultaneous LAT spectrum (from 2009 August 17 to October 14), we also included the spectrum from a 3-yr time interval (from 2008 August 4 to 2011 October 28) in the SED. The obtained parameter values from the one-zone SSC model fit to the data are summarized in Table 1. From the 3-yr LAT analysis a good overlapping between the Fermi LAT results and MAGIC is evident. The obtained values of the model parameters for the redshift z = 0.34, are summarized in Table 2. A comparison with other HBL objects (Tavecchio, Ghisellini & Ghirlanda 2010; Mankuzhiyil et al. 2011, 2012) shows that the one-zone SSC model parameters derived here are compatible with those obtained for other HBL class objects. We note that, considering the relatively limited experimental constraints, the SSC parameter combination may not be unique. Hence, alternative sets of parameters could also provide a satisfactory fit to the data.
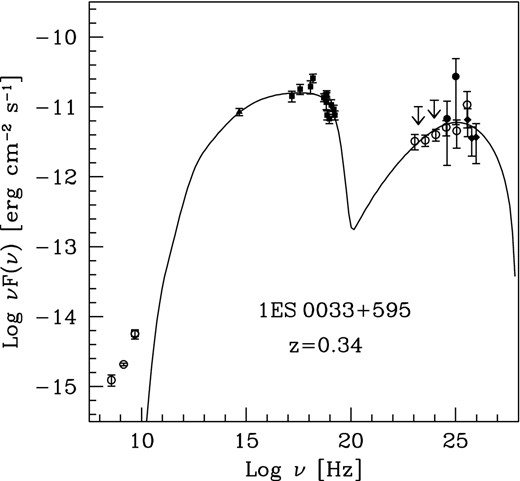
Broad-band SED for 1ES 0033+595: simultaneous KVA data where the contribution of a nearby star has been subtracted and the flux has been corrected for galactic extinction (filled triangle), X-ray data mentioned in Table 1 (filled square), simultaneous Fermi LAT data (filled circle) and MAGIC data corrected for the extragalactic absorption using the model of Franceschini et al. (2008) using a redshift of z = 0.34 (filled diamond). We also show the 3-yr LAT data (open circle) and archival radio data from the Green Bank and Texas observatory (open circle). The black solid line depicts the one-zone SSC model resulting from the SED model fit described in the text.
The selected X-ray data points in this study.
| Mission | Period | Frequency | Flux | Error |
|---|---|---|---|---|
| (1018 Hz) | (10−12 erg cm−2 s−1) | (10−12 erg cm−2 s−1) | ||
| XMM | 2004 July–2010 July | 1.18 | 19.5 | 3.7 |
| XMM | 2004 July–2010 July | 1.53 | 14.3 | 2.1 |
| XMM | 2004 July–2010 July | 0.37 | 18.0 | 2.4 |
| Swift | 2004 Dec–2008 Feb | 9.4 | 6.8 | 0.7 |
| Swift | 2004 Dec–2008 Feb | 5.1 | 13.7 | 1.1 |
| Swift | 2004 Dec–2008 Feb | 11.5 | 10.7 | 1.7 |
| Swift | 2004 Dec–2008 Feb | 6.9 | 15.2 | 1.0 |
| Swift | 2004 Dec–2010 Sept | 7.3 | 8.6 | 0.8 |
| Swift | 2004 Dec–2010 Sept | 16.9 | 8.6 | 0.8 |
| INTEGRAL | 2003 Feb–2008 Apr | 6.8 | 14.2 | 1.1 |
| INTEGRAL | 2003 Feb–2008 Apr | 15.3 | 9.2 | 1.0 |
| MAXI | 2009 Aug–2009 Oct | 1.52 | 22.4 | 2.8 |
Parameter values from the one-zone SSC model fit depicted in Fig. 8.
| γmin | γbreak | γmax | n1 | n2 | B (G) | K (cm− 3) | R (cm) | δ |
|---|---|---|---|---|---|---|---|---|
| 1.0· 103 | 2.1· 104 | 2.8· 106 | 2.0 | 3.0 | 1.8× 10⁻² | 6.5× 10² | 8.4× 10¹⁶ | 3.4× 101 |
| γmin | γbreak | γmax | n1 | n2 | B (G) | K (cm− 3) | R (cm) | δ |
|---|---|---|---|---|---|---|---|---|
| 1.0· 103 | 2.1· 104 | 2.8· 106 | 2.0 | 3.0 | 1.8× 10⁻² | 6.5× 10² | 8.4× 10¹⁶ | 3.4× 101 |
5 SUMMARY AND CONCLUSIONS
In this paper, the first detection of VHE γ-rays from 1ES 0033+595 has been reported. From the 2009 MAGIC data the source is clearly detected at a significance level of 5.5σ. The multiwavelength data presented here confirm the typical HBL blazar subclass behaviour of 1ES 0033+595: marginal variability in the optical R band, a hard spectrum in the Fermi LAT regime, and emission of VHE γ-rays. Moreover, the MAGIC detection of 1ES 0033+595 confirms the identification as a likely VHE γ-ray emitter by the Costamante & Ghisellini (2002) list. Since the redshift of this source is unknown, but crucial for accurate SED modelling, a new estimation (z = 0.34 ± 0.05) with the empirical approach of Prandini et al. (2010) was performed. This result is in a good agreement with the lower limit of z > 0.24 presented in Sbarufatti et al. (2005) and with empirical findings where the sources with redshift greater than 0.2 are characterized by a photon index of α ∼ 4. Finally, a comparison with other HBL objects (Tavecchio et al. 2010; Mankuzhiyil et al. 2011, 2012) shows that the model parameters used here for the SED fitting are compatible with those obtained for other HBL class objects. Considering the large uncertainty in the measured VHE spectrum and the unavailability of simultaneous X-ray data, further work on EBL and intergalactic magnetic field using the presented data is difficult. However, proper simultaneous Multi Wavelength (MWL) coverage on this high-redshift object would allow to perform these studies.
We would like to thank the Instituto de Astrofísica de Canarias for the excellent working conditions at the Observatorio del Roque de los Muchachos in La Palma. The support of the German BMBF and MPG, the Italian INFN, the Swiss National Fund SNF, and the Spanish MICINN is gratefully acknowledged. This work was also supported by the CPAN CSD2007-00042 and MultiDark CSD2009-00064 projects of the Spanish Consolider-Ingenio 2010 programme, by grant DO02-353 of the Bulgarian NSF, by grant 127740 of the Academy of Finland, by the DFG Cluster of Excellence ‘Origin and Structure of the Universe’, by the DFG Collaborative Research Centers SFB823/C4 and SFB876/C3, and by the Polish MNiSzW grant 745/N-HESS-MAGIC/2010/0.
The Fermi LAT Collaboration acknowledges generous ongoing support from a number of agencies and institutes that have supported both the development and the operation of the LAT as well as scientific data analysis. These include the National Aeronautics and Space Administration and the Department of Energy in the United States, the Commissariat à l'Energie Atomique and the Centre National de la Recherche Scientifique/Institut National de Physique Nucléaire et de Physique des Particules in France, the Agenzia Spaziale Italiana and the Istituto Nazionale di Fisica Nucleare in Italy, the Ministry of Education, Culture, Sports, Science and Technology (MEXT), High Energy Accelerator Research Organization (KEK) and Japan Aerospace Exploration Agency (JAXA) in Japan, and the K. A. Wallenberg Foundation, the Swedish Research Council and the Swedish National Space Board in Sweden.
Additional support for science analysis during the operations phase is gratefully acknowledged from the Istituto Nazionale di Astrofisica in Italy and the Centre National d’Études Spatiales in France.
Present address: NASA Goddard Space Flight Center, Greenbelt, MD 20771, USA, and Department of Physics, and Department of Astronomy, University of Maryland, College Park, MD 20742, USA.
Present address: Department of Physics, and Astronomy, and the Bartol Research Institute, University of Delaware, Newark, DE 19716, USA.
Present address: Ecole polytechnique fé,dérale de Lausanne (EPFL), CH-1015 Lausanne, Switzerland.
Present address: Department of Physics, and Astronomy, UC Riverside, CA 92521, USA.
Present address: Finnish Centre for Astronomy with ESO (FINCA), FI-20014 Turku, Finland.
Present address: Astrophysical Sciences Division, BARC, Mumbai 400085, India.
Present address: Oskar Klein Centre for Cosmoparticle Physics, Stockholm University, SE-106 91 Stockholm, Sweden.
Present address: GRAPPA Institute, University of Amsterdam, 1098XH Amsterdam, the Netherlands.
http://tevcat.uchicago.edu/, database compiled by Scott Wakely and Deirdre Horan.
The cuts correspond to an efficiency for γ-rays of >90 per cent.
The systematic errors of the flux normalization and the photon index considered here have been estimated to be 23 per cent and ±0.3, respectively, whereas the systematic error on the energy scale is 17 per cent. These values are more conservative than those presented in Aleksić et al. (2012a), given the low flux and the spectral steepness of 1ES 0033+595, as measured by MAGIC.
TS is two times the difference of the log(likelihood) with and without the source.
