


Abstract
We investigate the impact of energy released from self-annihilating dark matter (DM) on heating of gas in the small, high-redshift DM haloes thought to host the first stars. A supersymmetric (SUSY)-neutralino-like particle is implemented as our DM candidate. The pythia code is used to model the final, stable particle distributions produced during the annihilation process. We use an analytic treatment in conjunction with the code medea2 to find the energy transfer and subsequent partition into heating, ionizing and Lyman α photon components. We consider a number of halo density models, DM particle masses and annihilation channels. We find that the injected energy from DM exceeds the binding energy of the gas within a 105–106 M⊙ halo at redshifts above 20, preventing star formation in early haloes in which primordial gas would otherwise cool. Thus we find that DM annihilation could delay the formation of the first galaxies.
1 INTRODUCTION
Dark matter (DM) is recognized as an integral part of modern concordance cosmology, and while an empirical characterization has had considerable success in the description of wider astrophysical phenomena such as structure formation and gravitational lensing, DM's precise nature has remained unclear. Although there exists no suitable candidate within the existing standard model paradigm, an elementary particle formulation of DM remains the favoured solution (as opposed to a modified gravity model). As such, the DM problem is of current interest to both astro and particle physics, an overlap which may create unique opportunities in trying to establish the fundamental form of DM. In addition, models of physics beyond the standard model have proven fruitful sources of viable DM candidates, making DM a valuable road marker on the path to a complete theoretical formulation of fundamental physics. For general reviews of these topics see Roos (2012), Bertone, Hooper & Silk (2005) and Bergstrom (2012).
Our primary understanding of DM comes from the observation of astrophysical phenomena. A range of projects probing DM's behaviour beyond gravitational interactions are currently in progress or in the planning stages, including collider (Allanach et al. 2000; Baur et al. 2001; Baer et al. 2003; Birkedal, Matchev & Perelstein 2004) and direct detection experiments (Ahmed et al. 2011; Angle et al. 2011; Armengaud et al. 2012; Aalseth et al. 2013). While there are positive indicators that these will be able to constrain and confirm DM models in the future, data released to date have not proven conclusive [see, for example, the comparison between DAMA/LIBRA (Bernabei et al. 2010) and LUX (Akerib et al. 2014)].
Another avenue of investigation is that of indirect detection in which DM is assumed to produce standard model particles through non-gravitational interaction such as decay or annihilation. Particularly dense regions, such as those found at the centres of massive galaxies or clusters, could produce distinct gamma or X-ray signatures or signals from other particle excesses (Prada et al. 2004; Bertone 2006; Bergstrom, Edsjö & Zaharijas 2009; Grasso et al. 2009). Unambiguous identification as products of DM annihilation is complicated by the presence of other astrophysical sources such as pulsars and supernova which may mimic such a signal (Biermann et al. 2009; Hooper, Blasi & Dario Serpico 2009). Alternatively one may consider a more global impact by examining how the extra energy from DM annihilation affects features such as the high-redshift 21 cm signal from the galactic medium (Evoli, Mesinger & Ferrara 2014; Sitwell et al. 2014). Modifications may be particularly distinct during the early era of reionization where the power from DM energy injection was not swamped by astrophysical energy sources.
When introducing DM models into wider cosmological calculations, a number of complexities need to be taken into consideration. These include the inherent uncertainties in both the particle and astrophysics models (Mack 2014), impact on standard astrophysical processes (Fontanot et al. 2015) and possibly exotic structure formation (Spolyar, Freese & Gondolo 2008). The impact DM annihilation has on star formation is addressed in Ripamonti, Mapelli & Ferrara 2007, Natarajan, Tan & O'Shea 2009, Ripamonti et al. 2010, Stacy et al. 2012 and Smith et al. 2012. To further this line of investigation, we look to incorporate the physical processes implemented in the updated medea2 code to account for the injection of relativistic particles produced by massive DM particles. The energy transfer routine employed in this work allows us to explore the impact different DM halo models, as well as variation in the DM annihilation products, have on the total energy deposited over a wide range of redshifts and halo masses.
In this paper we investigate the energy transfer from DM self-annihilation in dark matter haloes at high redshifts and the impact this may have on gas within the halo. This is of interest for several reasons. First, the existence of a self-heating source could impact early star formation which in turn would have wider implications for the gas in the IGM and the rate of reionization. Secondly, the contribution from small, collapsed structure to the overall energy produced by DM annihilation is considerable so careful treatment of the energy transfer is desirable.
An outline of the paper is as follows. We begin with a summary of our method in Section 2. We describe a model of DM haloes across a range of masses and redshifts in Section 3. Descriptions of the simulated final stable states of the DM annihilation process, and the appropriate first-order analytic approximation of the energy transfer between the injected particles and the halo's gas component are given in Sections 4 and 5, respectively. We discuss the comparison between the injected energy and the halo's gravitational binding energy in Section 6. We conclude with a discussion in Section 7.
2 METHOD
We model the cosmological DM component using simple analytic expressions which allow for a straightforward exploration of the possible parameter space. The uncertainties in these quantities are of particular interest as we wish to minimize the possibility of astrophysical sources creating results which are degenerate to variations of the DM model.
Besides the halo model, the other key aspect in gauging the impact of self-annihilating DM on the halo's gas is a precise treatment of the injected energy produced by the DM annihilation process. This entails both the energy partition of the stable annihilation end products and the way these particles interact with the surrounding gas. We use pythia (Sjostrand, Mrenna & Skands 2006; Sjostrand, Mrenna & Skands 2008) to simulate the self-annihilation of a SUSY-neutralino-like particle and in this way also produce the spectral energy distribution of the injected particles.
We approach the actual energy transfer calculation through path-averaged integrals of individual particles, assuming that the injected particles are oriented isotropically and travel in straight paths. (Our method does not account for change in path due to scattering events, thus underestimating the length of the total path spent within the halo.) A Monte Carlo method is used to sample the different paths the particle could have taken to reach the edge of the halo, and subsequently we arrived at the average energy lost by an electron, positron or photon of energy Ei, injected at radius ri, once it reaches the virial radius. Our treatment of the relevant physical interactions follows Evoli et al. (2012), focusing on the primary injected particle. For a detailed discussion of the relevant processes see Appendix B.
We then integrate over the spatial and energy distributions of the particles to arrive at an estimate of the gross energy transferred to the gas. The Monte Carlo Energy DEposition (medea) code (Valdes, Evoli & Ferrara 2010; Evoli et al. 2012) is then used to gauge how this energy is partitioned into heating, ionization and Lyman α photons and how this could practically impact the halo's environment (see Section 6.1 for further details).
Throughout we take our cosmological parameters from Planck (Ade et al. 2014) such that h = 0.71, ΩΛ, 0 = 0.6825 and Ωm, 0 = 0.3175.
3 DARK MATTER HALO PARAMETERS
While the density profiles of haloes with mass upwards from 108 M⊙ are relatively well explored in simulations (see, for example, Merritt et al. 2005, 2006; Zhao et al. 2009; Navarro et al. 2010; Salvador-Sole et al. 2012), the precise form of smaller objects is less certain. Since these low-mass haloes provide a significant boost to the overall injected energy from DM annihilation as well as playing host to early star formation, we consider both different density profiles and mass–concentration relations in their description. Our models of small haloes are thus not necessarily definitive, physical representations but rather meant to cover a plausible parameter space. Halo masses under consideration range from 103–109 M⊙ for redshift 0–50.
3.1 Halo profiles
3.2 Baryonic profile
We assume the gas component of the halo to follow the DM density distribution with a baryon fraction of fb = 0.15. In our treatment, we find that the energy deposited into the halo is predominantly driven by high-energy electrons and positrons inverse Compton (IC) scattering off cosmic microwave background (CMB) photons and the absorption of the secondary photons produced in this process. The CMB photon density is independent of the distribution of the baryonic matter and the secondary, up-scattered photons more readily interact even with lower density gas than the original, high-energy particles injected. This reduces the impact the baryonic profile has on the total energy transferred. In this work, we find that the distribution of the DM, particularly at the centre of the halo, plays a more significant role than the baryons, in how much energy is deposited into the halo. For a comparison between this approach and a baryonic core (Abel, Bryan & Norman 2002) profile see Appendix C.
3.3 Mass–concentration relations
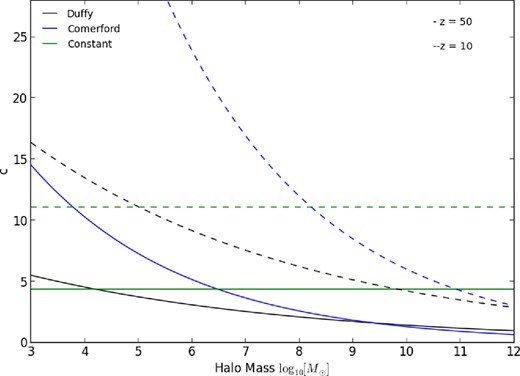
Mass–concentration relation for haloes between 103–1012 M⊙ at redshift 50 (solid line) and 10 (dashed line). Black, blue and green refer to the Duffy, Comerford and constant models, respectively.
4 DARK MATTER MODEL
We here choose a generic self-annihilating SUSY neutralino as our DM particle spanning masses from 5 to 110 GeV, with quark/anti-quark pairs, muons, tau, or W bosons as their immediate annihilation products. In practice, more exotic candidates that either annihilate or decay to inject energy in the form of standard model particles could also be used provided a sufficient compatibility with the assumed cosmology.
4.1 Dark matter annihilation power
4.2 Final particle states
pythia is used to produce the final particle states for the various candidates. The DM annihilation event is simulated via an electron/positron proxy where the centre of mass energy of the collision is set as twice the mass of the DM particle. We further differentiate between annihilation paths via quark/anti-quark pairs, mu and tau leptons and W bosons. The annihilation products are simulated until only stable particles (neutrinos, electrons/positrons, photons, protons/anti-protons) are left. Figure A1 shows the respective spectra of the energy distributions of electrons, positrons and photons for different DM masses and annihilation channels.
5 ENERGY TRANSFER
Energy is transferred to the halo's gas component via photons, electrons and positrons. Neutrinos only interact weakly and only negligible numbers of protons/anti-protons are created, so their contribution to the deposited energy is negligible.
5.1 Individual particle energy loss
The energy loss rate for a photon is driven by the total interaction cross-section which is heavily dependent on the photon energy (Beringer et al. 2012). Fig. 2 shows the number of interactions the photons with different energies, injected at various radii, undergo before escaping the halo. We note that in the case of high-energy photons that predominantly lose energy through electron/positron pair-creation, particles will largely escape the halo without significant interaction. In contrast, for photons with energy below the MeV range, the main energy transfer mechanisms moves to Compton scattering and photoionization/excitation. These have a higher interaction cross-section than the pair-production process and so are considerably more efficient at depositing their energy into the gas. Overall only particles created very close to the core of the halo, and thus injected in a high-density gas environment, contribute to the energy transfer in any notable form. Thus density profiles with a cusp and high mass–concentration parameters are considerably more efficient than the more relaxed models at depositing energy as they provide the high-density core required for the photon energy-loss processes.
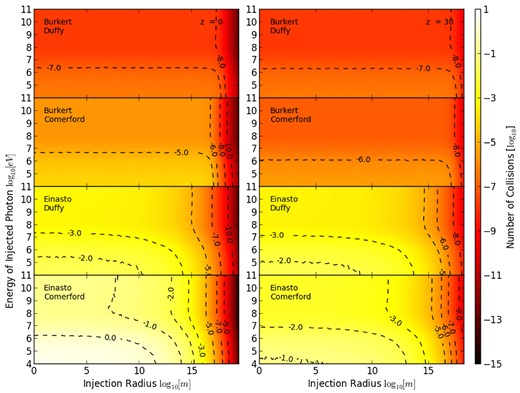
Average number of collisions undergone by photons before reaching the virial radius in a 105 M⊙ halo. The left-hand side shows haloes at redshift 0 and the right at redshift 30. From upper to lower (least to most concentrated), the rows correspond, respectively, to a halo model of Burkert/Duffy, Burkert/Comerford, Einasto/Duffy and Einasto/Comerford. In each plot the contour lines correspond to the equivalent value given by the colour bar.
In contrast, electrons and positrons are assumed to lose energy continuously according to the particle's stopping power as well as in collisions via IC scattering off CMB photons. The latter process dominates in the high-redshift regime. Fig. 3 shows the fraction of the injected particle's initial energy that is lost as the particle reaches the virial radius, with the right-hand side showing haloes at redshift 30 and the left at redshift 0. From top to bottom the halo density profiles are ordered from least to most concentrated. We note that IC scattering is indeed shown to be the dominant energy-loss mechanism for high-energy electrons at high redshift and the energy lost is independent of the halo profile. In contrast, energy loss through interactions with the halo gas is dominant for low-energy particles and is, as expected, more efficient in the highly concentrated models. While most of the injected electrons are high-energy particles, and will therefore undergo IC scattering at high redshift, the lost energy will be transferred to the halo's gas through the up-scattered CMB photons created in the process. Thus while the energy loss of the injected electrons from IC scattering is independent of the halo profile, the amount of energy absorbed by the halo will still be dependent on its density distribution.
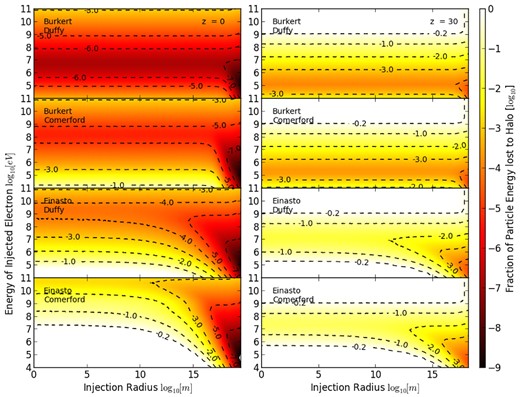
Average fraction of energy lost by electron/positron created at radius r before reaching the virial radius in a 105 M⊙ halo. The left-hand side shows haloes at redshift 0 and the right at redshift 30. From upper to lower (least to most concentrated), the rows correspond, respectively, to a halo model of Burkert/Duffy, Burkert/Comerford, Einasto/Duffy and Einasto/Comerford. The contour lines correspond to the equivalent value given by the colour bar.
As a whole we find electrons and positrons to be the dominant source of DM annihilation energy being transferred to gas in the halo.
5.2 Total energy lost
6 BINDING ENERGY COMPARISON
In Fig. 4 we plot the ratio between the annihilation energy and the binding energy (left-hand panel) and the fraction of the annihilation energy lost to the halo (right-hand panel) for an Einasto profile with a Duffy mass–concentration relation and a 5-GeV DM particle. We note that in small haloes the annihilation energy is an order of magnitude larger than the binding energy when taken over the Hubble time (the increase in Hubble time also accounts for the ratio increasing at low redshift). In contrast the transfer of energy to the halo is more efficient in large haloes at high redshift which is consistent with IC scattering being the most efficient energy loss mechanism.
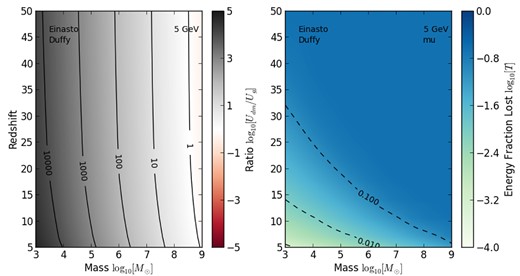
The left-hand panel shows the ratio of the total energy produced through DM annihilation and the gravitational binding energy of the gas. The right shows the fraction of energy lost by the particles as they leave the halo. Both use a halo model consisting of an Einasto profile with a Duffy mass–concentration relation and a 5-GeV DM particle. Again the contour lines correspond to the values given by the colour bar.
Figs 5 and 6 show this effective energy transfer fraction, assuming fabs = 0.1. In Fig. 5 we utilize a 5-GeV DM particle annihilating to muon and show Feff for various halo models. The left-hand panel shows results for Einasto profiles, with our three mass–concentration models, and the right-hand panel shows results for the Burkert model. While the overall behaviour is the same for all halo models, we find the cuspy Einasto model to be more efficient at self-heating. In a similar vein, the mass–concentration relation which produces the highest value for c produces the greatest Feff at fixed redshift and halo mass, indicating that the more concentrated the halo the more efficient is the energy transfer process.
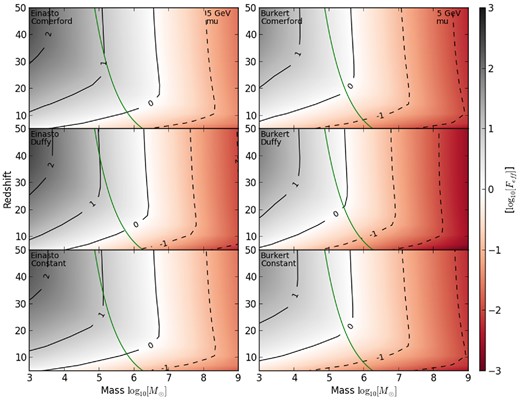
Ratio of energy produced by DM annihilation over the Hubble time deposited into the halo, to the halo's gravitational binding energy for a 5-GeV DM particle annihilating via a muon. The left-hand side shows Einasto profiles with Comerford, Duffy and constant mass–concentration relations, respectively, with fabs = 0.1, while the right shows the same with a Burkert profile. The black contour lines again correspond to the values of the colour bar. The green line is the critical mass for which molecular cooling is possible. Halo models to the right of the line can cool efficiently.
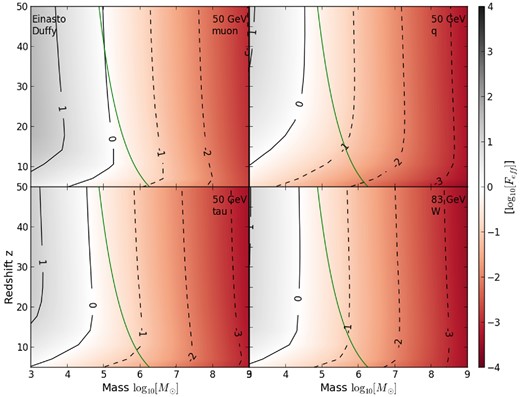
Ratio of energy produced by DM annihilation over the Hubble time to the halo's gravitational binding energy for a halo with an Einasto profile and Duffy mass–concentration relation and fabs = 0.1. The panels show, respectively, a 50 GeV particle annihilating via muon, quark and tau particles as well as 83-GeV particle annihilation via a W boson. Again the green line is the critical halo mass for molecular cooling, while the black contour lines correspond to the colour bar. Halo models to the right of the line can cool efficiently.
At high redshifts, star formation has not yet disassociated molecular hydrogen, providing a cooling channel in haloes of 105–106 M⊙ (Haiman, Rees & Loeb 1997). Also included in Fig. 5 is the critical mass above which haloes undergo molecular hydrogen cooling (green curve; Loeb 2006). Haloes to the left of the curve do not cool and therefore cannot collapse and form stars. We note that for all models there is a region between z = 15–50 and for haloes 105–106 M⊙ in which molecular hydrogen cooling is possible but Feff > 1. This opens the possibility that DM annihilation could have a significant impact on the gas chemistry in these systems and by extension on other internal structure formation.
Fig. 6 shows similar plots for different annihilation channels and an Einasto profile with a Duffy mass–concentration relation. The tau, muon and quark cases all correspond to 50-GeV DM particles while the W boson case shows an 83 GeV particle. In all cases we find that at high redshift, Feff ∼ 1 either coincides with the molecular cooling line or lies to the left of it, suggesting a smaller impact from larger DM particle candidates. At the same time, we note that while star formation may not be impacted in the largest haloes for this DM model, they nevertheless act as both sources and sinks for ionizing radiation. This should be taken into account when including annihilating DM in reionization calculations.
Finally while we find that at high redshift the energy deposition behaviour is comparable between all four models (with the mu path being the most efficient), there is greater variation at low redshift. This is because as the mechanism with which the injected particles lose energy becomes less efficient, their sensitivity to the injected particle's initial energy increases and we see variation in Feff due to the differences in their DM model's injected particle energy distributions.
6.1 Uncertainty due to fabs
We consider the uncertainty in our estimate in the secondary particle energy absorption fraction by comparing the energy depositions plots for a range of fesc, shown in Fig. 7. From top to bottom, panels show fabs = 0.001, 0.01 and 0.1, in all cases the halo hosts an Einasto profile with a Duffy mass–concentration relation. We note the impact fabs has on the energy transfer into the halo's gas. In particular in the case in which only an fabs = 0.001 of the energy carried by secondary particles is transferred to the halo, the impact DM annihilation has on heating the halo's gas becomes significantly reduced. This reaffirms the importance of careful future treatment of the secondary particles within the halo.
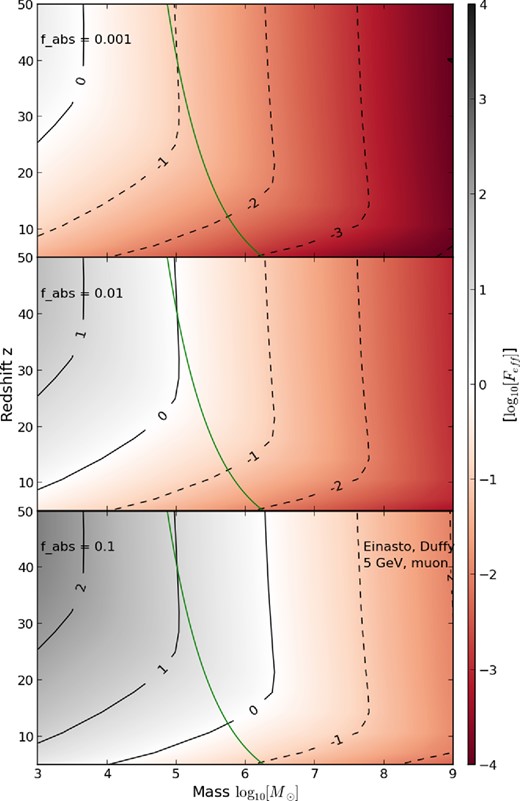
Ratio of energy produced by DM annihilation over the Hubble time deposited into the halo, to the halo's gravitational binding energy for different secondary particle absorption fractions. From top to bottom, fabs = 0.001, 0.01, 0.1 In all cases we are considering a 5-GeV DM particle annihilating via the muon channel in a halo with an Einasto profile and Duffy mass–concentration relation. Again the contour lines correspond to the plot's colour bar.
6.2 medea
The above calculation gives an estimate of the gross energy transfer from DM annihilation to gas within the halo. There is a further partition into the energy that is channelled to heating, ionization and the creation of Lyman α photons. While the stopping power and cross-sections used here are averaged quantities that do not track the secondary cascade particles, one can calculate the spectrum of photons produced through the IC process. As this is also the largest channel through which energy is deposited into the halo we can use this in conjunction with the medea2 code to give an indication of the breakdown of the deposited energy.
The medea2 code uses a Monte Carlo method to randomly sample physical processes such as interaction probabilities and cross-sections to trace the path of an injected particle through primordial gas (atomic hydrogen and helium) with a homogeneous density distribution. It also tracks secondary particles created during particle cascades. For a particle (electron, positron or photon) with specified energy at a given redshift (gas density), it returns the energy partition of the injected particle into heating, H and He ionization and Lyman α photons. medea2 produces these for a specifiable range of gas-ionization fractions.
To account for the secondary particles, we produced medea2 partitions for the energy range of the up-scattered, IC photons. The medea code assumes a uniform gas distribution and is so not representative of the variable density of the halo's gas component. To incorporate this density variation into our calculation, we also produced corresponding partitions at a range of redshifts corresponding to the range of gas densities found in the halo. We found that overall there is little difference between the partition fractions produced for different gas densities as photons of the energy range considered here, are absorbed efficiently by the gas even at low densities, and produce little to no free-streaming particles. We also note that in contrast to our treatment of the primary, injected particles where the gas density is fixed with radius and the CMB radiation varies with redshift, the gas density and CMB photon number densities in medea2, evolve conjointly with redshift due to expansion. The use of medea2 with a redshift density proxy remains valid for the case of the particles under consideration here as low-energy photons do not interact with the CMB field. We subsequently used the photon medea partitions to produce energy-weighted averages of the partition fractions.
Fig. 8 shows how the energy transferred would be partitioned into heating, ionization and Lyman α photons for different ionization fractions of the halo gas, assuming IC scattering is the dominant component of energy deposition. We compare a 105 M⊙ halo on the left with a 106 M⊙ halo on the right. In both cases we show a 5-GeV DM model annihilating via muons and fabs = 0.1. The solid lines correspond to redshift 30 and the dashed to redshift 50.
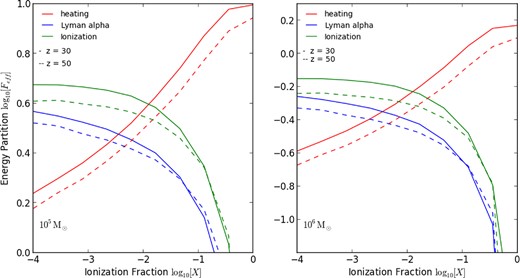
Ratio of DM annihilation energy and halo binding energy over Hubble time with medea I energy deposition for a 105 M⊙ (left) and 106 M⊙ (right) halo with an Einasto profile and Duffy mass–concentration relation and fabs = 0.1. Continuous lines indicate z = 30 and the dashed lines z=50. Red indicates energy into heating, blue Lyman α photons and green ionization.
7 DISCUSSION
Using a simple analytic treatment, we have calculated the degree to which the small DM haloes at high redshift which are thought to host the first stars heat and ionize themselves through the annihilation of DM. We find that the total energy produced by the annihilation process over the Hubbble time exceeds the gravitational binding energy of the halo's gas for structures with mass less than ∼108 M⊙. However, the high-energy stable particles produced in this process do not readily interact with the surrounding gas so energy is transferred through secondary particles. For a secondary particle energy absorption fraction of fabs = 0.1 and taking the critical mass for molecular cooling into consideration, we find that there is a parameter space in which primordial gas inside a 105–106 M⊙ halo above redshift 20 could cool but where the injected energy from DM still exceeds the binding energy of the gas. This could lead to the disruption of early star formation, and a delay in the formation of the first galaxies.
We find that the lighter DM particle masses with the muon annihilation channel are the most effective inhibitors of star formation. Concentrated haloes that display some sort of cusp-like behaviour are also more efficient at self-heating due to the square dependence of the DM power on the density distribution.
This complements the work of Ripamonti et al. (2007), in which the authors found that DM annihilation/decay may lead to a substantial evacuation of gas from haloes with mass less than 106 M⊙. While their work implemented lighter DM candidates with annihilation/decay products that generally interact with the gas in the halo more readily, our treatment of the injected relativistic particles following Evoli et al. (2012) shows that disruption of the star formation process maybe still be a possibility, even for heavier DM models.
The efficiency with which the injected particles transfer their energy to the halo is of key importance in this calculation. However, the complete description of the energy loss of not only the primary injected particles but also their secondary progeny is beyond the scope of this work. In particular, the energy absorption fraction, fabs, of the secondary particles plays a crucial role in determining the overall impact DM annihilation has on heating the halo's gas. The full realization of the energy transfer process within the bounds of the halo, including non-static gas conditions, will be addressed in a future paper. Similarly, a detailed description of the impact of the extra injected energy on the halo's gas chemistry and what consequences this would have for structure formation are also left for future work.
We wish to thank Carmelo Evoli for access and assistance with the medea code. We also thank the anonymous referee for their suggestions and input. KJM is supported by the Australian Research Council Discovery Early Career Research Award.
While we adopt here a cross-section constant across all our models, we note that 〈vσ〉 for some of our models may already be subject to constraints in conjunction with the DM particle mass employed.
The precise spectrum of secondary particles produced will be dependent on the down-scattering process.
REFERENCES
APPENDIX A: DETAILED pythia OUTPUTS
In Figure A1 we show detailed final energy distributions from pythia for electrons, positrons and photons for the different annihilation channels. Each plot shows the fraction of the centre of mass energy of the annihilation process carried by particles with different energy averaged over 100 000 events.
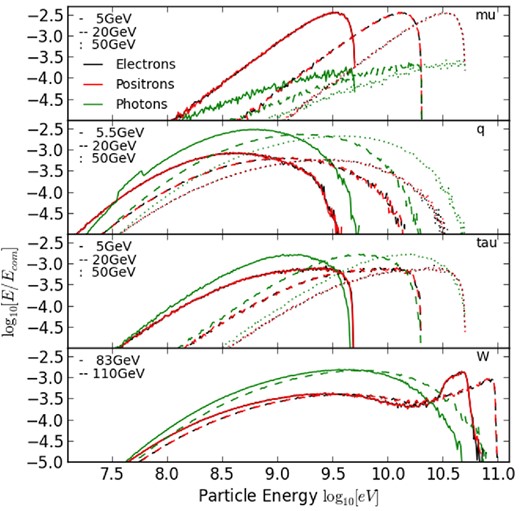
Averaged fraction of the centre of mass energy carried by photons (green), electrons (black) and positrons (red) of energy E for 100 000 neutralino annihilation events in pythia. The upper three panels correspond from top to bottom to annihilation to mu, quark and tau particles where in each, the solid line gives the final, stable particle distribution for a 5-GeV (or 5.5 GeV in the case of the quark) DM particle, the dashed a 20 GeV particle and the dotted the 50 GeV case. The lowest panel shows annihilation to a W boson where here the solid line is the 83 GeV model and the dashed the 110 GeV model.
APPENDIX B: ENERGY TRANSFER DETAILS
We here illustrate in greater detail the mechanisms (Evoli et al. 2012) via which the injected particle transfer energy to the halo.
The DM model considered in this work annihilate predominantly to high-energy particles. While the precise energy spectral density is dependent on the annihilation channel and the DM particle mass (see Fig. A1), electrons, positrons and photons are generally injected with energy in the order of GeV and above.
B1 Photon
The mechanisms via which photons lose energy to the gas are photoionization, Compton scattering and electron–positron pair-creation. For photons of the energy range discussed here, pair-creation is the dominant interaction. Since interaction cross-sections are larger for low-energy particles, the energy transfer rate of photons is driven foremost by the dense gas at the core of the halo and overall the contribution from injected photons to the total energy deposited is secondary to that from electrons and positrons.
B2 Electrons and positrons
Electrons and positrons lose energy through interaction with the halo's gas component, as well as the CMB photon background. In the former case, this is enabled through Bremsstrahlung and collisional interactions (ionization and excitation). Loss through Bremsstrahlung is the dominant process for high-energy particles and collisional interaction for low-energy particles, with the critical energy Ecrit ∼ 340 MeV giving the cross-over between the two regimes. We note that for the injected electrons, Bremsstrahlung is thus the more prevalent process of the two. Energy loss is more efficient in high-density regions such as the halo's core and is thus sensitive to the baryonic profile.
Interaction with the CMB photon background occurs through IC scattering, in which some of the electron's energy is transferred to the scattering photon. The energy transferred is dependent on both the original energy of both the photon and electron, with |$\frac{ \langle \nu _{\rm {f}} \rangle }{\nu _{\rm {i}}} = \frac{4}{3} \gamma ^{2}$| where 〈νf〉, νi are the average energy of the up-scattered photon and energy of the original photon and γ the boost factor of the electron. The electron will undergo multiple IC scattering events. The efficiency of this mechanism will diminish with redshift due to the reduction of CMB photon number density, as well as the drop in the CMB temperature. At high redshift this is the dominant electron energy loss mechanism. This behaviour can be observed in the Fig. 3, specifically the efficient energy loss for high-energy electrons at high redshift, independent of the baryonic profile.
While IC scattering leads to loss of energy for the electron, this energy is not directly transferred to the halo. Instead the secondary, up-scattered photons created in the process interact with the gas and deposit energy in the form of heat, photoionization and Lyman α photons. This mechanism is far more efficient than the energy transfer from initially injected particles due to the up-scattered photon's low energy (up to UV/soft X-ray). Our calculation of the energy transfer does not extend to a precise treatment of these secondary particles. We refer to the discussions of escape fractions of photons from early star-forming haloes as well as the results produced by medea2 to motivate our estimate of the secondary photon energy transfer rate of fabs = 0.1, see Section 6. We will in future work determine the distribution of energy within the halo.
APPENDIX C: BARYONIC PROFILE COMPARISON
In Fig. C1, we show the comparison between the ratio of energy produced by DM annihilation over the Hubble time and transferred into the halo, and the gravitational binding energy, for a case in which the baryonic profile traces that of the DM distribution (upper panel) and one for which the baryonic component forms a core (lower panel). The two models produce comparable results, with the baryonic core model being only marginally less efficient, as expected. This occurs because the IC scattering mechanism is not heavily reliant on the dense gas region at the centre of the halo to effect energy transfer.
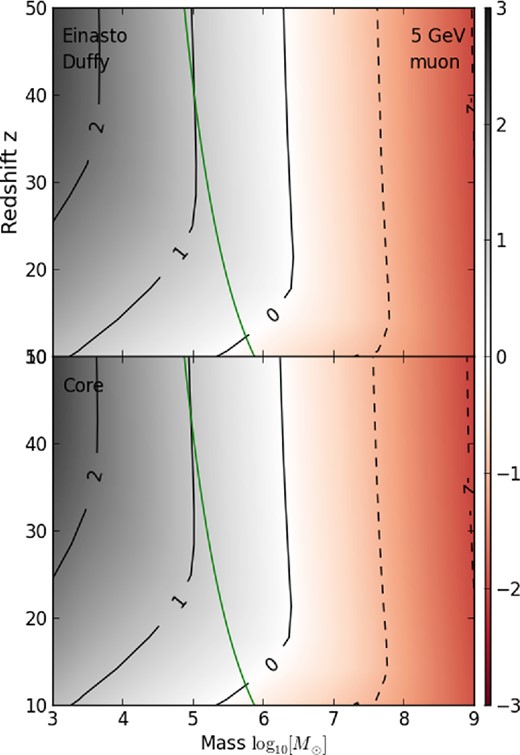
Ratio of energy produced by DM annihilation over the Hubble time deposited into the halo, to the halo's gravitational binding energy for a 5-GeV DM particle annihilating via a muon. The upper panel shows and Einasto-like baryonic profile with a Duffy mass–concentration relation and fabs = 0.1, while the lower shows the same with a baryonic core profile.
