


ABSTRACT
We investigate the physics that drives the gas accretion rates on to galaxies at the centres of dark matter haloes using the EAGLE suite of hydrodynamical cosmological simulations. We find that at redshifts z ≤ 2, the accretion rate on to the galaxy increases with halo mass in the halo mass range 1010–1011.7 M⊙, flattens between the halo masses 1011.7 and 1012.7 M⊙, and increases again for higher mass haloes. However, the galaxy gas accretion does not flatten at intermediate halo masses when active galactic nucleus (AGN) feedback is switched off. To better understand these trends, we develop a physically motivated semi-analytic model of galaxy gas accretion. We show that the flattening is produced by the rate of gas cooling from the hot halo. The ratio of the cooling radius and the virial radius does not decrease continuously with increasing halo mass as generally thought. While it decreases up to ∼1013 M⊙ haloes, it increases for higher halo masses, causing an upturn in the galaxy gas accretion rate. This may indicate that in high-mass haloes, AGN feedback is not sufficiently efficient. When there is no AGN feedback, the density of the hot halo is higher, the ratio of the cooling and virial radii does not decrease as much, and the cooling rate is higher. Changes in the efficiency of stellar feedback can also increase or decrease the accretion rates on to galaxies. The trends can plausibly be explained by the re-accretion of gas ejected by progenitor galaxies and by the suppression of black hole growth, and hence AGN feedback, by stellar feedback.
1 INTRODUCTION
Cosmological simulations have not only shown that the evolution of galaxies’ gas reservoirs is governed by feedback from stars and black holes (e.g. Kereš et al. 2009; Oppenheimer et al. 2010; Dubois et al. 2012; Haas et al. 2013; Crain et al. 2017), but also that it is critically linked to the cosmic web and halo gas flows (e.g. Dekel et al. 2009; van de Voort & Schaye 2012), which are responsible for the galaxy mass growth. Evidence that feedback manifests itself in the form of enriched outflows and energetic winds comes from various observations (e.g. Feruglio et al. 2010; Sharp & Bland-Hawthorn 2010; Cicone et al. 2014; Anderson et al. 2015; Turner et al. 2015; Nielsen et al. 2017), but gas accretion from the circumgalactic medium (CGM) is difficult to observe and the physical processes that drive its evolution are not well understood.
It has been proposed that outflows in the form of winds join the warm-hot intergalactic medium and may eventually reverse trajectory to re-accrete on to the galaxy. This is generally referred to as wind recycling or a galactic fountain (see e.g. Oppenheimer et al. 2010; Übler et al. 2014; Anglés-Alcázar et al. 2017). On the other hand, it has also been suggested that gas accretion is suppressed by outflows generated by black holes located in the centre of the active galactic nuclei (AGNs), which quench the diffuse accretion rates on to galaxies (e.g. Di Matteo, Springel & Hernquist 2005; Bower et al. 2006; Croton et al. 2006; Sijacki et al. 2007; Booth & Schaye 2009; Dubois et al. 2012, 2013; Martizzi, Teyssier & Moore 2012). Accretion shocks occur as a result of collisions between gas from the circum-halo medium falling into haloes and the hot halo gas in hydrostatic equilibrium. When accretion shocks occur, the gravitational energy of the infalling gas is converted into thermal energy. The works of Rees & Ostriker (1977) and Silk (1977) proposed that shock-heated gas with long cooling times forms a hot hydrostatic halo atmosphere, pressure supported against gravitational collapse.
Semi-analytic models (SAMs) of galaxy formation generally assume that gas falls into galaxies through either a rapid or a slow cooling flow, depending on the radial scale below which gas is able to cool (i.e. where the gas has a cooling time shorter than the dynamical time). This radius is typically referred to as the cooling radius (rcool). When rcool becomes smaller than the virial radius (R200), a hot hydrostatic atmosphere is formed. Gas accretion on to galaxies then changes from being in the rapid cooling regime to the slow cooling regime (e.g. White & Frenk 1991). Hydrodynamical simulations, however, have shown that both quasistatic and inflowing gas components can exist in the halo at the same radius (see e.g. figs 1 and 2 from Correa et al. 2017 and references therein). These are usually referred to as hot and cold modes of accretion. Gas not only falls into a galaxy through a cooling flow (hot mode), but also through a cold flow (cold mode). Cold flows tend to be filamentary, clumpy, and of higher density than the hot mode gas, and are strongly correlated with the dark matter filaments that feed haloes (e.g. Kereš et al. 2005; Ocvirk, Pichon & Teyssier 2008; Dekel et al. 2009; Faucher-Giguère, Kereš & Ma 2011; van de Voort et al. 2011; van de Voort & Schaye 2012; Nelson et al. 2013; Woods et al. 2014). These two modes of accretion are able to coexist in massive haloes at high redshift (Dekel et al. 2009; Correa et al. 2017) and feed the galaxy at the same time. The co-evolution between the different modes of accretion has not been implemented in SAMs until recently. Cousin et al. (2015) included a two-phase smooth baryonic accretion, with the hot and cold components built over the smooth dark matter accretion, whereas Lu, Mo & Wechsler (2015) modelled a circum-halo medium, assumed to be preheated up to a certain entropy level, to reduce the baryonic accretion.
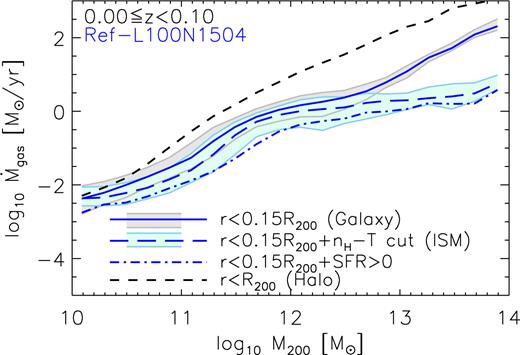
Accretion rate of gas on to the central galaxies of dark matter haloes as a function of halo mass in the redshift range 0 ≤ z < 0.1. The solid line corresponds to the gas accretion rate calculated by counting all gas particles that crossed 0.15 × R200 during consecutive snapshots, whereas the dashed and dot–dashed lines correspond to the gas accretion rates calculated by counting gas particles that crossed 0.15 × R200 radius and the phase-space cut nH−T, and that crossed the 0.15 × R200 radius and are star-forming, respectively. The grey and cyan shaded regions enclosing the median values of |$\dot{M}_{\rm {gas}}$| correspond to the 1σ scatter (16–84th percentiles) on to the 0.15 × R200 region and interstellar medium (ISM), respectively. The 1σ scatter of |$\dot{M}_{\rm {SFR}>0}$|, not included in the figure, is (on average) 0.3 dex similar to that for |$\dot{M}_{\rm {ISM}}$|. For comparison, the black dashed line shows the rate of gas accretion on to haloes (i.e. crossing R200). The figure shows that massive galaxies accrete warm diffuse gas that is not accreted on to the ISM.
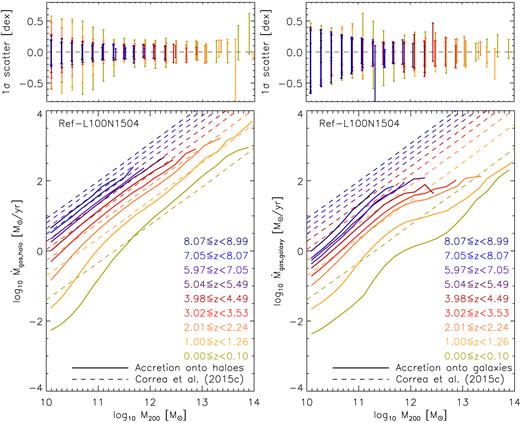
Accretion rates on to haloes (bottom left-hand panel) and galaxies (bottom-right-hand panel) as a function of halo mass for different redshifts. The curves are coloured according to the redshift intervals indicated in the legends. The solid curves correspond to the median accretion rates taken from the Ref-L100N1504 simulation, whereas the dashed curves correspond to the analytic model of Correa et al. (2015c) for dark matter halo accretion rate times fb = Ωb/Ωm. The 1σ scatter (16–84th percentiles) of the median accretion rates on to haloes and galaxies is shown in the top left-hand and top right-hand panel, respectively. The figure shows that at z ≤ 2 in the halo mass range 1010–1012 M⊙, the gas accretion rate on to the galaxy increases with halo mass, but flattens at ∼1012 M⊙.
Once gas crosses the hot halo and cools, feedback from stars and black holes can potentially reheat it and prevent it from falling into the galaxy. Therefore, due to the complexity in the interaction of all the possible mechanisms that modify the manner in which galaxies accrete gas, a physical model of galaxy gas accretion is still missing. In this work, we use the 'Evolution and Assembly of GaLaxies and their Environments' (EAGLE) simulations to study the modes of gas accretion on to galaxies and their dependence on feedback variations. We derive a physically motivated model of galaxy gas accretion that aims to explain the underlying physics of the way gas cools from the hot halo and accretes on to galaxies. In Correa et al. (2017, hereafter Paper I), we derived a new criterion to determine when the hot halo forms, based on the fraction of gas accreting on to haloes that shock-heats to the halo virial temperature (i.e. hot accretion) and on the hot halo gas mass. We calculated a heating rate produced by accretion shocks and compared it to the gas cooling rate. We found that haloes with masses above the critical mass threshold of 1011.7 M⊙ are able to develop a hot stable hydrostatic atmosphere, in agreement with previous work (e.g. Birnboim & Dekel 2003; Dekel & Birnboim 2006). In Paper I, we showed that feedback affects the mass-scale of hot halo formation and impacts the distribution of gas in the halo. In this work, we make use of the analytic heating and cooling rates from Paper I and assume that there are two modes of galaxy gas accretion, hot and cold.
This work is organized as follows. In Section 2 (as well as in Appendix A), we describe the numerical simulations used and the methods we employ to measure gas accretion rates. In Section 3, we analyse the total gas accretion rates on to galaxies from the EAGLE simulations as a function of halo mass and redshift, as well as the hot and cold modes of accretion (Section 3.2), and the impact of stellar and AGN feedback (Sections 3.3 and 3.4, respectively). In Section 4, we derive a physically motivated model of gas accretion on to galaxies, we show that the model reproduces the gas accretion rates from the EAGLE simulations, and we analyse the role of AGN in the rates of gas cooling from the hot halo. Finally, we summarize and conclude in Section 5.
2 SIMULATIONS
The EAGLE simulation suite (Crain et al. 2015; Schaye et al. 2015) was run using a modified version of GADGET-3 (Springel 2005), an N-Body Tree-PM smoothed particle hydrodynamics (SPH) code, but with a new formulation of SPH, new time stepping, and new subgrid physics. The simulations assume a ΛCDM cosmology with the parameters given by Planck-1 data (Planck Collaboration XVI 2014), Ωm = 1 − ΩΛ = 0.307, Ωb = 0.04825, h = 0.6777, σ8 = 0.8288, ns = 0.9611, and are run from redshift z = 127 to z = 0. Throughout this work, we use simulations with different box sizes (ranging from 25 to 100 comoving Mpc) and particle numbers (ranging from 2 × 3763 to 2 × 15043), but the same resolution. For clarity, the simulation names contain strings of the form LxxxNyyyy, where xxx is the simulation box size in comoving Mpc and yyyy is the cube root of the number of particles per species (where the number of baryonic particles is equal to the number of dark matter particles).
For our analysis, we mainly use the L100N1504 reference model (hereafter Ref), which contains an initial baryonic particle mass of 1.81 × 10⁶ M⊙, a dark matter particle mass of 9.70 × 10⁶ M⊙, a comoving (Plummer equivalent) gravitational softening of 2.66 comoving kpc, and a maximum physical softening of 0.7 proper kpc. Although the Ref model was calibrated without considering gas properties, it is able to reproduce the cosmic H i column density distribution and circumgalactic covering fraction profiles (Rahmati et al. 2015, 2016) and the neutral gas mass and profiles (Bahé et al. 2016). Note, however, that the H i masses of present-day dwarf galaxies are underestimated (Crain et al. 2017).
In order to investigate the impact of feedback on the rates of galaxy gas accretion, we additionally use simulations with varying AGN and stellar feedback prescriptions. In the stellar feedback case, we use simulations with ‘Less/More Energetic Stellar FB’, which means that the energy injected per unit mass of stars formed is half/twice the amount used in Ref. In the AGN case, we use ‘No AGN FB’ and ‘More Explosive AGN FB’, meaning that AGN feedback is switched off or is more explosive and intermittent than the Ref model, respectively (but note that in the latter case, the energy injected per unit mass accreted by the black hole does not change with respect to Ref). See Table 1 for reference. In Appendix A (also in Paper I), we include a brief description of the modelling of the EAGLE simulations, but see Schaye et al. (2015) and Crain et al. (2015) for more details. The EAGLE simulations are publicly available; for details, see McAlpine et al. (2016).
List of simulations. From left-to-right, the columns show simulation name; comoving box size; number of dark matter particles (there are equally many baryonic particles), and brief description.
| Simulation name | L (|$\rm {cMpc}$|) | N | Description |
|---|---|---|---|
| Ref | 100 | 15043 | Ref. stellar & AGN feedback |
| No AGN FB | 50 | 7523 | Ref. stellar & no AGN feedback |
| More Explosive AGN FB | 50 | 7523 | Ref. stellar & more explosive and intermittent AGN feedback |
| (but same energy injected per unit mass accreted by the BH as Ref) | |||
| More Energetic Stellar FB | 25 | 3763 | Twice as much energy injected per unit stellar mass with respect to |
| Ref & ref. AGN feedback | |||
| Less Energetic Stellar FB | 25 | 3763 | Half as much energy injected per unit stellar mass with respect to |
| Ref & ref. AGN feedback | |||
| No Stellar FB | 25 | 3763 | No stellar feedback & ref. AGN feedback |
| No Stellar/AGN FB | 25 | 3763 | No stellar feedback & no AGN feedback |
Dark matter haloes in EAGLE (and the self-bound substructures within them associated with galaxies) are identified using the Friends-of-Friends (FoF) and subfind algorithms (Springel, White & Hernquist 2001; Dolag et al. 2009). The virial masses and radii are determined using a spherical overdensity routine within subfind, centred on the minimum gravitational potential of the main subhalo from the FoF group. Halo masses (M200) are defined as the total mass within a radius, R200, within which the mean density is 200 times the critical density. In each FoF halo, the ‘central’ galaxy is the galaxy closest to the centre (minimum of the potential), which is usually the most massive. The remaining galaxies within the FoF halo are its satellites. Throughout this work, we focus on the gas accretion rates on to central galaxies. The gas accretion rates on to satellite galaxies differ from the rates on to centrals because they are strongly suppressed by environmental effects, such as ram pressure or tidal stripping. For details of these effects on gas accretion rates on to satellite galaxies from EAGLE, see van de Voort et al. (2017).
2.1 Methodology
In this section, we describe the methodology we employ to calculate the gas accretion rates on to galaxies at the centre of dark matter haloes. We begin by building merger trees across the simulation snapshots.1 At each output redshift, we select haloes that contain more than 1000 dark matter particles (which corresponds to a minimum halo mass of M200 = 109.8 M⊙ in the Ref-L100N1504 simulation). This particle number-cut is based on the convergence analysis presented in Appendix B, where we find that in smaller haloes, the accretion on to galaxies does not converge, indicating that the inner galaxies are not well resolved (see Appendix B for a discussion). We refer to these haloes as ‘descendants’, and link each descendant with a unique ‘progenitor’ at the previous output redshift. This is non-trivial due to halo fragmentation: subhalos of a progenitor halo may have descendants that reside in more than one halo. The fragmentation can be spurious or due to a physical unbinding event. To correct for this, we link the descendant to the progenitor that contains the majority of the descendant’s 25 most bound dark matter particles (see Correa et al. 2015b for an analysis of halo mass history convergence using the mentioned criteria to connect haloes between snapshots). To calculate the gas accretion on to haloes, we perform a particle ID matching between particles within linked haloes from consecutive snapshots. Particles that are new to the system, and are within the virial radius, are labeled as accreted particles in the redshift range zi < z < zj.
Different methods have been employed to determine gas accretion on to galaxies. For example, Faucher-Giguère et al. (2011) measured accretion rates through shells of prescribed radii. In order to differentiate outflows from inflowing material, they added the particles within a given shell and defined the net accretion as |$\dot{M}\propto \sum _{\mathit{ \mathrm{ p}}} M_{\mathrm{ p}}{{\bf \mathit{ \mathbf{ \mathit{ \bm{ v}}}}}}_{\mathrm{ p}}/\Delta r_{\mathrm{ p}}$| (with Mp the particle mass, vp the velocity vector, and Δrp the thickness of shell). They classified the net accretion rates as inward or outward according to the direction of the velocity vector. A different approach was used by van de Voort et al. (2017) who, in order to separate the galaxy from the halo, used a radial cut of 30 pkpc and a cut in the hydrogen number density (|$n_{\rm {H}}>0.1\rm {cm}^{-3}$|) to define the interstellar medium (ISM) (see also van de Voort et al. 2011). They considered particles that are star-forming and part of the ISM at zi, but which were gaseous and not part of the ISM at zj to have been accreted on to a galaxy at zi < z < zj. Similarly, Nelson et al. (2013) made use of a density–temperature (ρ–T) cut criterion (log10(T/K) − 0.25log10(ρ/ρcrit, z = 0) < 4.11, with ρcrit, z = 0 the critical density today), along with a radial cut (<0.15 × R200). They considered a gas element to have accreted on to a galaxy if it belonged to that galaxy at zj, and either crossed the phase-space cut in ρ–T or the radial cut during zi < z < zj.
In this work, we closely follow the method of van de Voort et al. (2017) and define the ISM to consist of all particles within a sphere of radius 0.15 × R200 (centred on the minimum of the gravitational potential) that are either star-forming (i.e. have |$n_{\rm {H}}>n^{*}_{\rm {H}}=0.1\,{\rm {cm}}^{-3}(Z/0.002)^{-0.64}$|, with Z metallicity, and T < 100.5TEoS, with TEoS ∝ ρ1/3 a temperature floor that corresponds to the equation of state and is normalized to TEoS = 8 × 10³ K at nH = 10−1cm−3) or part of the atomic ISM (i.e. have |$n_{\rm {H}}>0.1{\rm {cm}}^{-3}$| and |$T \lt 10^{5}\rm {K}$|). We next calculate three rates of gas accretion on to 0.15 × R200: gas accretion of all gas particles that cross the 0.15 × R200 radius between zi < z < zj (hereafter |$\dot{M}_{0.15R_{200}}$|), gas accretion of only star-forming particles (|$\dot{M}_{\rm {SFR}>0}$|), and gas accretion of only gas particles that form part of the ISM (|$\dot{M}_{\rm {ISM}}$|). In all the rates, we are including star particles that were gas particles in the previous output but turned into stars during the time step between the snapshots.
Note that |$\dot{M}_{\rm {SFR}>0}$| and |$\dot{M}_{\rm {ISM}}$| refer to gas accretion on to the star-forming and ISM components within 0.15 × R200, and that |$\dot{M}_{\rm {ISM}}$| includes |$\dot{M}_{\rm {SFR}>0}$|. Also note that the accreting gas is possibly, but not necessarily, star-forming prior to accretion. We further define |$\dot{M}_{\rm {0.15\mathit{ R}_{200}}}$| as the rate of gas accretion on to galaxies (hereafter |$\dot{M}_{\rm {gas,galaxy}}=\dot{M}_{\rm {0.15\mathit{ R}_{200}}}$|), because we assume that the ‘galaxy’ extends beyond the ISM.
To summarize, |$\dot{M}_{\rm {gas,galaxy}}$| refers to the accretion rate of gas that crosses the radial boundary 0.15 × R200 during zi < z < zj, |$\dot{M}_{\rm {ISM}}$| considers gas that crosses the radial boundary and the phase-space cut nH−T or is star-forming during zi < z < zj, and |$\dot{M}_{\rm {SFR}>0}$| considers gas that crosses the radial boundary during zi < z < zj and is star-forming at zi. Note that in each case, we calculate the accretion rates by adding the mass of all the accreted particles (following the condition of accretion) on to individual galaxies and dividing by the time interval (i.e. ∼1.34 Gyr at z = 0 and ∼0.33 Gyr at z = 2). The final rates given are the median accretion rates on to galaxies in bins of halo mass. Note that we calculate the ‘net’ rate of gas accretion between two consecutive snapshots, i.e. we do not separate gas that is accreted for the first time or re-accreted.
Gas particles that fall into galaxies can be classified as gas introduced to the system by a merger event or through smooth accretion. Mergers have been defined as the accretion of particles that belonged to any resolved subhalo at the previous snapshot (e.g. Kereš et al. 2009; Nelson et al. 2013) or to subhalos with masses above 1/10th of main progenitor mass (e.g. van de Voort et al. 2011). It has been found that the specific gas accretion rate on to haloes through mergers is much lower than the specific smooth accretion rate, except for high-mass haloes (M200 ≳ 1014 M⊙) at z = 0 (van de Voort et al. 2011). In the case of galaxies at z = 2, gas from all resolved merger events can contribute as much as |$60\hbox{ per cent}$| to the total galaxy accretion rate at all halo masses (Nelson et al. 2013). At lower redshifts, the contribution decreases and the gas supply from resolved mergers appears to be only important at the high-mass end (Kereš et al. 2009). In this work however, we do not focus on the origin of the gas that falls into galaxies. Instead, we investigate the physics that prevents gas from cooling.
Fig. 1 shows |$\dot{M}_{\rm {gas,galaxy}}$| (blue solid line), |$\dot{M}_{\rm {ISM}}$| (blue long-dashed line), and |$\dot{M}_{\rm {SFR}>0}$| (blue dot–dashed line), as a function of halo mass, taken from the Ref-L100N1504 simulation. For comparison, the figure also shows the gas accretion rate on to haloes (i.e. crossing R200, black dashed line). In the halo mass range 1010–1012 M⊙, |$\dot{M}_{\rm {gas,galaxy}}$| and |$\dot{M}_{\rm {ISM}}$| increase with halo mass at approximately the same rate, with |$\dot{M}_{\rm {ISM}}$| having a 0.3 dex (on average) lower normalization than |$\dot{M}_{\rm {gas,galaxy}}$|. For halo masses greater than 1012 M⊙, |$\dot{M}_{\rm {ISM}}$| remains roughly constant. While |$\dot{M}_{\rm {gas,galaxy}}$| also flattens in 1012 M⊙ haloes, it increases with halo mass for ≳ 1013 M⊙ haloes. |$\dot{M}_{\rm {SFR}>0}$| behaves similarly to |$\dot{M}_{\rm {ISM}}$|, though it is (on average) a factor of 2 lower. In the figure, the grey and cyan shaded regions enclosing the median values of |$\dot{M}_{\rm {gas,galaxy}}$| and |$\dot{M}_{\rm {ISM}}$| correspond to the 1σ scatter (16–84th percentiles).
From Fig. 1, it can be seen that in the halo mass range 1010–1012 M⊙, roughly |$50\hbox{ per cent}$| of the gas crossing 0.15R200 joins the ISM. At higher halo masses, the fraction of gas crossing 0.15R200 that joins the ISM decreases and most of the gas that reaches the inner halo has either a low density (nH < 0.1 cm−3) or a high temperature (>105 K). We then conclude that massive galaxies accrete warm diffuse gas that does not fall into the ISM.
In the following sections, we investigate the way gas crosses the CGM and the origin of |$\dot{M}_{\rm {gas,galaxy}}(M_{200})$| further by first disentangling the impact of stellar and AGN feedback (Sections 3.3 and 3.4, respectively). In addition, we calculate the fraction of hot/cold modes of gas accretion on to galaxies in Section 3.2. To estimate these modes of gas accretion, previous studies followed the temperature history of the accreted gas (see e.g. Faucher-Giguère et al. 2011; van de Voort et al. 2011); however, in Paper I, we concluded that selecting gas particles according to their temperature just after accretion, Tpost-shock, is a better method to determine hot/cold accretion. This is because it excludes gas particles that go through a shock but immediately cool afterwards, or that did not pass through an accretion shock but instead were heated in the past by stellar feedback and have since cooled. Then, throughout this work, we define the fraction of gas particles accreted hot, facc, hot, as the fraction of particles that after being accreted have temperatures larger than |$T_{{\textrm {post-shock}}} = 10^{5.5}\rm {K}$|. Note that for low-mass haloes, the results are sensitive to this specific temperature threshold (e.g. van de Voort et al. 2011). For an analysis of how the hot mode of accretion depends on the temperature threshold, as well as on other criteria (e.g. Tvir, cooling times), see sections 2.2 and 4 of Paper I.
3 GAS ACCRETION RATES
In this section, we calculate the rates of gas accretion on to haloes and galaxies from the EAGLE simulations. For a detailed analysis of the numerical convergence of our results, see Appendix B.
3.1 Accretion rates on to galaxies and haloes
Fig. 2 shows the total gas accretion rate on to haloes (bottom left-hand panel) and on to galaxies (bottom right-hand panel) over many redshift intervals. The solid lines correspond to the median gas accretion rates from the Ref-L100N1504 simulation. The figure shows the median accretion rates of haloes separated in logarithmic mass bins of 0.2 dex. The dashed lines correspond to the analytic accretion rates from Correa et al. (2015a,c) multiplied by the universal baryon fraction (fb = 0.157). In the figure, all the curves are coloured according to the redshift interval, as indicated in the legends. The top panels show the 1σ scatter of |$\dot{M}_{\rm {gas,halo}}$| (top-left) and |$\dot{M}_{\rm {gas,galaxy}}$| (top-right) for each mass bin.
We find that the z = 0 accretion rate on to haloes deviates from the analytic prediction of Correa et al. (2015c). The prediction is 0.8 dex too high for 1010 M⊙ haloes, agrees for 1011.5 M⊙ haloes, and is 0.3 dex too low for 1013 M⊙ haloes. In the redshift range z = 1−2, the prediction is also ∼0.8 dex too high for 1010 M⊙ haloes, but a better agreement is reached for haloes more massive than 1012 M⊙. At higher redshifts, the disagreement between the analytic prediction and the simulation output increases, with the prediction being up to 0.5 dex too high for all halo masses at z = 8.
A possible explanation for the difference in the halo accretion rates between the Ref model (solid lines in left-hand panel of Fig. 2) and the analytic prediction of Correa et al. (2015c) (dashed lines) is that the analytic model does not consider the impact of baryon physics (such as gas pressure, cooling, reionization, and stellar and AGN feedback), which reduces the halo mass by a factor of 0.7 for 1010 M⊙ haloes at z = 0 (Schaller et al. 2015b) and ∼0.6 for all haloes at z > 6 (Qin et al. 2017). However, in low-mass haloes, the disagreement between the analytic model and the simulation output is expected, because at these masses the extragalactic ultraviolet (UV)/X-ray background radiation heats the surrounding gas and prevents it from falling into the halo (e.g. Sawala et al. 2013; Benítez-Llambay et al. 2017).
The bottom right-hand panel of Fig. 2 shows that the gas accretion rate on to galaxies is much lower than that on to haloes. The dependence on mass is also quite different. Although the galaxy accretion rate initially increases with halo mass, it flattens in the halo mass range 1011.7–1012.7 M⊙, particularly at z ≤ 2. We believe that the flattening is produced by the presence of the hot halo atmosphere, which forms in 1011.7 M⊙ haloes (Paper I). In Section 4.1, we investigate this further by deriving an analytic model that includes the heating and cooling rates of gas from the hot halo.
The galaxy accretion rates calculated in this work differ from those found in other simulations (Kereš et al. 2005; Ocvirk et al. 2008; Faucher-Giguère et al. 2011; van de Voort et al. 2011; Nelson et al. 2013). To mention a few estimates, van de Voort et al. (2011) obtained accretion rates on to the ISM of ∼1, 10, and 15 M⊙ yr−1 in 1012, 1012.5, and 1013 M⊙ haloes, respectively, at z = 0. Faucher-Giguère et al. (2011) found rates of cold accretion (gas particles with hydrogen number density lower than 0.13 |$\rm {cm}^{-3}$| and past maximum temperature lower than 2.5 × 10⁵ K) on to 0.2R200 of 0.3 and 1 M⊙ yr−1 in 1012 and 1013 M⊙ haloes, respectively, at z = 0, respectively. Similarly, Nelson et al. (2013) obtained total rates of galaxy smooth gas accretion of 1 and 5 M⊙ yr−1 in 1011 and 1012 M⊙ haloes, respectively, at z = 0. As discussed in Section 2.1, these works differ on the method employed to calculate the rates of gas accretion; therefore, we do not expect good agreement, but we find that our results closely follow those of van de Voort et al. (2011).
Note that the rates of galaxy and halo gas accretion in this work are calculated counting new gas particles within 0.15 × R200 and R200, respectively. It is then possible that halo pseudo-evolution (the growth in halo mass due to the redshift evolution of the reference density, e.g. Diemer, More & Kravtsov 2013) affects the rates of accretion. This occurs if gas particles not inflowing relative to the physical density profile of the halo appear to accrete when R200 increases due to pseudo-evolution from one snapshot to the next. We next analyse this possibility. In this work, we calculate the gas accretion rates within time intervals of up to ≈1.3 Gyr (e.g. between redshifts 0 and 0.1). We test this by calculating the gas accretion rates on to a fixed proper radius given by rgal = 0.15R200(z = 0). We obtain that when the radius is kept fixed, the accretion rate decreases (on average) |$9\hbox{ per cent}$| for 1010–1013 M⊙ haloes, to a maximum of |$13\hbox{ per cent}$| for 1011.6 M⊙ haloes. We conclude that the change in radius due to pseudo-evolution is not large enough to affect our results significantly.
3.2 Hot and cold modes of accretion
In Paper I, we calculated the fractions of hot and cold modes of gas accretion on to haloes using the EAGLE simulations and found that the hot fraction increases smoothly with halo mass (from 0.1 for 1011.5 M⊙ haloes to 0.7 for 1012 M⊙ haloes at z = 0) and decreases with increasing redshift (from 0.5 in 1012 M⊙ haloes at z = 1 to 0.2 at z = 2). In this section, we extend this analysis by focusing on the modes of gas accretion on to galaxies. We select gas particles using the radial cut (0.15 × R200) and separate the hot and cold modes by applying a temperature cut of 105.5 K (see Section 2.1 for a description on how we calculate hot/cold gas accretion). Throughout this work, we label the fractions of hot/cold modes of gas accretion on to galaxies as |$f^{\rm {galaxy}}_{\rm {acc,hot/cold}}$| and on to haloes as |$f^{\rm {halo}}_{\rm {acc,hot/cold}}$|.
The top panel of Fig. 3 shows the median fraction of gas accretion on to galaxies, |$f^{\rm {galaxy}}_{\rm {acc,hot}}$|, as a function of halo mass for different redshifts. The fractions were taken from the Ref-L100N1504 simulation and the error bars in the figure show the 1σ scatter. We find that in >1012.8 M⊙ haloes at z = 0 (>1013.3 M⊙ haloes at z = 1), |$\dot{M}_{\rm {gas,galaxy}}$| changes from being cold-mode dominated to hot-mode dominated, and at fixed halo mass |$f^{\rm {galaxy}}_{\rm {acc,hot}}$| decreases with increasing redshift. This is expected, since at low redshift there are fewer cold filaments penetrating the hot halo and delivering cold gas within galaxies (see Paper I, Section 3).
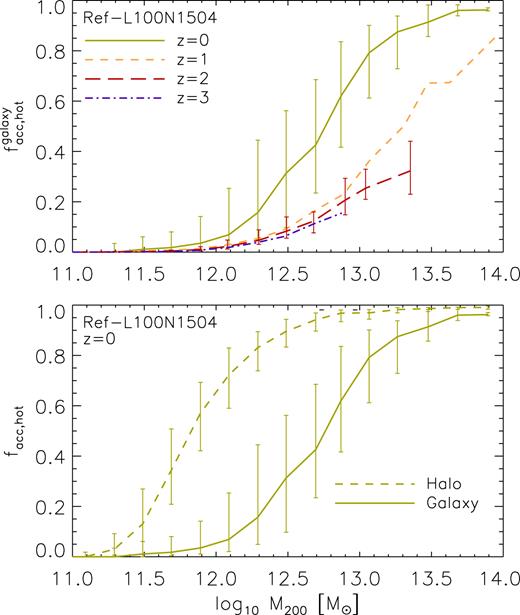
Top panel: median fraction of gas accreted in the hot mode on to galaxies as a function of halo mass in the redshift ranges 0 ≤ z < 0.1 (green solid line), 1 ≤ z < 1.26 (orange dashed line), 2 ≤ z < 2.24 (red long-dashed line), and 3 ≤ z < 3.53 (purple dot–dashed line). Bottom panel: Fraction of gas accreted in the hot mode on to galaxies (solid line) and on to haloes (dashed line) as a function of halo mass in the redshift range 0 ≤ z < 0.1. The error bars in the figure show the 1σ scatter. We find that while hot accretion on to haloes dominates in haloes more massive than 1011.8 M⊙, hot accretion on to galaxies only dominates for haloes more massive than >1012.8 M⊙ at z = 0.
In Paper I, we compared two different methods to select particles accreted hot or cold based on the maximum temperature (Tmax) ever reached by the gas particle and the temperature (Tpost-shock) of the gas particle after being accreted. By applying the Tmax method, which is the most commonly used (e.g. Kereš et al. 2005, 2009; Faucher-Giguère et al. 2011; van de Voort et al. 2011; Nelson et al. 2013), we find that the fraction of hot accretion on to haloes is in very good agreement with that in van de Voort et al. (2011), as it decreases with increasing redshift at fixed halo mass (see Paper I for a detailed comparison). However, the hot accretion fraction on to galaxies calculated in this work appears to deviate strongly from previous works that claimed that there is almost no cold accretion on to galaxies at z ∼ 2. For example, Nelson et al. (2015) (as well as Kereš et al. 2009) found that at z = 2, cold accretion of external diffuse gas accounts for only |$10\hbox{ per cent}\,(30\hbox{ per cent}$|) of the total accretion on to central galaxies of 1012 M⊙ haloes without (with) AGN/stellar feedback. Nelson et al. (2015) used simulations run with the arepo code (Springel 2010) and defined gas to be in the hot mode of accretion if the maximum past temperature of the gas was larger than the virial temperature of the host halo at the accretion time (time of the most recent radial crossing). In Paper I, as well as throughout this work, we apply the Tpost-shock method, based on the temperature of the gas particle after accretion, to calculate the hot/cold modes of gas accretion. We find that cold accretion on to galaxies in 1012 M⊙ haloes accounts for |$50\hbox{ per cent}$| (|$70\hbox{ per cent}$|) of the total at z = 0 (z = 2) using the Tmax criteria, but it accounts for |$95\hbox{ per cent}$| (|$98\hbox{ per cent}$|) using the Tpost-shock criteria.
We believe that Tmax is less suitable for identifying cold gas accretion for the following reasons. First, it is possible for gas to go through a shock but immediately cool afterwards. In this case, if gas is mostly cold except at a point in space and for a short period of time, numerical studies using Tmax would label it as hot accretion but observations would indicate a cold flow. Secondly, outflows can heat the surrounding gas particles, which can reach high temperatures while being expelled from the galaxy. Such particles eventually cool and are re-accreted on to the galaxy. However, even if they do so via the cold mode, they are classified as hot mode accretion by the Tmax criterion (for more details, see Paper I).
The bottom panel of Fig. 3 shows a comparison between the fraction of gas accreted hot on to haloes (solid line) and on to galaxies (dashed line) at z = 0. It can be seen that while |$70\hbox{ per cent}$| of the gas crosses R200 in hot mode for 1012 M⊙ haloes, less than |$5\hbox{ per cent}$| crosses 0.15 × R200 in hot mode and reaches the galaxy. However, this changes in higher mass haloes. In 1013 M⊙ haloes, for instance, while |$98\hbox{ per cent}$| of the gas crosses R200 in hot mode, |$80\hbox{ per cent}$| crosses 0.15 × R200 in hot mode. The increasing amount of warm low-density gas that reaches the galaxies in high-mass haloes seems to indicate that while the hot halo forms in 1011.7 M⊙ haloes (see Paper I for details), the cooling flow from the hot halo develops in haloes with masses between 1012 and 1013 M⊙.
Note that a change in the temperature threshold not only modifies the fraction of hot mode accretion, but also the mass-scale at which the hot halo forms. In Paper I, we develop a SAM to estimate a ‘critical halo mass’ for hot halo formation that depends on the build-up of the hot gas mass in the halo as well as on facc, hot. We show that changing facc, hot from 1 to 0.5 increases the mass-scale of hot halo formation from 1011.4 to 1011.7 M⊙, respectively (see section 5.3.1 and fig. 12 of Paper I for further details). In the following sections, we show that the halo mass at which the hot halo cooling flow develops depends strongly on AGN feedback, but not on stellar feedback.
3.3 Impact of stellar feedback
It has been shown that the inflow rate of gas on to galaxies sensitively depends not only on definition (as discussed in Section 2.1), but also on feedback physics (e.g. Oppenheimer et al. 2010; Faucher-Giguère et al. 2011; van de Voort et al. 2011; Übler et al. 2014; Nelson et al. 2015). Recently, Nelson et al. (2015) compared two simulations run with the arepo code. While one included energetic feedback from star formation driven winds as well as supermassive black holes, the other did not include any treatment of metal-line cooling, stellar or black hole feedback. They found that feedback strongly suppresses the net accretion rate on to central galaxies (counted as the number of gas tracers crossing the radius 0.15R200): by a factor of ∼3 at z = 5 and a factor of ∼10 at z = 1. A similar conclusion was reached by van de Voort et al. (2011), who showed that the effects of stellar feedback and metal-line cooling are much stronger for accretion on to galaxies than for accretion on to haloes, and can result in differences of an order of magnitude.
In scenarios with energetic stellar feedback, the net galaxy accretion rates can be higher due to ‘recycling accretion’. Stellar-driven winds blow gas out of the galaxy, but not out of the halo; as a result, the same gas elements are accreted on to the galaxy multiple times (Oppenheimer et al. 2010; see also van de Voort 2017 for a recent review). Übler et al. (2014) implemented a hybrid thermal/kinetic stellar feedback scheme and calculated the gas accretion histories on to discs as a function of cosmic time. They found that the amount of re-accreted gas can be a factor of 10 larger in the strong feedback models with respect to the weak feedback models, and tends to dominate the net accretion at z < 1.
To investigate the effect of stellar feedback on the gas accretion rate on to galaxies from the EAGLE simulations, we compare the reference model with identical resolution simulations (the L025N0376 model) that include more/less energetic stellar feedback, no stellar feedback, and no stellar/no AGN feedback (referred to as More/Less Energetic Stellar FB, No Stellar FB, and No Stellar/AGN FB, respectively). The Ref, More/Less Energetic Stellar FB, and No Stellar FB simulations employ the same feedback prescription and choice of parameters for AGN feedback, but the energy budget expelled by the stellar feedback is varied, and in the last case (No Stellar FB) stellar feedback is switched off. In the case of the No Stellar/AGN FB simulation, both stellar and AGN feedback are switched off.
In the EAGLE simulations, the probability for a neighbouring SPH particle to be heated by stellar outflows is determined by the fraction of the energy budget available for feedback, fth, which is defined as fth=fth, min + f(Z, nH)(fth, max − fth, min) (with fth, max, fth, min the maximum and minimum asymptotic values and f(Z, nH) a function of the gas metallicity and density). In the Ref model, fth, max = 3.0 and fth, min = 0.3, whereas in the More/Less Energetic FB models the thresholds are fth, max = 6.0 and fth, min = 0.6 for the More Energetic Stellar FB case, and fth, max = 1.5 and fth, min = 0.15 for the Less Energetic Stellar FB case, respectively. This does not mean that stellar-driven winds are stronger/weaker or blow more/less gas out of the galaxy, but rather that in the More/Less Energetic Stellar FB model the energy injected per unit mass of stars formed is twice/half of the amount used in the Ref model.
The top panel of Fig. 4 shows the gas accretion rate on to galaxies at the centres of dark matter haloes, as a function of halo mass in the redshift range 0 ≤ z < 0.1. From the panel, it can be seen that |$\dot{M}_{\rm {gas,galaxy}}$| from the More Energetic Stellar FB model is (on average) a factor of 2 lower than |$\dot{M}_{\rm {gas,galaxy}}$| from Ref, but it increases for galaxies in haloes larger than 1012 M⊙ (by up to a factor 4 larger than Ref for galaxies in 1012.7 M⊙ haloes), suggesting that at these halo masses, galaxies re-accrete gas that was ejected by stellar feedback in lower mass progenitors. When stellar feedback is half as energetic, |$\dot{M}_{\rm {gas,galaxy}}$| decreases by up to 0.6 dex compared to Ref for galaxies in ≥1011 M⊙ haloes. A possible reason for this difference is a lower rate of re-accreted gas or a more efficient AGN feedback at lower halo masses. The latter is also due to the less energetic stellar feedback. Bower et al. (2017) showed that in EAGLE stellar feedback limits BH growth in low-mass haloes. If stellar feedback is half as energetic, the central BH is able to start growing earlier, thus producing more efficient AGN feedback.
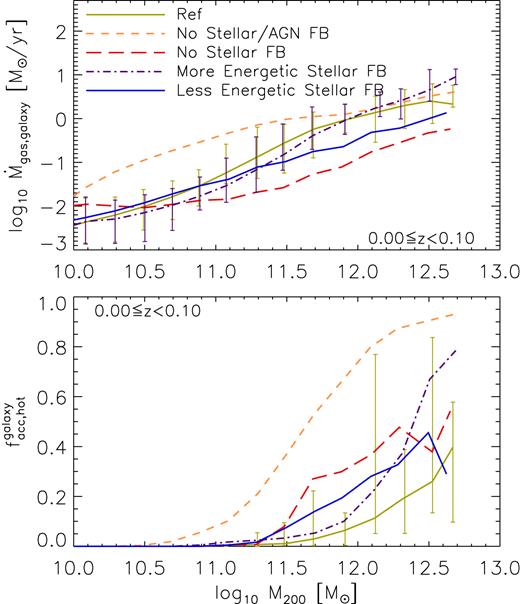
Top panel: Gas accretion rate on to central galaxies as a function of halo mass. Bottom panel: fraction of hot mode gas accretion on to central galaxies as a function of halo mass in the redshift range 0 ≤ z < 0.1. The panels compare the median accretion rates/hot fractions from simulations with the same resolution (L025N0376 box), but with varying feedback models. These include standard stellar feedback (Ref, solid green line), more energetic stellar feedback (purple dot–dashed line), less energetic stellar feedback (blue solid line), no stellar feedback (red long-dashed line), and no stellar/AGN feedback (orange dashed line). The error bars show the 16–84th percentiles. Depending on the halo mass, changes in the efficiency of stellar feedback can either increase or decrease the accretion rates on to galaxies.
The panel also shows that when stellar feedback is switched off, AGN feedback affects the gas accretion rates on to galaxies residing in low-mass haloes. We find that for galaxies in ≥1010.5 M⊙ haloes, |$\dot{M}_{\rm {gas,galaxy}}$| decreases by up to 1.5 dex relative to Ref. When there is no stellar feedback, the central black hole in low-mass galaxies is able to grow by more than 1 order of magnitude with respect to the Ref model (Bower et al. 2017). Thus, the outflows expelled by a much more massive black hole suppress the gas infall rates in low-mass galaxies. Indeed, when both stellar and AGN feedback are turned off, there is no mechanism that prevents gas from cooling. Therefore, the rates of gas accretion are higher by up one dex than in Ref.
We also analyse whether the trends described in Fig. 4 depend on redshift. We obtain that they do not; at z = 2, the trends are consistent with the z = 0 results.
The bottom panel of Fig. 4 shows the fraction of gas accreted in the hot mode on to central galaxies as a function of halo mass. In the models, stellar feedback can either increase or decrease facc, hot by generating winds that heat the gas (before or after accretion). We find that the trend of hot fraction with feedback variation is very complex and difficult to predict. Interestingly, it is nonetheless the No Stellar/AGN FB model that has the highest hot fractions, by up to an order of magnitude larger than the Ref model. This suggests that feedback preferentially prevents hot gas from reaching the galaxy. This is expected because energy-driven winds will take the path of least resistance, thus avoiding the cold streams (e.g. Theuns et al. 2002).
Note that in this work, the cold/hot temperature cut we used to separate cold from hot accretion is applied after accretion on to the galaxy. Therefore, it could happen that the hot fraction artificially increases due to heating by stellar feedback, even though Fig. 4 seems to indicate otherwise.
3.4 Impact of AGN feedback
To understand how AGN feedback alters |$\dot{M}_{\rm {gas,galaxy}}$| in massive haloes, we compare simulations that include the same stellar feedback scheme but different prescription for AGN feedback, varying from no AGN feedback (No AGN FB), standard AGN feedback (Ref model), to more explosive AGN feedback (More Explosive AGN FB). In the EAGLE simulations, the difference between the Ref and More Explosive AGN FB simulations is the temperature increment of stochastic AGN heating (ΔTAGN), which is ΔTAGN = 108.5 K in the Ref model and ΔTAGN = 109.0 K in the More Explosive AGN FB model. This means that the AGN feedback is more explosive and intermittent, but the energy injected per unit mass accreted by the BH does not change with respect to the Ref model.
Fig. 5 shows |$\dot{M}_{\rm {gas,galaxy}}(M_{200})$| for the different models in the redshift range 0 ≤ z < 0.1 (top panel) and 2 ≤ z < 2.24 (middle panel). For comparison, the panels also show the gas accretion rate on to haloes (i.e. within R200 as taken from the Ref model) as grey solid lines. Note that the More Explosive AGN FB and No AGN FB models were run in 50 Mpc volumes, so those do not contain haloes more massive than 1013.5 M⊙. The top panel shows that at z = 0, AGN feedback suppresses |$\dot{M}_{\rm {gas,galaxy}}$| in massive haloes (>1012 M⊙) by up to 0.6 dex in the Ref model, and up to 0.8 dex in the More Explosive AGN FB model. In the No AGN FB simulation, |$\dot{M}_{\rm {gas,galaxy}}$| does not flatten at ∼1012 M⊙ and increases with halo mass at the same rate as the gas accretion on to haloes but with a 0.5 dex lower normalization. This indicates that AGN feedback is the mechanism responsible for preventing hot gas from cooling and falling on to the central galaxies. However, the situation differs at ≈2. In this case, the middle panel shows that |$\dot{M}_{\rm {gas,galaxy}}$| flattens with increasing halo mass for 1012–1012.5 M⊙ haloes in both the Ref and the No AGN FB model. For the More Explosive AGN FB model, the flattening is however more pronounced.
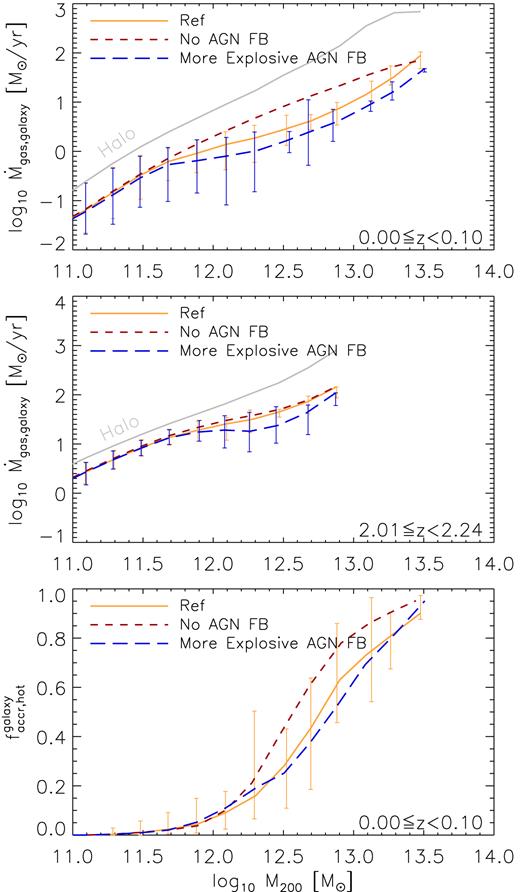
Median gas accretion rate on to central galaxies as a function of halo mass in the redshift range 0 ≤ z < 0.1 (top panel) and 2 ≤ z < 2.2 (middle panel). The top and middle panels compare accretion rates from same-resolution simulations (L050N0752) but with standard AGN feedback (Ref, solid orange line), No AGN feedback (red short-dashed line), and more explosive AGN feedback (blue long-dashed line). The solid grey lines correspond to median gas accretion rate on to haloes as a function of halo mass in the redshift range 0 ≤ z < 0.1 (top panel) and 2 ≤ z < 2.2 (middle panel). The bottom panel compares the same simulations, but shows the median fraction of gas accreted on to galaxies in the hot mode as a function of halo mass at 0 ≤ z < 0.1. Error bars show the 16–84th percentiles. When AGN feedback is switched off, |$\dot{M}_{\rm {gas,galaxy}}$| does not flatten at ∼1012 M⊙ and increases with halo mass at the same rate as the gas accretion on to haloes but with a lower normalization. This shows that AGN feedback is the mechanism responsible for preventing hot gas from cooling and falling on to central galaxies in massive haloes.
We believe that the flattening of |$\dot{M}_{\rm {gas,galaxy}}$| in massive haloes (>1012 M⊙) at z = 0 can be explained by the rate of gas cooling from the hot halo. A hot hydrostatic atmosphere is formed in ∼1011.7 M⊙ haloes (Paper I) as a result of heating by accretion shocks. Some time after the hot halo is formed, gas begins to cool and fall on to the central galaxy, but it can also be reheated or be prevented from accreting by AGN feedback. When there is no AGN feedback preventing the shock-heated gas in the halo from cooling, the hot gas is able to cool over a short time-scale. As a result, a larger amount of gas cools from the hot halo raising |$\dot{M}_{\rm {gas,galaxy}}$| in the No AGN FB model with respect to the Ref model. This can also be seen from the bottom panel of Fig. 5, which shows the fraction of gas accreted on to galaxies in the hot mode as a function of halo mass for the different simulations. We find that the hot fraction does not depend strongly on the explosiveness of AGN feedback, but it does increase if AGN feedback is turned off. This indicates that a larger fraction of gas cooling from the hot halo is able to reach the galaxy without AGN feedback.
We further explore the validity of this hypothesis in the following section, where we develop a SAM of the gas accretion rate on to galaxies that includes the heating and cooling rates of gas from the hot halo.
4 THE HOT HALO COOLING FLOW
In this section, we show that the increase in |$\dot{M}_{\rm {gas,galaxy}}$| with respect to |$\dot{M}_{\rm {ISM}}$| in haloes larger than 1012.5 M⊙ (see Fig. 1) can be explained by the rate of gas cooling from the hot halo. To do so, we develop a model of gas accretion on to galaxies that depends on the hot/cold fractions of gas accretion on to haloes, and on the shock-heating and cooling rates of gas from the hot halo. We briefly describe the model in the following subsection and in Section 4.2, we compare the result of the model with the simulation output.
4.1 Semi-analytic model of gas accretion on to galaxies
In equation (14), we assumed that |$\dot{M}_{\rm {cooling}}$| is determined by the rate of replenishment from hot accretion on to the halo, |$\dot{M}_{\rm {hot}}=f^{\rm {halo}}_{\rm {acc,hot}}\dot{M}_{\rm {gas,halo}}$|, and therefore |$\dot{f}^{\rm {halo}}_{\rm {acc,hot}}=0$|. These are first-order approximations accurate enough for our SAM.
To compute rcool/R200, we assume that Thot is equal to the halo virial temperature, Zhot = 0.1 Z⊙ and obtain Λ from the tabulated cooling rates given by Wiersma, Schaye & Smith (2009). In Paper I, we explored the relation between the mass-weighted median metallicity of the hot gas with halo mass and redshift, and found that Zhot ∼ 0.1 Z⊙ for 1012 M⊙ haloes at z = 0 and varies by up to a factor of 2.5 in the halo mass range 1011–1014 M⊙. We find that changing the metallicity with halo mass changes the normalization of the relation rcool/R200 − M200, but the qualitative result remains the same. Finally, we obtain |$\dot{M}_{200}$| from the analytic model of Correa et al. (2015c). Note that the various best-fitting expressions presented in this section were derived in Paper I by fitting to the results of the Ref model; therefore, they depend on simulations. For further details of the calculation of Γheat and Γcool, see Paper I. In the following section, we compare the result of the SAM with the simulation output for z = 0 only, but we have found that the model works well in the regime z = 0−4.
4.2 Results
In this section, we provide insight into the physical mechanisms that drive the gas accretion rates on to galaxies. We do so by comparing the model of galaxy gas accretion derived in the previous section with the simulation output, and analysing the model’s prediction in scenarios with and without AGN feedback. We emphasize that because the SAM uses input from the simulations, its predictions are not independent. We can, however, use it to test our physical understanding of gas accretion on to galaxies in the simulations.
The top panel of Fig. 6 shows the model’s prediction with AGN feedback (blue solid line) and without AGN feedback (blue dashed line). These are compared with the accretion rates from the Ref-L100N1504 (orange diamonds) and the No AGN FB-L050N0752 simulations (red circles). While the model accurately matches the gas accretion rates on to galaxies in haloes less massive than 1013 M⊙ from the Ref model, at higher halo masses it underpredicts the rates by up to 0.3 dex. However, the model does reproduce the qualitative trends of the flattening for 1012–1012.5 M⊙ and the upturn at higher halo masses. In the case of gas accretion rates on to galaxies from the No AGN FB simulation, the model is in excellent agreement. Note that for these models, the same ε( = 0.3) correction factor is used.
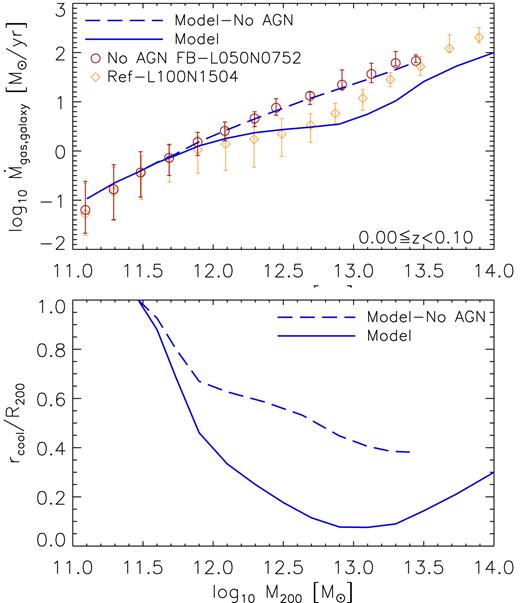
Top panel: comparison between the gas accretion rates on to galaxies derived by the SAM (blue lines) and the simulation output (symbols). The orange diamond symbols correspond to the galaxy gas accretion rate taken from the Ref-L100N1504 simulation and the error bars correspond to the 1σ scatter. The red circle symbols correspond to the gas rates from the No AGN FB-L050N0752 simulation. The blue solid line corresponds to the gas accretion model, which we calculated using the heating and cooling rates from Paper I and the density profile from Section C. Similarly, the blue dashed line corresponds to the same model but using inputs from the No AGN FB simulations. The SAM reproduces the simulation outputs. Bottom panel: analytic estimates of the cooling radius normalized by R200 as a function of halo mass at z = 0 from the same models shown in the top panel. The upturn in the ratio of the cooling and virial radii may indicate that in high-mass haloes, AGN feedback is not sufficiently efficient.
The model’s result when AGN feedback is included can be explained as follows. In haloes with masses lower than 1011.7 M⊙, |$\frac{r_{\rm {cool}}}{R_{200}}=1$|, and since |$f^{\rm {halo}}_{\rm {acc,hot}}+f^{\rm {halo}}_{\rm {acc,cold}}=1$|, equation (15) gives |$\dot{M}_{\rm {gas,galaxy}} = \epsilon \dot{M}_{\rm {gas,halo}}$|. In haloes with masses between 1011.7 and 1013 M⊙, the hot halo forms. As a result, the cooling radius is smaller than the virial radius, yielding |$f^{\rm {halo}}_{\rm {acc,hot}}r_{\rm {cool}}/R_{200}+f^{\rm {halo}}_{\rm {acc,cold}}<1$|, so that |$\dot{M}_{\rm {gas,galaxy}}$| increases less steeply than |$\dot{M}_{\rm {gas,halo}}$|, remaining almost constant with halo mass. In haloes with masses larger than 1013 M⊙, |$\frac{r_{\rm {cool}}}{R_{200}}$| increases with halo mass, indicating that the hot halo cooling flow becomes more prominent.
The bottom panel of Fig. 6 shows the ratio between the cooling radius and the virial radius, |$\frac{r_{\rm {cool}}}{R_{200}}(M_{200})$|, as a function of halo mass for the simulations with and without AGN feedback (blue solid and dashed lines, respectively). The panel shows that the ratio |$\frac{r_{\rm {cool}}}{R_{200}}(M_{200})$| does not continuously decrease towards high halo masses as is commonly thought. Mathematically, the upturn in the rcool−M200 relation can be explained by the radial slope (γ =dlnρhot-gas/dlnr) of the hot gas density profile (measured between r = 0.15 × R200 and r = R200), which changes with halo mass. The slope is roughly −2 in 1011.7 M⊙ haloes, increases to −0.86 in 1012.7 M⊙ haloes, and decreases to −0.94 and −1.7 in 1013.1 and 1013.9 M⊙ haloes, respectively. The change in the slope of ρhot-gas(r) drives the evolution of rcool/R200, and describes the evolution in the distribution of the hot halo gas as the halo grows in mass.
The increase of the cooling radius towards high halo masses may not be physical but the result of a deficiency of the simulations. Haloes in the Ref model more massive than 1013 M⊙ contain not only 0.2 dex higher gas mass fraction (derived from virtual X-ray emission) than observed group fractions (Schaye et al. 2015), but also too massive brightest cluster galaxies (Bahé et al. 2017). Since the amount of hot gas (and cooling) in the halo is sensitive to the heating temperature of AGN feedback (Le Brun et al. 2014), the disagreement with observations indicates that AGN feedback is insufficiently efficient at high halo masses.
There is a significant change in the dependence of |$\dot{M}_{\rm {gas,galaxy}}$| on halo mass when there is no AGN feedback, which seems to indicate that the hot halo does not impact the galaxy gas accretion rate. However, we find that this is not the case. When the hot halo forms, it reduces the gas mass that cools, but at a lower rate when AGN feedback is not included. To understand how |$\dot{M}_{\rm {gas,galaxy}}$| changes with and without AGN feedback, we refer to our model of gas accretion. As described in the previous section, the model uses as input (1) the gas accretion rate on to haloes (|$\dot{M}_{\rm {gas,halo}}$|), (2) the hot/cold fraction of gas accretion on to haloes (|$f^{\rm {halo}}_{\rm {acc,hot/cold}}$|), (3) the total hot gas mass in the halo (Mhot), and (4) the hot gas density profile (ρhot-gas). We obtain these inputs from two simulations, Ref-L100N1504 and No AGN FB-L050N0752, and predict |$\dot{M}_{\rm {gas,galaxy}}$| as a function of halo mass for both models. Note that the main differences between the No AGN FB and Ref model are Mhot (where Mhot from No AGN FB is larger than from Ref in the halo mass range 1011.7–1014 M⊙, by a factor of 1.4 in 1012 M⊙ haloes) and ρhot-gas (where the slope flattens but not as much as in the presence of AGN feedback, reaching a maximum of dlnρ/dlnr = −1.14 in 1012.8 M⊙ haloes from the No AGN FB model in contrast to −0.9 from the Ref model). In Paper I, we found that |$f^{\rm {halo}}_{\rm {acc,hot/cold}}$| and |$\dot{M}_{\rm {gas,halo}}$| are roughly insensitive to feedback (in agreement with van de Voort et al. 2011).
The variable from equation (15) that is responsible for the excellent match between |$\dot{M}_{\rm {gas,galaxy}}$| (no AGN) and the simulation output is rcool/R200, whose evolution differs strongly from the scenario where AGN feedback is on. In the case of no AGN, rcool/R200 decreases with halo mass in the mass range 1011.5–1013 M⊙ (shown in the bottom panel of Fig. 6), but it does not reach the same minimum value as in the case with AGN (the minimum value of rcool, NoAGN/R200 is 0.4 compared with 0.08 for rcool, AGN/R200). This means that the rate of gas cooling from the hot halo is always larger in the absence of AGN activity.
We find that |$\dot{M}_{\rm {gas,galaxy}}$| (no AGN) steadily increases because the rate of gas cooling from the hot halo, |$\dot{M}_{\rm {cooling}}/\dot{M}_{\rm {gas,halo}}=(r_{\rm {cool}}/R_{200})f^{\rm {halo}}_{\rm {acc,hot}}$|, remains roughly constant with increasing halo mass. We obtain that |$(r_{\rm {cool}}/R_{200})f^{\rm {halo}}_{\rm {acc,hot}}\sim 0.4$| for haloes with masses between 1012and 1013 M⊙ (|$f^{\rm {halo}}_{\rm {acc,hot}}$| increases with halo mass at roughly the same rate as rcool/R200 decreases). However, since |$f^{\rm {halo}}_{\rm {acc,cold}}$| decreases with halo mass, |$\dot{M}_{\rm {gas,galaxy}}$| (no AGN) differs from |$\epsilon \dot{M}_{\rm {gas,halo}}$| by 0.1 dex for 1012 M⊙ haloes and 0.3 dex for 1013 M⊙ haloes. Physically, the steady increase of |$\dot{M}_{\rm {gas,galaxy}}$| (no AGN) with halo mass means that when there is no AGN feedback, a larger rate of gas cooling from the hot halo develops. We conclude that the formation of a hot halo alone is not enough to prevent gas from reaching the galaxy (see also Gabor et al. 2011; Gutcke et al. 2017; Liu & Cen 2017).
5 SUMMARY AND CONCLUSIONS
We have investigated the physics that drives the gas accretion rates on to galaxies at the centres of dark matter haloes using the EAGLE simulation suite as well as analytic calculations. We began by defining the gas accretion rate on to the galaxy as the rate at which gas crosses the radius 0.15 × R200 between two consecutive snapshots. We also defined the gas accretion rate on to the ISM as the rate at which gas crosses the radius 0.15 × R200 and the phase-space cut |$n_{\rm {H}}>0.1\rm {cm}^{-3}$|, |$T\lt 10^{5}\rm {K}$|. We found that at z = 0 and in the halo mass range 1010–1012 M⊙, the gas accretion rates on to the galaxy (|$\dot{M}_{\rm {gas,galaxy}}$|) and ISM (|$\dot{M}_{\rm {ISM}}$|) increase with halo mass at approximately the same rate, with |$\dot{M}_{\rm {ISM}}$| having a 0.3 dex (on average) lower normalization than |$\dot{M}_{\rm {gas,galaxy}}$|. For halo masses ≳ 1012 M⊙, |$\dot{M}_{\rm {ISM}}$| remains nearly constant. While |$\dot{M}_{\rm {gas,galaxy}}$| flattens at ∼1012 M⊙, it increases with halo mass for haloes with masses ≳ 1013 M⊙ (Fig. 1).
We analysed the dependence of the rates of gas accretion on to galaxies, as well as on to haloes, on halo mass and redshift. We defined the rate of gas accretion on to haloes (|$\dot{M}_{\rm {gas,halo}}$|) as the rate at which gas crosses the virial radius between two consecutive snapshots, and compared the simulation output with the analytic prediction of Correa et al. (2015c) for the dark matter accretion rate, scaled by the universal baryon fraction. Correa et al. (2015b, 2015c) demonstrated that their analytic model reproduces the accretion rates on to haloes in collisionless simulations. We found that the analytic prediction is 0.8 dex too high for 1010 M⊙ haloes at z = 0, agrees for 1011.5 M⊙ haloes, but is 0.3 dex too low for 1013 M⊙ haloes (Fig. 2). At redshifts z = 1−2, better agreement is obtained between |$\dot{M}_{\rm {gas,halo}}$| and the analytic prediction for haloes with mass ≳ 1012 M⊙. At higher redshifts (z > 2), the analytic prediction and |$\dot{M}_{\rm {gas,halo}}$| increase with halo mass at the same rate. However, the analytic prediction has a higher normalization (by up to ∼0.5 dex for z ∼ 8). We believe that better agreement would be reached for high-mass haloes if the analytic model included the impact of baryonic physics that reduces the halo mass. The large discrepancy for halo masses of ∼1010 M⊙ is expected because the potential wells of these haloes are too shallow to strongly bind photo-heated gas (e.g. Sawala et al. 2013; Benítez-Llambay et al. 2017).
The gas accretion rate on to galaxies is (on average) a factor of 4 (and up to a factor of 16) lower than that on to haloes for halo masses 1010–1012 M⊙ (∼1012.5 M⊙) at z = 0, and a factor of 2 (5) lower for 1010–1012 M⊙ (∼1012.5 M⊙) haloes at z = 2. In low-mass haloes, |$\dot{M}_{\rm {gas,galaxy}}$| increases with halo mass at nearly the same rate as |$\dot{M}_{\rm {gas,halo}}$|, but it flattens for halo masses of ∼1012 M⊙ at z = 0−2 (Fig. 2). In high-mass haloes (>1012 M⊙), two modes of accretion (hot and cold) coexist and contribute to the total rates on to galaxies and haloes. We defined hot gas accretion as the accretion rate of gas that after accretion on to the galaxy or halo has a temperature higher than |$10^{5.5}\rm {K}$|, and calculated the fraction of gas accreted hot on to the galaxy (|$f^{\rm {galaxy}}_{\rm {acc,hot}}$|) and halo (|$f^{\rm {halo}}_{\rm {acc,hot}}$|). We found that while |$f^{\rm {halo}}_{\rm {acc,hot}}=0.7$| for 1012 M⊙ haloes at z = 0, |$f^{\rm {galaxy}}_{\rm {acc,hot}}=0.05$| for the central galaxies within them. However, this difference decreases for higher mass haloes, e.g. |$f^{\rm {halo}}_{\rm {acc,hot}}=0.98$| and |$f^{\rm {galaxy}}_{\rm {acc,hot}}=0.80$| for 1013 M⊙ haloes at z = 0. The fraction of gas accreted hot on to galaxies strongly depends not only on halo mass, but also on redshift. We found that |$\dot{M}_{\rm {gas,galaxy}}$| changes from being cold-mode dominated to hot-mode dominated (|$f^{\rm {galaxy}}_{\rm {acc,hot}}=0.5$|) for galaxies in 1012.7 M⊙ haloes at z = 0, but in 1013.3 M⊙ haloes at z = 1 (Fig. 3).
We also investigated the dependence of the rates of gas accretion on to galaxies on feedback variations. It has been shown that in scenarios with energetic stellar feedback, the galaxy accretion rates can increase due to re-accretion of gas that was blown out of the galaxy by stellar-driven winds. In this work, we found that when stellar feedback is twice as energetic, |$\dot{M}_{\rm {gas,galaxy}}$| for galaxies in ≤1012 M⊙ haloes is lower than |$\dot{M}_{\rm {gas,galaxy}}$| from Ref. However, we find that |$\dot{M}_{\rm {gas,galaxy}}$| increases for galaxies in haloes larger than 1012 M⊙, indicating that at these halo masses, galaxies re-accrete gas that was ejected by stellar feedback in lower mass progenitors. When stellar feedback is half as energetic, |$\dot{M}_{\rm {gas,galaxy}}$| decreases for galaxies in ≥1011 M⊙ haloes, possibly due to a lower rate of re-accreted gas or because black hole accretion, and hence AGN feedback, becomes efficient at lower halo masses (Fig. 4).
When stellar feedback is turned off, |$\dot{M}_{\rm {gas,galaxy}}$| decreases relative to Ref for galaxies in >1010.5 M⊙ haloes. This is likely because without stellar feedback, the central black holes in low-mass galaxies become much more massive (Bower et al. 2017), allowing AGN feedback to suppress the gas infall rates. Indeed, when both stellar and AGN feedback are turned off, the rates of gas accretion are higher than in Ref for galaxies in ≲ 1012 M⊙ haloes (Fig. 4).
When AGN feedback is more explosive and intermittent, |$\dot{M}_{\rm {gas,galaxy}}$| decreases with respect to Ref for galaxies in ≥1012 M⊙ haloes, indicating that AGN further suppresses |$\dot{M}_{\rm {gas,galaxy}}$| in massive haloes. When AGN feedback is switched off, |$\dot{M}_{\rm {gas,galaxy}}$| does not flatten at ∼1012 M⊙ and increases with halo mass at the same rate as the gas accretion on to haloes but with a lower normalization (Fig. 5). This shows that AGN feedback is the mechanism responsible for preventing hot gas from cooling and falling on to central galaxies in massive haloes.
To further understand the behaviour of |$\dot{M}_{\rm {gas,galaxy}}$| with halo mass, we developed a physically motivated SAM of galaxy gas accretion. The model postulates that two modes of accretion, cold and hot, contribute to the total gas accretion rate. Cold gas accretion on to galaxies is driven by the rate of cold accretion on to haloes, whereas hot gas accretion is driven by the rate of gas cooling from the hot halo, which depends on the rate of gas accreting on to the halo that is shock-heated and on the location of the cooling radius.
To calculate the cooling radius, rcool, we equated the heating rate produced by accretion shocks (derived in Paper I) with the cooling rate. We found that in the radial range [0.1−1]R200, the hot gas density profile of haloes from the EAGLE simulations deviates from the isothermal shape. The logarithmic density slope increases with halo mass for >1012 M⊙ haloes, reaches a maximum of −0.9 in 1013 M⊙ haloes, and decreases at higher masses. The change in the slope of the density profile reflects how the distribution of the hot gas changes as the halo evolves due to continued infall, reheating and cooling. Because the density profile evolves with halo mass, the ratio rcool/R200 does not decrease monotonically with halo mass. It decreases up to ∼1013 M⊙ haloes and increases towards larger haloes (Fig. 6).
The upturn in the ratio of the cooling and virial radii with halo mass may indicate that while AGN-driven outflows reduce the density of the hot halo for ∼1012–1013 M⊙ haloes, in higher mass haloes, AGN feedback is insufficiently efficient, causing the hot halo cooling flow to become more prominent, and the accretion rate on to galaxies to increase more steeply with halo mass. When there is no AGN feedback, the density of the hot halo is higher, rcool/R200 does not decrease as much as when AGN feedback is on, and so the rate of gas cooling from the hot halo is higher. We compared our SAM of gas accretion with the galaxy accretion rates calculated from the simulation at z = 0 and found excellent agreement.
In future work, we plan to investigate whether the correlation between accretion rates on to nearby galaxies (i.e. galactic conformity, Weinmann et al. 2006) is driven by the correlation of dark matter halo formation time with environment. We will test the predictions of the SAM with the simulation outputs.
Footnotes
The simulation data are saved in nine discrete output redshifts between redshift 0 and 1, in eight output redshifts between redshift 1 and 3, and in eight output redshifts between redshift 3 and 8.
ACKNOWLEDGEMENTS
We are grateful to the EAGLE team for putting together a great set of simulations. This work used the DiRAC Data Centric system at Durham University, operated by the Institute for Computational Cosmology on behalf of the STFC DiRAC HPC Facility (www.dirac.ac.uk). This equipment was funded by BIS National E-infrastructure capital grant ST/K00042X/1, STFC capital grant ST/H008519/1, and STFC DiRAC Operations grant ST/K003267/1 and Durham University. DiRAC is part of the National E-Infrastructure. The EAGLE simulations were performed using the DiRAC-2 facility at Durham, managed by the ICC, and the PRACE facility Curie based in France at TGCC, CEA, Bruyeres-le-Chatel. This work was supported by the Netherlands Organization for Scientific Research (NWO) through VICI grant 639.043.409. FvdV acknowledges the Klaus Tschira Foundation. We thank the anonymous reviewer for fruitful comments that improved the original manuscript.
REFERENCES
APPENDIX A: SIMULATIONS
In the EAGLE simulations, star formation is modelled following the recipe of Schaye & Dalla Vecchia (2008). It is stochastic above a density threshold that depends on metallicity (proposed by Schaye 2004). Stellar evolution and mass loss follows the work of Wiersma et al. (2009), where star particles are treated as simple stellar populations with Chabrier (2003) initial mass function, spanning the range 0.1−100 M⊙. Feedback from star formation follows the stochastic thermal feedback scheme of Dalla Vecchia & Schaye (2012). Rather than heating all neighbouring gas particles within the SPH kernel, they are selected stochastically based on the available energy, and then heated by a fixed temperature difference of ΔT = 107.5 K. The probability that a neighbouring SPH particle is heated is determined by the fraction of the energy budget that is available for feedback, which depends on adjustable maximum and minimum threshold values (fth, max and fth, min, respectively), on the gas density as well as on metallicity.
For AGN feedback, black hole seeds (of ≈1.4 × 10⁵ M⊙) are included in haloes with mass greater than ≈1.4 × 10¹⁰ M⊙ (Springel, Di Matteo & Hernquist 2005). Black holes can grow through mergers and accretion. The accretion events follow a modified Bondi–Hoyle formula that accounts for the angular momentum of the accreting gas (Rosas-Guevara et al. 2013), and a free parameter that is related to disk viscosity (Cvisc). AGN feedback is stochastic; it follows the accretion of mass on to the black hole, where a fraction of the accreted gas is released as thermal energy into the surrounding gas. This method is based on that of Booth & Schaye (2009) and Dalla Vecchia & Schaye (2012), where the free parameter is the heating temperature ΔTAGN. Finally, radiative cooling and photo-heating are included as in Wiersma et al. (2009). The element-by-element radiative rates are computed in the presence of the cosmic microwave background and the Haardt & Madau (2001) model for UV and X-ray background radiation from quasars and galaxies.
The EAGLE simulations include a new SPH formulation named ‘Anarchy’, which improves the performance on standard hydrodynamical tests when compared to the original SPH implementation in GADGET (see Schaller et al. 2015a or Hu et al. 2014 for similar results). Anarchy makes use of a pressure-entropy formulation derived in Hopkins (2013), allowing it to avoid spurious jumps at contact discontinuities. It also uses an artificial viscosity switch as in Cullen & Dehnen (2010), which allows the viscosity limiter to be stronger when shocks and shear flows are present. In addition, it includes an artificial conduction switch (similar to that of Price 2008), the C2 Wendland (1995) kernel, and the time step limiters of Durier & Dalla Vecchia (2012), which ensure that ambient particles do not remain inactive when a shock is approaching (for a more complete description, see Schaye et al. 2015).
APPENDIX B: NUMERICAL CONVERGENCE
We investigate how numerical resolution impacts the rates of gas accretion in the EAGLE simulations. Fig. B1 shows the total gas accretion on to haloes (top panel) and their central galaxies (bottom panel) in the redshift range 0 ≤ z < 0.1. Both panels show that the accretion rates (on to haloes and galaxies) increase with increasing halo mass. We find that in 1011 M⊙ haloes, |$\dot{M}_{\rm {gas,galaxy}}$| increases (on average) by a factor of 3 if the particle mass resolution is increased by a factor of 8, whereas |$\dot{M}_{\rm {gas,halo}}$| increases by up to a factor of 2.5. This lack of convergence in the gas accretion rates on to galaxies is expected, due to the fact that recycling winds from SN and AGN outflows are resolution dependent.
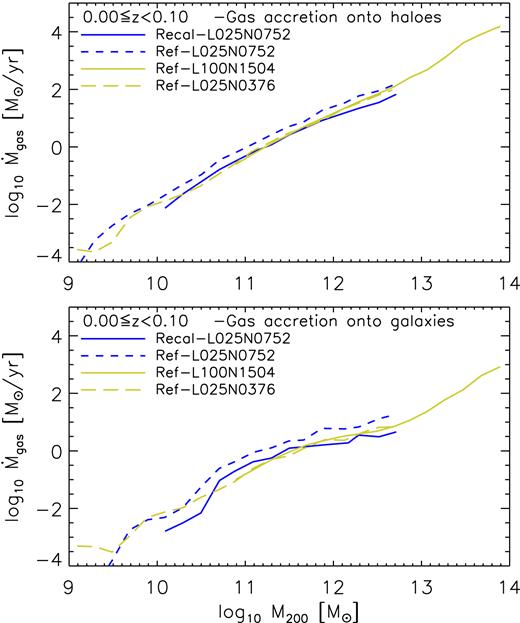
Accretion rate of gas on to haloes (top panel) and their central galaxies (bottom panel) as a function of halo mass in the redshift range 0 ≤ z < 0.1. The curves show the median values of the total accretion rates of haloes, as well as on to galaxies, in logarithmic mass bins of 0.2 dex, each mass bin contains at least 10 haloes. To analyse numerical convergence, we compare accretion rates from simulations with different box sizes and number of particles and therefore different resolution. We classify the simulations as high-resolution (blue curves) and intermediate-resolution (yellow curves). We find strong convergence with box size and weak convergence between different resolution simulations (see the text for details).
However, we achieve convergence between simulations that use different resolution but for which the parameters of the subgrid feedback have been calibrated to the same observations. We find excellent agreement in the accretion rates between the recalibrated model ‘Recal-L025N0752’ and the reference models Ref-L100N1504/Ref-L025N0376.
The top panel from Fig. B1 shows a drop in the accretion rates from the intermediate-resolution simulations (yellow curves) in haloes smaller than 1010 M⊙. This is likely a numerical artefact because such a drop is not seen at this mass in the accretion rates from the high-resolution simulation (blue curve). We therefore set the minimum halo mass for accretion on to haloes (and their inner galaxies) to correspond to 1000 dark matter particles (∼1010 M⊙ halo mass for the intermediate-resolution simulations). Throughout this work, we use the intermediate-resolution (fiducial) simulations.
APPENDIX C: DENSITY PROFILES OF HOT GASEOUS HALOES
In this section, we investigate how the density profile of hot halo gas evolves due to the continued infall, reheating and cooling of gas in haloes from the EAGLE simulations.
We select all haloes from the Ref-L100N1504 and No AGN FB-L050N0752 simulations and separate them in mass bins of Δlog10(M200) = 0.2 width. To calculate ρhot-gas(r), we select gas particles that are hot (have cooling times longer than local dynamical times) and define a set of concentric spherical shells of width Δlog10(r) = 0.078. We add the mass of the particles within each shell and divide by the volume. As we are only interested in the density profile of gas in the haloes but not within galaxies, we restrict the analysis of ρgas(r) to the radial range 0.1 to 1 × R200.
We calculate the dynamical time, tdyn, of the gas particle as tdyn = r/Vc(r), where Vc(r) = [GM( < r)/r]1/2 is the circular velocity and M( < r) is the mass enclosed within r. We calculate the cooling time, tcool, as |$t_{\rm {cool}} = \frac{3nk_{\rm {B}}T}{2\Lambda }$|, where n is the number density of the gas particle (n = ρgas/μmp, μmrmp is the mean particle mass calculated from the cooling tables of Wiersma et al. (2009)), kB is the Boltzmann constant, T is the gas temperature, and Λ is the cooling rate per unit volume with units of erg cm−3s−1. To calculate Λ, we use the tabulated cooling function for gas exposed to the evolving UV/X-ray background from Haardt & Madau (2001) given by Wiersma et al. (2009), which was also used by the EAGLE simulations. Note that the 'standard' definition for the dynamical time of gas within a virialized system depends on R200 and Vc(R200), and not on the local radius and local circular velocity as defined here.
Fig. C1 shows the median gas density profile at z = 0 of haloes in the mass range log10(M200/ M⊙) ± 0.1, with log10(M200/ M⊙) varying from 11.7 to 13.7, as indicated in the legends, from the Ref model (top panel) and from the No AGN FB model (bottom panel). We define γ as the logarithmic density slope (dln ρgas/dln r ≡ γ), which we measure between the radial range 0.1 and 1 × R200, assuming ρhot-gas(r) ∝ rγ. We find that γ increases from −1.8 in 1012 M⊙ haloes to −0.8 in 1012.7 M⊙ haloes, and then decreases again towards larger halo masses. In smaller haloes, ρhot-gas(r) is steeper at small radii and deviates from the isothermal shape (characterized by γ = −2).
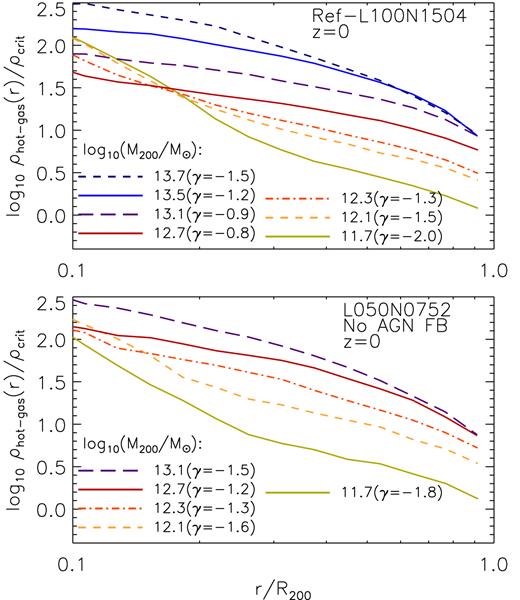
Average density profile of hot gas at z = 0 of stack of haloes in the mass range log10(M200/ M⊙) ± 0.1, with log10(M200/ M⊙) varying from 11.7 to 13.7 (as indicated in the legends) from the Ref model (top panel) and the No AGN FB model (bottom panel).
The change in the slope of ρhot-gas(r) with mass indicates how the distribution of the hot gas in the halo evolves and can be explained as follows. Since a stable hot halo forms for ∼1012 M⊙, most gas crossing R200 remains hot. As a result, the gas density in the range 0.5−1R200 increases and the density profile flattens. When AGN feedback is turned off, ρhot-gas(r) does not flatten as much as in Ref, suggesting that the cooling flow from the hot halo is more prominent.
APPENDIX D: ACCRETION RATE ON TO HALOES
In this section, we show a comparison between the best-fitting relations presented in Section 3.1 given by equations (1)–(8) and the simulation outputs. Fig. D1 shows the accretion rates on to haloes as a function of halo mass for different redshifts. The solid curves correspond to the accretion rates taken from the Ref-L100N1504 simulation, whereas the dashed curves correspond to the best-fitting expression. We show that the best-fitting expressions are able to closely reproduce the gas accretion rate on to haloes in the redshift range 0–8 and halo mass range 1010–1014 M⊙.
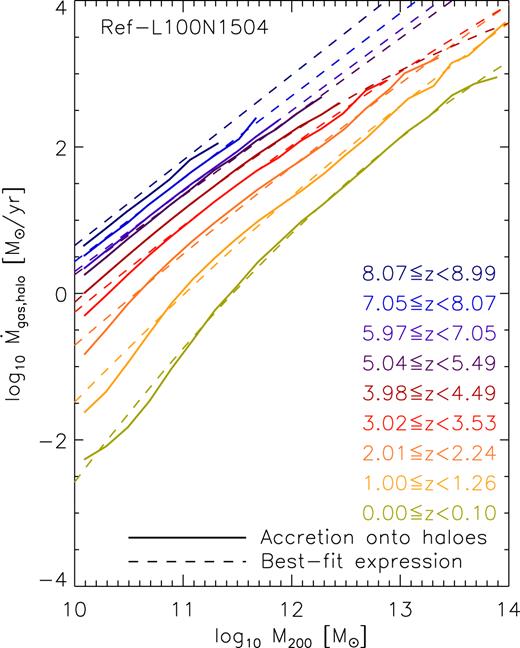
Accretion rates on to haloes as a function of halo mass for different redshifts. The curves are coloured according to the redshift intervals indicated in the legends. The solid curves correspond to the accretion rates taken from the Ref-L100N1504 simulation, whereas the dashed curves correspond to the best-fitting expression presented in Section 3.1 given by equations (1)–(8).
