


ABSTRACT
Aql X-1 is one of the best-studied neutron star low-mass X-ray binaries. It was previously targeted using quasi-simultaneous radio and X-ray observations during at least seven different accretion outbursts. Such observations allow us to probe the interplay between accretion inflow (X-ray) and jet outflow (radio). Thus far, these combined observations have only covered one order of magnitude in radio and X-ray luminosity range; this means that any potential radio–X-ray luminosity correlation, LR ∝ LXβ, is not well constrained (β ≈ 0.4–0.9, based on various studies) or understood. Here we present quasi-simultaneous Very Large Array and Swift-XRT observations of Aql X-1’s 2016 outburst, with which we probe one order of magnitude fainter in radio and X-ray luminosity compared to previous studies (6 × 1034 erg s−1 < LX <3 × 1035 erg s−1, i.e. the intermediate to low-luminosity regime between outburst peak and quiescence). The resulting radio non-detections indicate that Aql X-1’s radio emission decays more rapidly at low X-ray luminosities than previously assumed – at least during the 2016 outburst. Assuming similar behaviour between outbursts, and combining all available data in the hard X-ray state, this can be modelled as a steep β =|$1.17^{+0.30}_{-0.21}$| power-law index or as a sharp radio cut-off at LX ≲ 5 × 1035 erg s−1 (given our deep radio upper limits at X-ray luminosities below this value). We discuss these results in the context of other similar studies.
1 INTRODUCTION
Astrophysical jets (collimated outflows) are an important yet not-well-understood component in the physics of accretion. Despite the development of numerous theoretical models (e.g. Blandford & Znajek 1977; Blandford & Payne 1982; Parfrey, Spitkovsky & Beloborodov 2016), their formation mechanism is still unclear. Observations of jets in various types of accreting systems can help to elucidate this problem. A particularly useful class of objects in the study of jet formation are Galactic transient low-mass X-ray binaries (LMXBs; Lewin, van Paradijs & van den Heuvel 1997) – systems consisting of a compact object (which can be either a black hole, BH, or a neutron star, NS), accreting from a low-mass companion star (|$\lesssim 1\, \mathrm{M_{\odot }}$| for NS systems, and less than a few solar masses for BH systems). During their characteristic episodes of active accretion towards the central object (outbursts), the accretion rate of LMXBs evolves on time-scales of days to months, allowing us to observe the formation and disappearance of jets on practical time-scales.
When a transient LMXB goes into outburst, its multiwavelength luminosity increases by a few orders of magnitude. As the system’s accretion rate increases, accumulated in-falling matter is heated up and emits in X-rays (e.g. Shakura & Sunyaev 1973). Not all of the in-falling material ends up on the central object, however, some fraction is expelled from the system. In some cases, a jet is formed: outflowing accelerated particles produce synchrotron radiation that can be visible at radio wavelengths. Thus, studying the relationship between the radio luminosity (LR) and the X-ray luminosity (LX) of such a system allows one to trace the connection between the inflow and outflow of material in LMXBs – as well as various other types of accreting systems (e.g. active galactic nuclei; Plotkin et al. 2012).
Observations of X-ray binaries in the hard X-ray state have shown that LR and LX often follow a power-law relation LR ∝ LXβ (Corbel et al. 2002; Migliari & Fender 2006; Gallo, Degenaar & van den Eijnden 2018). This demonstrates that both LR and LX are functions of mass accretion rate, and (under the assumption that the jet power is a fixed fraction of the accretion power; e.g. Markoff et al. 2003) the power-law index β mostly reflects the properties of the accretion inflow (e.g. how efficient it is at producing radiation; Narayan & Yi 1995). In such scale-invariant coupled disc–jet models, β ∼ 1.4 is usually associated with radiatively efficient accretion and β ∼ 0.7 with radiatively inefficient accretion. In the case of BH accretors, such radiative inefficiency can be explained by the loss of part of the accreting material within the event horizon (Narayan & Yi 1995). In the case of NS accretors, a radiatively inefficient accretion flow could be explained, e.g. by a strong outflow (due to, e.g. propeller effect D’Angelo et al. 2015).
It has been argued previously that NS-LMXBs and BH-LMXBs show different relations between their LR and LX, when modelling observations in the hard X-ray state as a power-law relation (Migliari & Fender 2006). More recently, however, Gallo et al. (2018) find that NS- and BH-LMXBs show roughly consistent power-law slopes at the 2.5σ level. They find |$\beta = 0.44^{+0.05}_{-0.04}$| and β = 0.59 ± 0.02 for NS and BH systems, respectively (Gallo et al. 2018).
In comparison to BH-LMXBs, NS-LMXBs are typically radio fainter, by roughly an order-of-magnitude for the same X-ray luminosity (Fender & Kuulkers 2001; Migliari & Fender 2006; Gallo et al. 2018), and hence more challenging to study. A particularly interesting NS-LMXB for studying jet activity is Aql X-1, one of the first Galactic X-ray sources to be discovered (Friedman, Byram & Chubb 1967; Kunte et al. 1973). It is a binary system (orbital period ∼19 h) composed of an NS (Czerny, Czerny & Grindlay 1985) and a low-mass (|$\sim 0.4\, \mathrm{M_{\odot }}$|) main-sequence-like companion (Chevalier et al. 1999). Aql X-1 goes into outburst almost every year (e.g. Campana, Coti Zelati & D’Avanzo 2013; Güngör, Güver & Ekşi 2014), and hence offers regular opportunities to study its LR–LX relation.
Based on the X-ray spectral and timing properties, different states are identified during LMXB outbursts (e.g. van der Klis 1994). During its outbursts, Aql X-1 typically evolves from a low-hard X-ray state, peaking in the high-soft X-ray state, and returning back to the hard state at the end of the outburst (Muñoz-Darias et al. 2014). The majority of outbursts of Aql X-1 can be characterized by fast rise and exponential decay of the X-ray luminosity (‘FRED-type’ outburst; Campana et al. 2013). Some of Aql X-1’s outbursts have symmetrical rise and decay (‘Gaussian-like’ outburst; Campana et al. 2013) or have multiple X-ray luminosity peaks. An alternative classification of outbursts of Aql X-1 is based on their duration and peak luminosity (Güngör et al. 2014): low-luminosity outbursts reach a maximum X-ray luminosity of LX ∼ 1037 erg s−1 before decaying, while high-luminosity outbursts can reach up to a factor of 5 higher in LX and tend to be longer in duration.
Previous radio monitoring of Aql X-1 was performed for at least seven different outbursts (all of the low-luminosity class). These studies demonstrated that its radio jet behaviour changes depending on the X-ray spectral state and luminosity (Tudose et al. 2009; Miller-Jones et al. 2010a). Flat-spectrum1 radio emission (indicative of an optically thick jet) was observed during the rise in the low-hard X-ray state or transition between low-hard and high-soft X-ray states (Miller-Jones et al. 2010a; Díaz Trigo et al. 2018), and ‘quenches’ (i.e. disappears) during the peak of the high-soft X-ray state (LX ∼1037 erg s−1; Miller-Jones et al. 2010a).
Aql X-1 is one of the only three NS-LMXBs in which the correlation between radio and X-ray luminosities has been investigated in detail using a relatively large number of observations. The power-law index was fitted in different studies, using different data selections (see Section 3.2.2), which found β = 0.40 ± 0.07 (Tudose et al. 2009) and |$\beta =0.76^{+0.14}_{-0.15}$| (Tetarenko et al. 2016). This is similar to what has been found in NS- and BH-LMXBs when fitting the populations globally and accepting more scatter in the correlation (Gallo et al. 2018). For two other NS-LMXBs, 4U 1728−34 (Migliari et al. 2003) and EXO 1745−248 (Tetarenko et al. 2016), steeper power-law indices were found: β = 1.5 ± 0.2 and |$\beta =1.68^{+0.10}_{-0.09}$|, respectively. This could suggest a radiatively efficient accretion regime (Migliari & Fender 2006). Different power-law indices have also been observed in individual BH-LMXBs (e.g. the ‘outliers track’ described by Coriat et al. 2011); however, they have been observed to return to the same canonical track for LX <1035 erg s−1 (Maccarone 2012; Corbel et al. 2013).
The situation can be clarified by observing such systems over the widest-possible range of radio and X-ray luminosities. While the radio–X-ray correlation was probed for a few BH-LMXBs over 8 dex (orders of magnitude) in LX and 5 dex in LR, in 4U 1728−34 and Aql X-1 this correlation has previously only been studied over ∼1 dex in radio and X-ray luminosities.
Since NS-LMXBs tend to be more radio faint compared to BH-LMXBs (Fender & Kuulkers 2001; Gallo et al. 2018), radio observations below the peak of their outburst (LX <1036 erg s−1) have previously been hampered by the limited sensitivity of available radio telescopes. With the upgraded Karl J. Jansky Very Large Array (VLA; Perley et al. 2011), an order-of-magnitude deeper radio observations are now possible. However, such observations are still challenging to schedule because NS-LMXBs often pass through the 1034−36 erg s−1 X-ray luminosity range only during the rise and decay of the outburst, which often lasts no longer than ∼3–7 d (Campana et al. 2013; Güngör et al. 2017).
Due to these time constraints and their relative radio faintness, only a few NS-LMXBs have been observed in the luminosity range LX < 1036 erg s−1. In the case of non-pulsating NS-LMXBs, these observations led exclusively to non-detections (Tetarenko et al. 2016; Gusinskaia et al. 2017; Tudor et al. 2017). However, there are two classes that potentially stand out in this low X-ray luminosity regime (Gallo et al. 2018): accreting millisecond X-ray pulsars (AMXPs; systems that exhibit coherent millisecond X-ray pulsations as a result of accreting material channelling on to the magnetic polar caps of the NS; Wijnands & van der Klis 1998; Patruno & Watts 2012) and transitional millisecond pulsars (tMSPs; NSs that switch between rotation-powered radio millisecond pulsars and an accretion-disc state; Papitto et al. 2013; Jaodand, Hessels & Archibald 2018). Both these classes show comparatively bright radio emission at low LX (Deller et al. 2015; Tudor et al. 2017). There were previously tentative suggestions that tMSPs might follow their own correlation in the radio – X-ray luminosity plane (Deller et al. 2015). However, recent strictly simultaneous radio and X-ray observations of tMSP PSR J1023+0038 in the low-luminosity accretion-disc state showed anticorrelated radio–X-ray brightness variations that argue against an origin from a collimated jet (Bogdanov et al. 2018). Thus, the accretion-disc state of low-luminosity tMSPs is likely quite different compared to NS-LMXBs in outburst. Consequently, care is needed when comparing different NS-LMXB systems in the LR–LX plane because they could be in fundamentally different accretion regimes.
Ultimately, many more systems need to be studied in detail before we can come to any robust conclusions on whether different classes of NS-LMXBs have different LR–LX correlations, because of, e.g. the influence that different magnetic field strengths, geometry, or spin rate may have on disc–jet coupling.
Aql X-1 is identified as an intermittent AMXP because of the discovery of 550.27 Hz coherent X-ray pulsations (Casella et al. 2008) that lasted for only 150 s out of the 106 s that the source was observed. Two other AMXPs are also classified as intermittent and have shown pulsations that appear and disappear on time-scales of days to years: HETE J1900.1−2455 (Galloway et al. 2007; Patruno 2012) and SAX J1748.9−2021 (Altamirano et al. 2008). Since Aql X-1 is the most extreme case of intermittency, it is also possible that the origin of the pulsations is different in nature.
In this paper we present sensitive radio observations of Aql X-1 in the low X-ray luminosity range (<1036 erg s−1), taken while the source was decaying from its 2016 outburst. We compare these with archival measurements from this and previous outbursts to study the LR–LX correlation of Aql X-1 – under the assumption that the radio – X-ray correlation behaves similarly between outbursts. In Section 2 we present the observations and data analysis. In Section 3 we present the results, and discuss their interpretation in Section 4.
2 OBSERVATIONS AND DATA REDUCTION
2.1 2016 outburst
Aql X-1 entered into outburst at the end of 2016 July (Sanna et al. 2016). The outburst lasted for approximately 2 months, reaching a peak X-ray luminosity of ∼8 × 1037 erg s−1 (for an assumed distance of 4.5 kpc; Güngör et al. 2017), making it the brightest outburst observed from Aql X-1 to date.
Using the VLA, we performed three radio observations of Aql X-1 while it was fading in brightness at the end of its 2016 outburst. These observations were spaced daily (on the 26th, 27th, and 28th of September 2016), and were coordinated quasi-simultaneously with Neil Gehrels Swift-XRT daily monitoring. Table 1 provides a log of all 2016 outburst observations used in the present study.
VLA radio upper limits (3σ), ATCA detections (Díaz Trigo et al. 2018), together with the corresponding quasi-simultaneous Swift-XRT X-ray observations and their spectral properties. All uncertainties are 1σ.
| ATCA radio | Swift-XRT X-ray (1–10 keV) | |||||||||
|---|---|---|---|---|---|---|---|---|---|---|
| Date 2016 | # | MJD | Sν (μJy) | ν (GHz) | MJD | Obs. ID and mode | Spectral modela | Unabsorbed flux × 10−10 (|$\mathrm{erg\, s^{-1}\, cm^{-2}}$|) | Photon index | |$\chi ^2_{\nu }$| (dof) |
| 2 Aug | 1 | 57602.543 | 428 ± 28 | 9 | – | – | – | – | – | – |
| 512 ± 26 | 5.5 | |||||||||
| 3 Aug | – | – | – | – | 57603.137 | 33665074(wt) | TBabs*(po) | 60 ± 1 | 1.62 ± 0.02 | 1.01 (473) |
| 4 Aug | 2 | 57604.509 | 208 ± 18 | 9 | – | – | – | – | – | |
| 498 ± 19 | 5.5 | |||||||||
| 5 Aug | – | – | – | – | 57605.111 | 33665075(wt) | TBabs*(po + bb) | 246 ± 2 | 1.65 ± 0.02 | 1.06 (674) |
| 6 Aug | – | – | – | – | 57606.140 | 33665078(wt) | TBabs*(po + bb) | 357 ± 3 | 1.56 ± 0.02 | 1.02 (676) |
| 7 Aug | 3 | 57607.599 | 528 ± 19 | 9 | 57607.726 | 33665076(wt) | TBabs*(po + bb) | 313 ± 5 | 1.81 ± 0.05 | 1.01 (500) |
| 810 ± 19 | 5.5 | |||||||||
| 19 Sep | 4 | 57650.354 | 366 ± 12 | 9 | 57650.597 | 33665089(wt) | TBabs*(po + bb) | 18.7 ± 0.3 | 1.95 ± 0.05 | 1.03 (397) |
| 259 ± 13 | 5.5 | |||||||||
| VLA radio | Swift-XRT X-ray (1−10 keV) | |||||||||
| 25 Sep | – | – | – | – | 57656.293 | 34719004(pc) | TBabs*(po) | 1.9 ± 0.1 | 1.77 ± 0.09 | 1.11 (50) |
| 26 Sep | 5 | 57657.031 | <15 | 10 | 57657.095 | 34719005(pc) | TBabs*(po) | 1.2 ± 0.1 | 1.87 ± 0.12 | 1.08 (30) |
| 27 Sep | 6 | 57658.031 | <11 | 10 | 57658.558 | 34719006(pc) | TBabs*(po) | 0.36 ± 0.04 | 1.93 ± 0.16 | 1.35 (16) |
| 28 Sep | 7 | 57659.181 | <6 | 10 | 57659.767 | 34719007(pc) | TBabs*(po) | |$0.16_{-0.05}^{+0.08}$| | |$2.33^{+0.21}_{-0.19}$| | 1.25 (10) |
aWe used NH = 0.4 × 1022 cm−2 as a fixed parameter.
2.1.1 Radio data and analysis
Aql X-1 was observed with the VLA at three epochs (project ID: 15B-239), each at X-band (8–12 GHz). The first two epochs had total duration ∼1 h and the last was ∼3 h including calibration scans, with ∼0.5 and ∼2 h on source, respectively. During all three epochs the array was in A configuration (synthesized beam ∼0.3 arcsec). Data were initially calibrated using the VLA Common Astronomy Software Application (casa;2 McMullin et al. 2007) Calibration Pipeline (version 5.4.1). We used J1331+305 and J1407+2807 as flux and polarization calibrators, respectively, and J1907+0127 as phase and amplitude calibrator. The data were additionally flagged and calibrated following standard procedures within casa.
In our analysis below, we also incorporate results from Australia Telescope Compact Array (ATCA) observations of Aql X-1’s 2016 outburst that were previously presented in Díaz Trigo et al. (2018).
2.1.2 X-ray data and analysis
Based on the three observational epochs obtained using the VLA we selected four quasi-simultaneous Swift-XRT observations (target ID: 34719), all done in photon counting (PC) mode. As such, each of our radio observations is framed by a pair of X-ray observations. Additionally, we selected seven Swift-XRT observations (target ID: 33665) – two done in PC mode and five done in window timing (WT) mode – that are spaced quasi-simultaneously between the aforementioned ATCA radio observations (Díaz Trigo et al. 2018). For more details see Table 1 and Fig. 1. Due to the high count rate of Aql X-1, all observations were corrupted by pile-up, and consequently two observations that were performed in PC mode (observation IDs: 33665073 and 33665088) during the peak of the outburst were excluded.
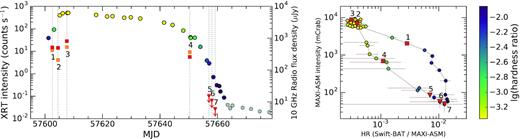
Left: X-ray and radio light curves of Aql X-1’s 2016 outburst. Circular symbols represent the Swift-XRT (0.3–10 keV) X-ray light curve (using the left-hand axis). Their colour represents hardness ratio (see colour bar on the right-hand side of this figure; grey symbols indicate no constraint on the spectrum). Square symbols represent the ATCA (Díaz Trigo et al. 2018) radio light curve (using the right-hand axis): red and orange symbols are 5.5 and 9.0 GHz flux densities, respectively. Red downward-pointing triangles are 10-GHz VLA upper limits from our campaign. Numbers refer to radio observations in Table 1, second column. The dotted vertical lines indicate the epochs of the radio observations and the associations with their nearest corresponding X-ray observations. Right: Hardness–intensity diagram of the same outburst (circular symbols). The hardness ratio is defined as 15–50 keV Swift-BAT flux / MAXI 2–10 keV flux and intensity as 2–10 keV MAXI flux in mCrab units. The red symbols indicate at what stage of the outburst the radio observations were taken (squares: ATCA and triangles: VLA), and use the same numbering convention as in the left-hand panel and Table 1.
The basic data reduction and calibration was done using the xrt_pipeline task within heasoft-6.243. For all nine epochs, the spectrum of the source was extracted from a 30-pixel-wide area (circular in the case of PC mode observations and square in the case of WT mode observations), centred on the source position (taken from Miller-Jones et al. 2010a), while the background was extracted from a surrounding annulus with 30-pixel inner radius and 60-pixel outer radius. The extraction of spectra was done using xselect. To correct for known CCD artefacts we used ancillary arf-files (produced using the xrtmkarf script and exposure map) together with the ‘swxpc0to12s6_20130101v014.rmf’ response file. Each spectrum was grouped into 20-photon bins. In order to account for pile-up, we used the technique described in Romano et al. (2006) and excluded the necessary amount of pixels from the central part of the images (or events in the case of WT mode) before performing spectral model fitting. We used xspec (version 12.10.0c) to perform the spectral model fit and to extract the source flux. For spectral fitting we used photons from the 0.4–10 and 0.7–10 keV ranges in the case of PC and WT mode observations, respectively. We achieved sufficiently good fits (|$\chi ^2_{\nu } \lt 1.1$|) using a simple absorbed power-law model (TBabs * powerlaw) or with an additional blackbody component (TBabs * (powerlaw + bb)) in xspec. By fitting all spectra together with the NH parameter tied between data sets, we found NH = 0.39 ± 0.02 × 1022 cm−2, which is consistent with the value reported by Rutledge et al. (2001). Thus we simply used NH = 0.4 × 1022 cm−2 as a fixed parameter while performing fits to individual observations. We added a cflux component to the spectral model in order to determine unabsorbed 1–10 keV fluxes and their associated errors for each epoch. The resulting parameter values, spectral models, |$\chi ^2_{\nu }$| values and number of degrees of freedom (dof) are listed in Table 1.
In order to place our radio observations in context, we produced a hardness-intensity diagram (HID) using daily-averaged count rates of all-sky monitors MAXI4 and Swift-BAT5. Both count rates were converted to mCrab using the average (over the time period of Aql X-1’s 2016 outburst) count rate of the Crab nebula with the corresponding instrument. Here we define hardness ratio as 15–50 keV Swift-BAT flux / MAXI 2–10 keV flux and intensity as 2–10 keV MAXI flux. The obtained HID is shown in Fig. 1 (right). The colour scale represents the hardness ratio, where yellow is more soft and blue is more hard. For illustration purposes we inferred the hardness ratio for each Swift-XRT observation by interpolating the results from MAXI/Swift-BAT observations taken around the time of the Swift-XRT observations.
In order to directly compare the 2016 outburst with the other seven outbursts (which were observed using RXTE-PCA) we additionally produced HIDs where the intensity and the hardness ratio are defined as 2–16 keV flux and ratio of 9.7–16 and 6.0–9.7 keV fluxes, respectively. Analogous to the above, we converted MAXI count rates into mCrab units using the average (during the 2016 outburst) count rate of the Crab nebula in the corresponding energy bands. The mCrab units were then converted to |$\mathrm{erg\, s^{-1}\, cm^{-2}}$| flux (see Fig. 2).
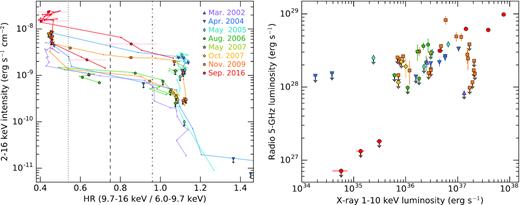
Left: Hardness–intensity diagram for the eight outbursts of Aql X-1 used in this study. Different symbols and colours indicate X-ray properties at the time of radio observations from different outbursts. The hardness ratio for outbursts before 2016 is defined from RXTE-PCA data. For the 2016 outburst, the hardness ratio was defined from MAXI data (note that, for flux less than |$10^{-9} \mathrm{erg\, s^{-1}\, cm^{-2}}$|, the MAXI count rate in the 9.7–16 keV and 6.0–9.7 keV energy bands was too low to constrain the spectrum but, from the joint MAXI and Swift-BAT HID, we see that the VLA upper-limits are during the hard X-ray sate, i.e. HR ≳ 1). Vertical lines represent the hardness ratio threshold that we used in our data selection: dotted line HR = 0.54, dashed line HR = 0.75 and dash–dotted line HR = 0.96. Right: Quasi-simultaneous X-ray (1–10 keV) luminosity versus radio (5 GHz) luminosity for Aql X-1. Different symbols and colours indicate different outbursts, using the conventions as in the left-hand panel. Radio data points are taken from Tudose et al. (2009) and Miller-Jones et al. (2010a) for outbursts before 2016, and from Díaz Trigo et al. (2018) for radio detections during the 2016 outburst.
As shown in Fig. 1, Aql X-1 was in the hard X-ray state during all VLA observations. The first VLA observation was performed just 6 d after the last ATCA detection, which was performed a few days after Aql X-1 had started the spectral transition to the hard state. As such, two ATCA observations of Aql X-1’s 2016 outburst were performed when the source was still relatively hard and two when it was in the soft X-ray state.
2.2 Archival data of Aql X-1 from previous outbursts
2.2.1 Radio data
In our analysis below (Section 3), we combine data from the 2016 outburst with previous radio–X-ray monitoring campaigns of Aql X-1. We used the results of all published radio continuum observations that were taken before 2011 (table 1 from Tudose et al. 2009 and the entire6 table 1 from Miller-Jones et al. 2010a). From this set we selected only radio observations that were taken within 1 d of an RXTE-PCA X-ray observation.
2.2.2 X-ray data
From the RXTE-PCA data archive we selected the closest observation to each selected radio point. In most cases it was possible to bracket the radio observation with an additional X-ray observation that was within 2 d of the radio measurement, and which allowed us to interpolate the X-ray flux (see Section 3.1).
Selected X-ray observations were analysed using the standard heasoft tools. Each spectrum was produced by grouping 20 photons per bin, subtracting background, applying telescope response corrections and – in the case of seven observations – removing Type-I X-ray bursts. In order to correct for the systematic uncertainty of the RXTE-PCA (Jahoda et al. 2006) energy bins, we increased the uncertainties of each spectral bin by 0.5 per cent (following e.g. Nowak et al. 2011). We performed basic spectral fitting with xspec using three different possible models: a power-law, a power-law plus a Gaussian (if the iron Kα line was present), and a power-law plus a black-body component (if an additional thermal component was needed to produce an acceptable fit). For this spectral fitting we only used the 3–16 keV band; thus we kept the NH value fixed to the value quoted above. For the neutral iron line modelling we restricted the mean of the Gaussian to the range 6.3–6.5 keV (since the iron line appears at 6.4 keV). We achieved acceptable fits for all observations (|$\chi ^2_{\nu } \lt 1.3$| and p-value >0.08). We then used the cflux model to obtain Aql X-1’s unabsorbed 1–10 keV flux. We also obtained the unabsorbed 2–16, 6–9.7, and 9.7–16 keV fluxes from each spectrum in order to calculate the intensity and hardness ratio (HR) in the same way that it was defined in Miller-Jones et al. (2010a). The resulting fluxes and hardness ratios for each observation are presented in Table A1. We repeated this analysis for all RXTE-PCA observations in all seven previous outbursts discussed in this paper. The associated light-curves and HIDs for all previous outbursts are presented in the Appendix (Figs A1–A7).
3 ANALYSIS AND RESULTS
In the following analysis, we assume a distance of 4.5 kpc – as was done in Campana et al. (2014) based on the results of Galloway et al. (2008), where the peak luminosity of Type-I X-ray bursts was used to estimate distance.
3.1 Radio and X-ray luminosities
All three of our VLA observations of Aql X-1 resulted in non-detections. Using the imfit task in casa and the exact position of the source (taken from Miller-Jones et al. 2010a), we measured flux densities of 2.5 ± 4.2, −1.9 ± 4.3, and −0.2 ± 2.0 μJy beam−1 at the three epochs, respectively, where the error corresponds to the off-source local rms image noise. These correspond to 3σ upper limits of 15, 11, and 6 μJy beam−1, respectively (Table 1).
Aql X-1 was detected in all Swift-XRT observations that are used in our study (Table 1). During the 2016 outburst, Aql X-1 had an X-ray luminosity typical of NS-LMXBs in outburst (1036−38 erg s−1). None the less, we note that the 2016 outburst was a particularly high-luminosity outburst – in fact the brightest observed from Aql X-1 to date – reaching a peak X-ray luminosity of almost 1038 erg s−1 (Güngör et al. 2017). Our VLA observations were performed as the source was decaying in brightness, with the first VLA observation taken when Aql X-1 was at an X-ray luminosity of 3 × 1035 erg s−1 and the last one when it was at 6 × 1034 erg s−1.
Since radio and X-ray observations were not strictly simultaneous, we obtained the X-ray flux values corresponding to the 2016 VLA and ATCA radio observations by logarithmically interpolating between pairs of closely spaced Swift-XRT observations (see Fig. 1). In the same manner, we obtained approximate X-ray fluxes and hardness ratios (9.7–16 keV flux/6–9.7 keV flux) at the time of each archival radio observation (Section 2.2.1) using RXTE-PCA data (Section 2.2.2). We increased the uncertainties on the interpolated X-ray fluxes at the times of the radio epochs in order to account for potential short-timescale (<1 d) X-ray variability. Using RXTE-PCA data from all 7 archival outbursts of Aql X-1 (190 observations), we found that the average maximum fractional difference in fluxes of two adjacent X-ray observations (Δfl = |fl1 − fl2|/fl1) is proportional to the time between observations (Δt in days) in the form: Δfl = 0.2 × Δt + 0.005. We therefore increased the uncertainty on each interpolated X-ray flux (typically by ∼6 times compared to the formal uncertainties) using this formula and the separation in time between the radio epoch and closest available X-ray observation. When the source was dim, the formal errors on the X-ray fluxes dominated.
The 1–10 keV X-ray fluxes were converted into luminosities using LX = 4πD2S, where S is the observed flux and D is distance to the source. The 5 GHz radio luminosities were calculated using LR = 4πνD2Sν, where ν is the central frequency and Sν is the observed flux density. To incorporate radio measurements at different frequencies (∼4–12 GHz) we assumed a flat spectral index, which is consistent with previous multiband radio measurements of Aql X-1 in the hard X-ray state (Miller-Jones et al. 2010a; Díaz Trigo et al. 2018).
A summary of all 2016 and archival radio–X-ray measurements used in this study is provided in Table A1. The figures of the Appendix (Figs A1–A7) show light curves, hardness-intensity diagrams and LR–LX diagrams for each of the archival outbursts individually.
3.2 Radio–X-ray correlation
3.2.1 Fitting method
As in Gallo et al. (2018), we calculated the median values of β, ξ, and σ0 from 10 000 draws of the posterior distribution, and determined 1σ confidence intervals using the 16–84th percentiles of the posterior distributions. Additionally, we performed 500 realizations of this method in order to confirm that the results were robust. The quoted values in Table 2 are the average of these realizations.
Results of the power-law fit for different selections of observations. The first column indicates the assumed HR threshold for data selection. The sixth column indicates whether the 2016 outburst data were included (‘+’ sign) or excluded (‘−’ sign) while performing the fit. All uncertainties are 1σ. Highlighted in bold is our preferred fit, which uses HR >0.75, and includes upper limits as well as the 2016 outburst data.
| Only detections | Detections + upper limits | ||||||
|---|---|---|---|---|---|---|---|
| HR | Index | Scatter | Intercept | Index | Scatter | Intercept | 2016 |
| > | β | σ0 (dex) | ξ | β | σ0 (dex) | ξ | outburst |
| 0.54 | 0.32 ± 0.18 | |$0.03^{+0.02}_{-0.01}$| | 0.00 ± 0.05 | |$0.74^{+0.21}_{-0.18}$| | |$0.05^{+0.04}_{-0.02}$| | |$-0.14^{+0.05}_{-0.07}$| | – |
| 0.36 ± 0.14 | 0.02 ± 0.01 | 0.00 ± 0.04 | |$1.01^{+0.17}_{-0.14}$| | |$0.08^{+0.05}_{-0.03}$| | |$-0.18^{+0.06}_{-0.07}$| | + | |
| 0.75 | |$0.34^{+0.29}_{-0.28}$| | |$0.04^{+0.05}_{-0.02}$| | 0.00 ± 0.07 | |$0.94^{+0.38}_{-0.28}$| | |$0.10^{+0.11}_{-0.05}$| | |$-0.20^{+0.09}_{-0.12}$| | – |
| 0.39 ± 0.20 | |$0.04^{+0.04}_{-0.02}$| | 0.00 ± 0.07 | |$\mathbf {1.17^{+0.30}_{-0.21}}$| | |$\mathbf {0.13^{+0.12}_{-0.06}}$| | |$\mathbf {-0.26^{+0.09}_{-0.13}}$| | + | |
| 0.96 | |$0.27^{+0.23}_{-0.22}$| | |$0.02^{+0.03}_{-0.01}$| | −0.08 ± 0.06 | |$0.73^{+0.34}_{-0.22}$| | |$0.05^{+0.11}_{-0.03}$| | |$-0.25^{+0.08}_{-0.14}$| | – |
| |$1.23^{+0.52}_{-0.29}$| | |$0.16^{+0.31}_{-0.10}$| | |$-0.35^{+0.13}_{-0.23}$| | + | ||||
3.2.2 Selection criteria and fit results
Differences in the criteria used to select what data points are included in the fitting procedure can lead to significant differences in the resulting inferred power-law index. Such selection effects are, in fact, responsible for the difference in power law indices previously reported in the literature: β = 0.40 ± 0.07 (Tudose et al. 2009) and |$\beta = 0.76^{+0.14}_{-0.15}$| (Tetarenko et al. 2016). Tudose et al. (2009) used radio–X-ray observations of Aql X-1 performed during its 2002, 2004, and 2005 outbursts, including all radio observations, regardless of X-ray state. Tetarenko et al. (2016) used data points from the 2004, 2006, 2007, and 2009 outbursts of Aql X-1, but excluded radio observations that were performed in the soft X-ray state (HR <0.75 according to their definition, which is the same as used here). In both cases the authors did not include radio upper limits when performing their fits.
For our analysis, we used data from all eight outbursts for which quasi-simultaneous radio – X-ray data are available (see Fig. 2, Table A1, and Figs A1–A7). According to the classification of Campana et al. (2014), the 2002, 2004, 2005, 2006, and 2016 outbursts are FRED-like; the May 2007 outburst is multipeaked; and the October 2007 and 2009 outbursts are Gaussian-like. Alternatively, Güngör et al. (2017) classifies all these outbursts as low-luminosity, with the exception of the 2016 outburst. As in previous studies, we assume that – regardless of the outburst classification – the LR– LX correlation behaves similarly between outbursts. We do this because of the relatively low number of available observations, and argue that this is justified by the fact that these measurements occupy the same region in the LR–LX diagram (within the scatter), without obvious systematic offsets between outbursts (Fig. 2).
We performed fits using three different HR thresholds (HR >0.54, 0.75, and 0.96), both including and excluding upper limits, as well as with and without the 2016 outburst – see Table 2 for a summary. The data points corresponding to the various selection criteria are shown in Fig. 3.
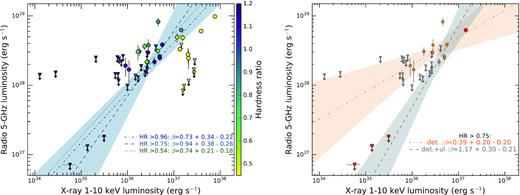
Quasi-simultaneous X-ray (1–10 keV) luminosity versus radio (5 GHz) luminosity for Aql X-1. Circles and downward-pointing triangles represent radio detections and upper limits, respectively. Left: All radio – X-ray observations used in our study. Their colours represent HR, defined as the ratio of 9.7–16 keV and 6.0–9.7 keV fluxes. Different lines represent the results of the fit using different HR thresholds and using only the archival data (i.e. the 2016 outburst data are not used in the fits shown here, but the data points are shown none the less in order to demonstrate their consistency with the fit to archival data points): dotted line HR >0.54, dashed line HR >0.75, and dash–dotted line HR >0.96. The blue-shaded area is the inferred 1σ uncertainty on the resulting slope for HR >0.75. Right: All radio–X-ray observations with HR >0.75 are included in the fits shown here. Orange and grey symbols indicate archival detections and non-detections, respectively. Red symbols indicate the data from the 2016 outburst. The power-law fit using only radio detections is shown by the dash-dot-dotted line, with the orange shaded area representing its 1σ uncertainty. Similarly, the dashed grey line and grey shaded area represents the power-law fit to the data using both radio detections and upper limits. Radio data points are taken from Tudose et al. (2009) and Miller-Jones et al. (2010a) for outbursts before 2016 and from Díaz Trigo et al. (2018) for radio detections during the 2016 outburst.
The inferred slope changed with HR threshold, but within the uncertainties (Fig. 3 and Table 2). To allow direct comparison with previous studies, we adopt the threshold value of HR >0.75. The inclusion of upper limits produces a steeper slope compared to that previously reported in the literature, even if the 2016 outburst is left out. The inclusion of the 2016 outburst also leads to a consistent steep power-law index, which is consistent with the strong VLA radio upper limits at relatively low X-ray luminosity. In summary, our preferred fit uses HR >0.75, and includes upper limits as well as the 2016 outburst data.
One can also consider the constraints on the LR– LX correlation that can be derived using the 2016 outburst measurements alone. Unfortunately, given the relatively small number of hard-state observations (four in total with HR >0.75), the linmix_err method does not converge. Alternatively, we fit the 2016 outburst data points using a simple least-squares method, in which the upper limits were treated as 3σ detections. This resulted in a best-fitting slope β = 0.82, which is roughly speaking a 3σ lower limit on the steepness of the slope. This indicates that the 2016 data are consistent with the slope inferred from modelling all outbursts together.
4 DISCUSSION
Using the VLA, we have performed high-sensitivity, quasi-simultaneous radio – X-ray observations of Aql X-1 that probe an order of magnitude deeper in radio luminosity compared to previous studies. This allows us to meaningfully constrain the LR–LX correlation of Aql X-1 over 2 dex, down to low X-ray luminosities (6 × 1034 erg s−1 < LX < 3 × 1035 erg s−1), as the source was fading from outburst.
ATCA detections of radio emission from Aql X-1 during the same outburst indicate that the jet was present throughout the outburst when LX >5 × 1036 erg s−1 (Díaz Trigo et al. 2018). The last ATCA detection (with HR =0.64) was performed just 6 d before our first VLA observation. Thus our VLA non-detections are indeed indicative of a fading jet.
Here we discuss the derived constraints on the LR– LX correlation for Aql X-1, compare its behaviour to other NS-LMXBs, and discuss the motivation for future radio–X-ray observations.
4.1 LR–LX correlation in Aql X-1
Aql X-1’s jet behaviour during the 2016 outburst was possibly somewhat unusual: unlike what was previously observed (Miller-Jones et al. 2010a), the radio emission was not seen to quench at X-ray luminosities above 1037 erg s−1 (in the soft X-ray state), and rather reached a record brightness of 810 µJy at 5.5 GHz. However, the sparse observational sampling may mean that the quenching period was simply missed. Noteworthy is that the 2016 outburst is the only high-luminosity outburst (reaching about factor of 5 higher X-ray luminosity; see Güngör et al. 2014) of Aql X-1 for which both radio and X-ray observations were performed, and thus they probed unprecedentedly high X-ray luminosities. None the less, and as discussed before, the radio luminosities of the two observations performed during the (relatively) hard state (at LX ∼ 1036−37 erg s−1) are consistent with previous observations from past outbursts. This suggests that it is appropriate to combine the 2016 outburst measurements with those of previous outbursts to study the LR–LX correlation of Aql X-1 using the largest available data set.
4.1.1 Modelling LR–LX with a single power law
We collected all archival radio and X-ray measurements prior to 2016 and fit these with a slope β = |$0.94^{+0.38}_{-0.28}$|. As we discuss in Section 3 and summarize in Table 2, the slope is highly dependent on the inclusion of radio upper limits. While we exclude soft-state measurements, the slope depends only slightly on the chosen hardness ratio threshold. Ultimately, we find a slope that is consistent within uncertainties with the |$\beta = 0.76^{+0.14}_{-0.15}$| of Tetarenko et al. (2016), despite the fact they used data from fewer outbursts and only included detections in their fitting. Based on this slope, Tetarenko et al. (2016) suggested that Aql X-1 is consistent with being radiatively inefficient, and similar to BH-LMXBs. However, it is hard to draw robust conclusions from the previously available data because of the limited number of measurements and the fact that they span only ∼1 dex in radio and X-ray luminosity.
The 2016 measurements probe ∼2 dex in luminosity and provide significant new constraints. Including the 2016 outburst and all archival data, the resulting slope is β = |$1.17^{+0.30}_{-0.21}$| for HR >0.75. This is steeper than what has been reported in the previous studies mentioned above, but also consistent with what we obtained using only archival data. Given the small number of available observations, it is not possible to perform a robust separate fit to the 2016 outburst data alone, but these data are consistent with the global fit. In the framework of models in which jet power is a fixed fraction of the accretion power, this newly inferred slope β = |$1.17^{+0.30}_{-0.21}$| indicates that Aql X-1 has a more radiatively efficient accretion inflow than what was previously reported.
Recently, Qiao & Liu (2019) also used pre-2016 archival data of Aql X-1 and found a shallow (β ∼ 0.4) correlation between the radio and X-ray luminosities. These results are comparable to ours if we omit radio upper limits in our fitting (see Table 2). However, as we demonstrate, the inclusion of upper limits results in a steeper β =|$0.94^{+0.38}_{-0.28}$|. In their work, Qiao & Liu (2019) attempt to explain their fitted correlation of β ∼ 0.4 with a coupled advection-dominated accretion (ADAF)-jet model (Yuan & Cui 2005; Done, Gierliński & Kubota 2007), where they assume that the accretion flow is always radiatively efficient for NSs, but that the fraction of the jet power to the accretion power is not constant. They assume that β ∼ 0.4 correlation holds down to low X-ray luminosities (LX ∼1034−36 erg s−1) and predict the corresponding radio luminosities to be LR ∼1–4 × 1028 erg s−1. Our VLA upper limits on radio luminosity are about an order of magnitude fainter than was predicted by Qiao & Liu (2019). Therefore, such a scenario is inconsistent with our new 2016 observations. Moreover, the β = |$0.94^{+0.38}_{-0.28}$| that we find for archival data (including upper limits) suggests that the scenario is also inconsistent with the observations from previous outbursts.
4.1.2 Modelling LR–LX with a low-luminosity radio cut-off
Instead of fitting all data with an assumed single power-law correlation, we can also consider a model in which the radio brightness suddenly drops below a critical X-ray luminosity. This could be the case if a minimal accretion rate is necessary to sustain a steady jet.
The position of our new VLA observations of Aql X-1 in the LR–LX diagram may indicate a sudden step in radio luminosity, rather than a smooth decay. Indeed, during 2016 outburst, the X-ray luminosity at the time of the last ATCA detection and the first VLA upper-limit is different by a factor of 14, while the radio luminosity drops by more than a factor of 24. Furthermore, our first VLA non-detection (with LX ∼ 3 × 1035 erg s−1, LR ≤ 1.5 × 1027 erg s−1) is different from the lowest X-ray luminosity archival data point (LX ∼ 5.5 × 1035 erg s−1, LR ≤ 1.4 × 1028 erg s−1) by approximately a factor of 2 in X-ray luminosity, but by more than an order of magnitude in radio luminosity. This again assumes that we can compare separate outbursts.
Given the above, it may be questionable to impose a single power law over the entire LX regime between LX ∼ 6 × 1034 erg s−1 and LX ∼1037 erg s−1. Instead, it could be that Aql X-1 is switching between two physically different accretion modes around some critical X-ray luminosity, above which LR–LX follows a shallow β ∼ 0.8 correlation, and below which the jet switches off (or becomes undetectable at 5–10 GHz) or does not follow a power-law correlation at all over this broad luminosity range. Dense sampling of the outburst decay is needed to explore this possibility.
4.2 Comparison to other NS-LMXBs
We now compare Aql X-1 to other NS-LMXBs with quasi-simultaneous radio and X-ray observations (Fig. 4, and associated references).
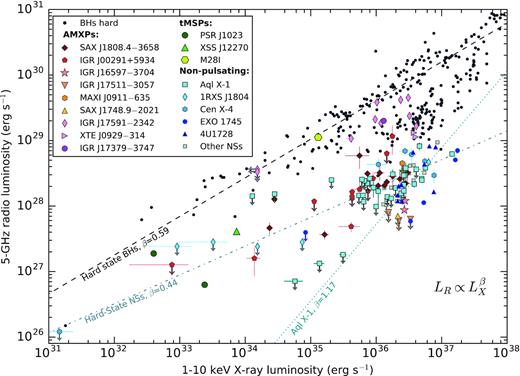
X-ray (1–10 keV) luminosity versus radio (5 GHz) luminosity for hard state (HR ≳ 0.75) BH- and NS-LMXBs. Black circles represent BH-LMXBs; blue symbols represent non-pulsating NS-LMXBs for which many observations have been obtained and grey squares represent other non-pulsating NSs; red, pink, and yellow symbols represent AMXPs and green symbols represent tMSPs. Individual sources within groups are shown in different symbols and colour tones. Data points are taken from: Bahramian et al. (2018) for BHs hard; Tudose et al. (2009), Miller-Jones et al. (2010a), and Díaz Trigo et al. (2018) for Aql X-1; Gusinskaia et al. (2017) for 1RXS J180408.9−342058; Tetarenko et al. (2016) for EXO 1745−248; Migliari et al. (2003) for 4U1728−34; Papitto et al. (2013) for M28I; Hill et al. (2011) for XSS J12270−4859; Bogdanov et al. (2018) for PSR J1023+0038; Tudor et al. (2017) for SAX J1808.4−3658, IGR J00291−5934, and IGR J17511−3057; Tetarenko et al. (2018) for IGR J16597−3704, Tudor et al. (2016) for MAXI J0911−635; Miller-Jones et al. (2010b), Tetarenko et al. (2017) for SAX J1748.9−2021; Russell et al. (2018) and Gusinskaia et al. (2019) for IGR J17591−2342; Migliari, Miller-Jones & Russell (2011) for XTE J0929−314; van den Eijnden et al. (2018) for IGR J17379−3747; Migliari & Fender (2006) for other NSs. Correlation tracks for hard state BHs (dashed black line) and NSs (dash–dotted grey line) are defined in Gallo et al. (2018); light blue dotted line represents the result of our preferred fit for Aql X-1.
The best-studied regime is at high X-ray luminosities (LX > 1036 erg s−1), where over a dozen systems have been observed. These show a broad range of radio luminosities for comparable X-ray luminosity. Aql X-1 is one of the fainter systems, being e.g. ∼15× less bright compared to IGR J17591−2342 (Russell et al. 2018). The origin of this large spread in radio luminosity is unclear. Presumably it could depend on viewing geometry, the magnetic field strength of the neutron star, its spin rate, and the inclination of the magnetic axis with respect to the orbital angular momentum. Determining which of these (or other) physical parameters are most relevant requires additional observations and numerical simulations. To date, the larger the number of NS-LMXBs that have been studied, the larger the diversity in their LR–LX behaviour. Aql X-1 has shown intermittent pulsations for a period of only 150 s (Casella et al. 2008). In the (perhaps unlikely) situation that it shows pulsations for a longer period during a future outburst, simultaneous radio observations can determine whether this has a demonstrable effect on the observed LR–LX behaviour. The same argument applies to other intermittent AMXPs.
The situation is even more unclear at intermediate X-ray luminosities (1034 erg s−1 < LX < 1036 erg s−1), where only five systems have been observed, and only two detected. Both detected systems are AMXPs (SAX J1808.4−3658 and IGR J00291−5934), which led Tudor et al. (2017) to contemplate why these are surprisingly bright and apparently launch jets at relatively low X-ray luminosity. Our strong radio upper limits in this X-ray luminosity range for Aql X-1 show that it is certainly dimmer than the two detected AMXPs and consistent with the non-detections of two non-pulsating NS-LMXB systems (1RXS J180408.9−342058 and EXO 1745−248). However, given the large spread in radio luminosity at higher X-ray luminosity, the interpretation is unclear. It is too early to state that AMXPs are brighter on average compared to non-pulsating NS-LMXBs. Indeed, Gallo et al. (2018) concluded that there is no strong evidence for a systematic difference between AMXPs and non-pulsating NS-LMXBs. Here too, many more NS-LMXBs need to be observed, though this is challenging given their low radio brightness and will require using the most sensitive recently commissioned (MeerKAT) and future (Square Kilometre Array) radio telescopes.
Finally, at low X-ray luminosities (LX < 1034 erg s−1), typically referred to as ‘quiescent’ state, the only radio-detected NS systems are the tMSPs PSR J1023+0038 and XSS J12270−4859. As previously discussed (Section 1), their radio–X-ray behaviour is demonstrably different compared to NS-LMXBs observed at higher accretion rate, and they are likely in a fundamentally different accretion regime. It would be very interesting to know whether Aql X-1 enters a similar regime during quiescence; however, given that it is at least three times further away compared to PSR J1023+0038, its expected radio flux density may be only ∼10 µJy. PSR J1023+0038 showed anticorrelated radio–X-ray brightness variations in which the radio flux density changed by a factor of ∼3 between X-ray high and low modes. A similar, strictly simultaneous radio–X-ray campaign on Aql X-1 during quiescence would likely require the sensitivity of future instruments like the Square Kilometre Array and Athena in order to be successful. However, Cen X-4 is similarly nearby to PSR J1023+0038 and remains undetected in radio (Tudor et al. 2017). This suggests that not all NS-LMXBs enter a low-luminosity accretion regime similar to that observed in the tMSPs. Possible explanations include the neutron star magnetic field strength or spin rate.
Despite the complications described above, there have been attempts to describe the population of NS-LMXBs with a single LR–LX relation. Gallo et al. (2018) studied the LR–LX correlation of all NS-LMXBs combined as well as for different NS-LMXB classes. They found a correlation for the combined sample of NS-LMXBs with a slope |$\beta = 0.44^{+0.05}_{-0.04}$| and |$\beta = 0.71^{+0.11}_{-0.09}$| for only atoll-type NS-LMXBs, both suggestive of radiatively inefficient accretion. Surprisingly, this result does not match what was so far observed in individual atoll-type NS-LMXBS for which the LR–LX correlation was studied in detail. As mentioned earlier, power-law slopes of β = 1.5 ± 0.2, |$\beta = 1.68^{+0.10}_{-0.09}$|, and β =|$1.17^{+0.30}_{-0.21}$| were found for 4U 1728−34, EXO 1745−248, and Aql X-1, respectively – all consistent with radiatively efficient accretion. This argues that differences in the behaviour of individual sources – such as inconsistent LR– LX relationships (Tudor et al. 2017) or radio luminosity offset (Tetarenko et al. 2016) – are significant.
4.3 Conclusions
In summary, we have acquired quasi-simultaneous radio–X-ray observations that allow us to provide the strongest-ever constraints on the radio brightness of Aql X-1 at low X-ray luminosities (LX < 1036 erg s−1). We combine these new measurements with an exhaustive re-analysis of all available radio–X-ray data from seven previous outbursts of Aql X-1. When modelling this combined data set with a single power law, we find a slope of |$1.17^{+0.30}_{-0.21}$|, which is steeper than previously reported results in the literature and is consistent with radiatively efficient accretion. The inclusion of radio upper limits, which were ignored in the fits of previous studies, already lead to a steep inferred slope (|$0.94^{+0.38}_{-0.28}$|) even if the 2016 outburst is excluded.
ACKNOWLEDGEMENTS
NVG acknowledges funding from Netherlands Research School for Astronomy (NOVA). JWTH acknowledges funding from an Netherlands Organisation for Scientific Research (NWO) Vidi fellowship and from the European Research Council under the European Union’s Seventh Framework Programme (FP/2007-2013) / ERC Starting Grant agreement nr. 337062 (‘DRAGNET’). The Australia Telescope Compact Array is part of the Australia Telescope National Facility, which is funded by the Australian Government for operation as a National Facility managed by Commonwealth Scientific and Industrial Research (CSIRO). JCAM-J is the recipient of an Australian Research Council Future Fellowship (FT140101082), funded by the Australian government. ND is supported by a Vidi grant from NWO.
Footnotes
Assuming a power-law spectrum, where radio flux density, Sν, is proportional to frequency, ν, as Sν ∝ να, and where α ≈ 0 is defined as flat.
REFERENCES
APPENDIX A:
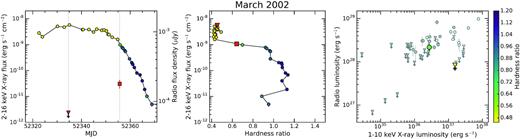
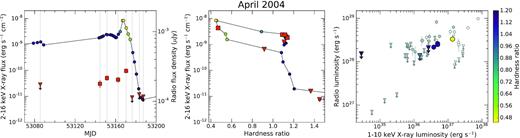
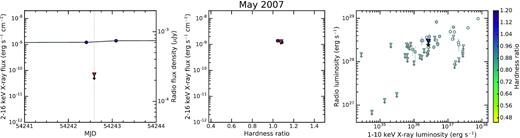
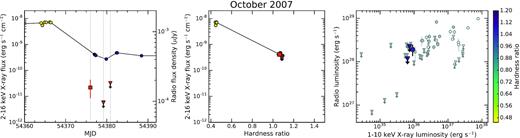
Radio and X-ray observations of 2002 March outburst. In each plot, colour scatter of points represents the HR (see colour bar on the right-hand side of this figure) defined as 9.7–16 keV flux / 6.0–9.7 keV flux. Left: Circular symbols represent the RXTE-PCA (2–16 keV) X-ray light-curve (using the left-hand axis). Red symbols represent the VLA 8.46 GHz radio flux density (using the right-hand axis; squares: detection and triangles: upper limits). Middle: HID of the same outburst. The red symbols indicate at what stage of the outburst the radio observations were taken (squares: detection and triangles: upper limits). Right: Quasi-simultaneous X-ray (1–10 keV) luminosity versus radio (5 GHz) luminosity for Aql X-1. Circles and downward-pointing triangles represent radio detections and upper limits, respectively. Grey and white symbols represent hard (HR > 0.75) and soft (HR < 0.75) X-ray state observations, respectively. Big coloured symbols indicate observations from 2002 March outburst.
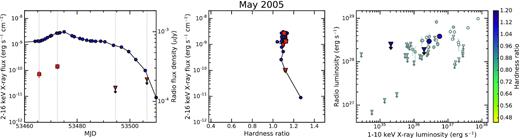
Same as Fig. A1, but for the 2005 May outburst and with radio observations taken at 4.86 GHz.
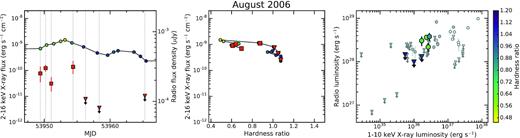
Same as Fig. A1, but for the 2006 August outburst and with radio observations taken at 4.86 and 8.46 GHz.
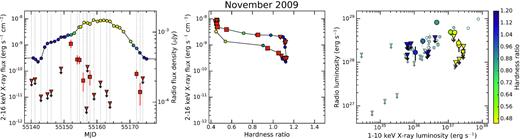
Same as Fig. A1, but for the 2009 November outburst and with radio observations taken with the VLA at 8.46 GHz, with the VLBA at 8.41 GHz and with the EVN at 5 GHz.
All radio and X-ray quasi-simultaneous observations used in this study.
| Out-burst | Radio (VLAa) | X-ray (RXTE-PCA) | Radio | X-ray | |||||
|---|---|---|---|---|---|---|---|---|---|
| MJD | Sν (μJy) | Tel. ν (GHz) | MJD | Unabsorbed flux × 10−10 (|$\mathrm{erg\, s^{-1}\, cm^{-2}}$|) | HR | Lum.b × 1028 (|$\mathrm{erg\, s^{-1}}$|) | Lum.b × 1036 (|$\mathrm{erg\, s^{-1}}$|) | HR | |
| Mar. | 52334.620 | <69 | 8.46 | 52332.922 | 33.74 ± 0.19 | 0.47 ± 0.01 | <0.84 | 15.59 ± 1.38 | 0.46 ± 0.03 |
| 2002 | 52335.036 | 75.41 ± 0.23 | 0.45 ± 0.01 | ||||||
| 52355.670 | 179 ± 26 | 8.46 | 52354.851 | 19.33 ± 0.07 | 0.43 ± 0.01 | 2.17 ± 0.31 | 2.72 ± 0.10 | 0.64 ± 0.02 | |
| 52355.838 | 10.06 ± 0.04 | 0.70 ± 0.01 | |||||||
| Apr. | 53085.560 | <174 | 8.46 | 53085.933 | 10.93 ± 0.04 | 1.11 ± 0.01 | <2.11 | 2.65 ± 0.01 | 1.11 ± 0.01 |
| 2004 | 53144.500 | 179 ± 22 | 8.46 | 53143.651 | 15.56 ± 0.07 | 1.12 ± 0.01 | 2.17 ± 0.27 | 3.81 ± 0.12 | 1.14 ± 0.02 |
| 53144.627 | 15.73 ± 0.06 | 1.14 ± 0.01 | |||||||
| 53151.420 | 216 ± 19 | 8.46 | 53150.922 | 20.66 ± 0.10 | 1.06 ± 0.01 | 2.62 ± 0.23 | 4.93 ± 0.31 | 1.07 ± 0.02 | |
| 53151.707 | 20.18 ± 0.09 | 1.07 ± 0.01 | |||||||
| 53162.370 | 205 ± 19 | 8.46 | 53160.757 | 15.96 ± 0.06 | 1.13 ± 0.01 | 2.48 ± 0.23 | 4.97 ± 0.32 | 1.11 ± 0.02 | |
| 53162.668 | 21.50 ± 0.08 | 1.11 ± 0.01 | |||||||
| 53170.350 | 274 ± 22 | 8.46 | 53170.404 | 55.89 ± 0.17 | 0.47 ± 0.01 | 3.32 ± 0.27 | 13.54 ± 0.04 | 0.47 ± 0.01 | |
| 53176.290 | <114 | 8.46 | 53174.408 | 17.23 ± 0.06 | 0.56 ± 0.01 | <1.38 | 1.48 ± 0.19 | 0.91 ± 0.04 | |
| 53176.919 | 4.32 ± 0.02 | 1.08 ± 0.01 | |||||||
| 53183.290 | <126 | 8.46 | 53182.753 | 0.16 ± 0.01 | 1.20 ± 0.18 | <1.53 | 0.03 ± 0.00 | 1.36 ± 0.34 | |
| 53184.720 | 0.05 ± 0.00 | 1.90 ± 0.30 | |||||||
| 53187.230 | <117 | 8.46 | 53186.758 | 0.05 ± 0.00 | 1.45 ± 0.34 | <1.42 | 0.01 ± 0.00 | 1.45 ± 0.34 | |
| May | 53465.540 | 245 ± 29 | 4.86 | 53465.073 | 11.60 ± 0.06 | 1.08 ± 0.01 | 2.97 ± 0.35 | 2.77 ± 0.08 | 1.12 ± 0.01 |
| 2005 | 53465.660 | 11.40 ± 0.04 | 1.13 ± 0.01 | ||||||
| 53472.500 | 317 ± 30 | 4.86 | 53472.221 | 23.25 ± 0.10 | 1.06 ± 0.01 | 3.84 ± 0.36 | 5.63 ± 0.34 | 1.10 ± 0.02 | |
| 53472.810 | 23.25 ± 0.08 | 1.14 ± 0.01 | |||||||
| 53494.520 | <156 | 4.86 | 53493.789 | 8.15 ± 0.04 | 1.10 ± 0.01 | <1.89 | 1.97 ± 0.01 | 1.10 ± 0.01 | |
| 53506.480 | <207 | 4.86 | 53505.848 | 0.86 ± 0.01 | 1.12 ± 0.03 | <2.51 | 0.21 ± 0.01 | 1.12 ± 0.03 | |
| Aug. | 53949.404 | 252 ± 64 | 4.86 | 53949.415 | 6.92 ± 0.03 | 0.70 ± 0.01 | 3.05 ± 0.78 | 1.68 ± 0.01 | 0.70 ± 0.01 |
| 2006 | 53950.209 | 300 ± 35 | 8.46 | 53949.415 | 6.92 ± 0.03 | 0.70 ± 0.01 | 3.63 ± 0.42 | 2.33 ± 0.08 | 0.61 ± 0.02 |
| 53950.347 | 10.19 ± 0.04 | 0.60 ± 0.01 | |||||||
| 53951.062 | 180 ± 42 | 8.46 | 53950.347 | 10.19 ± 0.04 | 0.60 ± 0.01 | 2.18 ± 0.51 | 2.61 ± 0.21 | 0.64 ± 0.03 | |
| 53951.445 | 11.09 ± 0.04 | 0.67 ± 0.01 | |||||||
| 53954.377 | 313 ± 67 | 4.86 | 53954.204 | 12.19 ± 0.05 | 0.86 ± 0.01 | 3.79 ± 0.81 | 2.82 ± 0.11 | 0.87 ± 0.02 | |
| 53955.973 | 7.59 ± 0.04 | 1.00 ± 0.01 | |||||||
| 53956.269 | <108 | 8.46 | 53955.973 | 7.59 ± 0.04 | 1.00 ± 0.01 | <1.31 | 1.69 ± 0.11 | 1.01 ± 0.02 | |
| 53958.059 | 4.25 ± 0.02 | 1.05 ± 0.01 | |||||||
| 53958.354 | <81 | 8.46 | 53958.059 | 4.25 ± 0.02 | 1.05 ± 0.01 | <0.98 | 1.00 ± 0.06 | 1.05 ± 0.02 | |
| 53959.634 | 3.56 ± 0.02 | 1.03 ± 0.01 | |||||||
| 53965.282 | <120 | 8.46 | 53964.610 | 3.11 ± 0.02 | 1.07 ± 0.02 | <1.45 | 0.55 ± 0.02 | 1.07 ± 0.03 | |
| 53965.460 | 2.07 ± 0.01 | 1.07 ± 0.02 | |||||||
| May | 54242.589 | <243 | 8.46 | 54242.409 | 10.39 ± 0.04 | 1.10 ± 0.01 | <2.94 | 2.64 ± 0.11 | 1.09 ± 0.02 |
| 2007 | 54243.086 | 12.38 ± 0.05 | 1.06 ± 0.01 | ||||||
| Oct. | 54376.003 | 158 ± 47 | 8.46 | 54376.994 | 3.74 ± 0.02 | 1.06 ± 0.02 | 1.91 ± 0.57 | 0.91 ± 0.00 | 1.06 ± 0.02 |
| 2007 | 54379.181 | <96 | 8.46 | 54377.325 | 3.35 ± 0.02 | 1.09 ± 0.01 | <1.16 | 0.64 ± 0.09 | 1.08 ± 0.04 |
| 54379.867 | 2.43 ± 0.02 | 1.08 ± 0.02 | |||||||
| 54380.865 | <183 | 8.46 | 54379.867 | 2.43 ± 0.02 | 1.08 ± 0.02 | <2.22 | 0.74 ± 0.15 | 1.08 ± 0.05 | |
| 54382.364 | 4.25 ± 0.02 | 1.07 ± 0.01 | |||||||
| Nov. | 55140.125 | <201 | 8.46 | 55140.666 | 2.73 ± 0.01 | 1.12 ± 0.02 | <2.43 | 0.66 ± 0.00 | 1.12 ± 0.02 |
| 2009 | 55141.185 | <210 | 8.46 | 55140.666 | 2.73 ± 0.01 | 1.12 ± 0.02 | <2.54 | 0.60 ± 0.03 | 1.11 ± 0.02 |
| 55141.379 | 2.42 ± 0.01 | 1.11 ± 0.02 | |||||||
| 55142.992 | <120 | 8.46 | 55142.093 | 1.95 ± 0.01 | 1.12 ± 0.02 | <1.45 | 0.63 ± 0.01 | 1.13 ± 0.03 | |
| 55143.074 | 2.65 ± 0.01 | 1.13 ± 0.02 | |||||||
| 55144.966 | <129 | 8.46 | 55144.122 | 7.13 ± 0.03 | 1.11 ± 0.01 | <1.56 | 2.40 ± 0.01 | 1.11 ± 0.02 | |
| 55144.967 | 9.91 ± 0.04 | 1.11 ± 0.01 | |||||||
| 55146.089 | <141 | 8.46 | 55146.083 | 10.89 ± 0.05 | 1.12 ± 0.01 | <1.71 | 2.64 ± 0.02 | 1.12 ± 0.02 | |
| 55147.142 | 11.93 ± 0.06 | 1.11 ± 0.01 | |||||||
| 55149.080 | <300 | 8.46 | 55148.246 | 13.94 ± 0.06 | 1.11 ± 0.01 | <3.63 | 4.09 ± 0.03 | 1.05 ± 0.01 | |
| 55149.094 | 16.92 ± 0.09 | 1.05 ± 0.01 | |||||||
| 55152.072 | 679 ± 91 | 8.46 | 55151.189 | 20.16 ± 0.08 | 0.96 ± 0.01 | 8.23 ± 1.10 | 4.58 ± 0.11 | 0.86 ± 0.01 | |
| 55152.170 | 18.76 ± 0.07 | 0.85 ± 0.01 | |||||||
| 55154.000 | 406 ± 62 | 4.86 | 55153.080 | 32.10 ± 0.11 | 0.69 ± 0.01 | 4.92 ± 0.75 | 11.69 ± 1.47 | 0.54 ± 0.03 | |
| 55154.602 | 62.98 ± 0.20 | 0.46 ± 0.01 | |||||||
| 55154.698 | 400 ± 50 | EVN | 55154.602 | 62.98 ± 0.20 | 0.46 ± 0.01 | 4.85 ± 0.61 | 15.40 ± 0.37 | 0.46 ± 0.01 | |
| 5.00 | 55155.043 | 65.81 ± 0.21 | 0.47 ± 0.01 | ||||||
| 55155.810 | 203 ± 62 | 8.46 | 55155.043 | 65.81 ± 0.21 | 0.47 ± 0.01 | 2.46 ± 0.75 | 20.72 ± 1.29 | 0.45 ± 0.02 | |
| 55156.095 | 94.28 ± 0.28 | 0.45 ± 0.00 | |||||||
| Nov. | 55156.815 | <81 | 8.46 | 55156.095 | 94.28 ± 0.28 | 0.45 ± 0.00 | <0.98 | 16.61 ± 1.17 | 0.47 ± 0.02 |
| 2009 | 55157.141 | 59.35 ± 0.30 | 0.47 ± 0.01 | ||||||
| 55157.124 | <317 | VLBA | 55156.095 | 94.28 ± 0.28 | 0.45 ± 0.00 | <3.84 | 14.49 ± 0.12 | 0.47 ± 0.01 | |
| 8.41 | 55157.141 | 59.35 ± 0.30 | 0.47 ± 0.01 | ||||||
| 55157.865 | 229 ± 56 | 8.41 | 55157.849 | 83.05 ± 0.26 | 0.46 ± 0.01 | 2.77 ± 0.68 | 20.21 ± 0.16 | 0.46 ± 0.01 | |
| VLBA | 55158.973 | 114.71 ± 0.34 | 0.45 ± 0.00 | ||||||
| 55159.104 | <126 | 8.46 | 55158.973 | 114.71 ± 0.34 | 0.45 ± 0.00 | <1.53 | 27.48 ± 0.86 | 0.45 ± 0.02 | |
| 55160.150 | 103.68 ± 0.31 | 0.45 ± 0.00 | |||||||
| 55161.061 | <189 | VLBA | 55160.150 | 103.68 ± 0.31 | 0.45 ± 0.00 | <2.29 | 28.19 ± 0.17 | 0.46 ± 0.01 | |
| 8.41 | 55161.066 | 116.42 ± 0.35 | 0.46 ± 0.00 | ||||||
| 55162.939 | <140 | VLBA | 55162.047 | 118.39 ± 0.35 | 0.47 ± 0.01 | <1.70 | 27.00 ± 0.61 | 0.46 ± 0.01 | |
| 8.41 | 55163.028 | 110.79 ± 0.33 | 0.46 ± 0.00 | ||||||
| 55163.945 | <96 | 8.46 | 55163.943 | 86.40 ± 0.28 | 0.44 ± 0.01 | <1.16 | 20.92 ± 0.11 | 0.44 ± 0.01 | |
| 55165.120 | 63.60 ± 0.24 | 0.47 ± 0.01 | |||||||
| 55172.005 | 253 ± 36 | 8.46 | 55171.072 | 9.71 ± 0.05 | 0.90 ± 0.01 | 3.06 ± 0.44 | 1.79 ± 0.03 | 0.95 ± 0.02 | |
| 55172.052 | 7.27 ± 0.04 | 0.95 ± 0.01 | |||||||
| 55173.088 | 139 ± 50 | 8.46 | 55173.033 | 4.52 ± 0.02 | 1.05 ± 0.01 | 1.68 ± 0.61 | 1.07 ± 0.02 | 1.05 ± 0.02 | |
| 55174.278 | 2.90 ± 0.02 | 1.09 ± 0.02 | |||||||
| 55173.918 | <217 | VLBA | 55173.033 | 4.52 ± 0.02 | 1.05 ± 0.01 | <2.63 | 0.80 ± 0.06 | 1.08 ± 0.02 | |
| 8.41 | 55174.278 | 2.90 ± 0.02 | 1.09 ± 0.02 | ||||||
| Sep. | 57602.543 | 515 ± 26 | ATCA | 57603.137 | 59.53 ± 1.04 | 0.86 ± 0.09 | 6.24 ± 0.31 | 14.42 ± 0.25 | 0.86 ± 0.09 |
| 2016 | 5.50 | ||||||||
| 57604.509 | 498 ± 19 | ATCA | 57603.137 | 59.53 ± 1.04 | 0.86 ± 0.09 | 6.03 ± 0.23 | 38.70 ± 4.85 | 0.40 ± 0.09 | |
| 5.50 | 57605.111 | 246.33 ± 2.12 | 0.29 ± 0.03 | ||||||
| 57607.599 | 810 ± 19 | ATCA | 57606.140 | 356.41 ± 3.25 | 0.44 ± 0.04 | 9.81 ± 0.23 | 76.65 ± 2.33 | 0.44 ± 0.06 | |
| 5.50 | 57607.726 | 313.12 ± 5.30 | 0.44 ± 0.04 | ||||||
| 57650.354 | 259 ± 13 | ATCA | 57650.597 | 18.73 ± 0.30 | 0.64 ± 0.06 | 3.14 ± 0.16 | 4.54 ± 0.07 | 0.64 ± 0.06 | |
| 5.50 | |||||||||
| 57657.031 | <15 | 10.00 | 57656.293 | 1.95 ± 0.14 | 1.16 ± 0.12 | <0.18 | 0.31 ± 0.04 | >1 | |
| 57657.095 | 1.24 ± 0.09 | 1.16 ± 0.12 | |||||||
| 57658.031 | <11 | 10.00 | 57657.095 | 1.24 ± 0.09 | 1.16 ± 0.12 | <0.13 | 0.14 ± 0.02 | >1 | |
| 57658.558 | 0.36 ± 0.04 | 0.95 ± 0.10 | |||||||
| 57659.181 | <6 | 10.00 | 57658.558 | 0.36 ± 0.04 | 0.95 ± 0.10 | <0.07 | 0.06 ± 0.02 | >1 | |
| 57659.767 | 0.16 ± 0.07 | 1.52 ± 0.15 | |||||||
aUnless specified.
bLuminosities are calculated assuming the distance of 4.5 kpc.
X-ray energy range is 1–10 keV.
