


Abstract
Competitive gene set tests are commonly used in molecular pathway analysis to test for enrichment of a particular gene annotation category amongst the differential expression results from a microarray experiment. Existing gene set tests that rely on gene permutation are shown here to be extremely sensitive to inter-gene correlation. Several data sets are analyzed to show that inter-gene correlation is non-ignorable even for experiments on homogeneous cell populations using genetically identical model organisms. A new gene set test procedure (CAMERA) is proposed based on the idea of estimating the inter-gene correlation from the data, and using it to adjust the gene set test statistic. An efficient procedure is developed for estimating the inter-gene correlation and characterizing its precision. CAMERA is shown to control the type I error rate correctly regardless of inter-gene correlations, yet retains excellent power for detecting genuine differential expression. Analysis of breast cancer data shows that CAMERA recovers known relationships between tumor subtypes in very convincing terms. CAMERA can be used to analyze specified sets or as a pathway analysis tool using a database of molecular signatures.
INTRODUCTION
A gene set test is a differential expression analysis in which a P -value is assigned to a set of genes as a unit. Gene set tests are important because they permit differential expression questions to be posed in terms of ensembles of genes representing pathways or other biologically interpretable processes. Although a great many statistical procedures for gene set testing have been proposed in the literature, they fall into two major categories ( 1 , 2 ). Using the terminology of Goeman and Buhlmann ( 1 ), ‘self-contained’ gene set tests examine a set of genes in their own right without reference to other genes in the genome ( 3–8 ), whereas ‘competitive’ gene set tests compare genes in the test set relative to all other genes. Self-contained tests are of interest for assessing the relevance of an individual biological process to the experiment at hand ( 8 ), whereas the competitive tests focus more on distinguishing the most important biological processes from those that are less important. Competitive tests are overwhelmingly more commonly used in the genomic literature ( 9 ).
Most competitive gene set tests assume independence of genes ( 1 , 9 ), because they evaluate P -values by permutation of gene labels ( 2 , 10 , 11 ), or because they rely on parametric approximations that are asymptotically equivalent to gene permutation ( 12–16 ). A handful of articles have demonstrated that competitive tests are sensitive to inter-gene correlations, and even quite modest correlations can dangerously inflate the apparent false discovery rate (FDR) ( 9 , 10 , 17 , 18 ). Nevertheless, these warnings do not seem to have limited the popularity of such tests, probably because of the lack of satisfactory alternatives that maintain the direct interpretation of competitive tests.
A number of authors have concluded that gene set test P -values should always be evaluated by permutation or resampling of RNA samples, even when a competitive hypothesis is of interest, because sample permutation preserves the inter-gene correlation structure and therefore protects the test against such correlation ( 9 , 17 , 19 , 20 ). This strategy, however, cannot be applied to experiments with small number of biological replicates and, even more crucially, it inevitably alters the hypothesis that is being tested and therefore affects the essential clarity and interpretability of competitive gene set testing. The very popular Gene Set Enrichment Analysis (GSEA) procedure ( 20 ) is of this type. It uses sample permutation to test the significance of a competitive gene test statistic, resulting in a hybrid test for which the null and alternative hypotheses are difficult to characterize in terms of population parameters ( 1 ).
A different attempt is to de-correlate genes in the test set ( 21 ), but such an approach requires the estimation of a covariance matrix with many entries, so the methodology is likely to be limited in practice to experiments with relatively large numbers, at least dozens, of replicate samples. A related approach is to try to approximate covariances between genes using random effects ( 22 , 23 ), but this methodology is limited to special experimental designs and is dependent on commercial statistical software.
This article proposes a new competitive gene set testing procedure that maintains the direct interpretation of competitive tests associated with gene permutation but remains valid even when the genes in the test set are correlated. We call this new method CAMERA, an acronym for Correlation Adjusted MEan RAnk gene set test. The procedure is based on the idea of estimating the variance inflation factor associated with inter-gene correlation, and incorporating this into parametric or rank-based test procedures. The procedure does not assume any particular correlation structure and is suitable for any experiment that can be represented by genewise linear models, not just two-sample comparisons. As only one correlation parameter is being estimated, the procedure remains stable and correctly controls the type I error rate even for experiments with only a small number of biological replicates.
MATERIALS AND METHODS
Linear models
Each gene is assumed to have its own variance,  . Expression values from different arrays are assumed to be independent, but expression values for different genes from the same RNA sample are generally not. The correlations cor( ygi , yg ′ i ) = ρ g , g ′ are generally non-zero. Note that the ρ g , g ′ here represent residual correlations between genes across replicate samples, after the treatment effects μ gi have been removed.
Genewise test statistics
We assume that a specified contrast  of the coefficients is of primary interest, and genewise statistical tests will be conducted of the null hypothesis H0 : β g =0. For example, the contrast might extract the logFC between two specified treatment conditions. More generally, it might represent an interaction term, or any similar quantity of interest to the study at hand. We will use the notation zg to represent any genewise statistic used to test this hypothesis. A number of different genewise statistics will be considered. First, the least squares estimate
  is the observed logFC. Second, the ordinary t -statistic
  , where sg is the residual standard error for gene g and v is obtained from the covariates xij , is the classic univariate test statistic. For a simple two-group comparison, v2 = 1/ n1 + 1/ n2 where n1 and n2 are the group sample sizes. Third, the moderated t -statistic
  , where
  is the empirical Bayes posterior estimator of
  , generally outperforms the ordinary t -statistic for genomic experiments ( 24 ). Under the null hypothesis,
  follows a t -distribution on d + d0 degrees of freedom (df), where d = n − p is the residual degrees of freedom (df) from the linear model and d0 is the prior df, the latter estimated as part of the empirical Bayes procedure ( 24 ). Fourth, a normalized version
  of the moderated t -statistics is considered. Here, F and Ft are the cumulative distribution functions of the standard normal and t -distribution on d + d0 df, respectively. Under the null hypothesis, zg follows a standard normal distribution. Finally, in the context of genomic experiments, it is of interest to consider zg as the rank of
  amongst all genes in the experiment.
Existing competitive gene set tests
In this article, we compare our new proposals to four existing gene set tests: PAGE ( 13 ), sigPathway ( 2 ) and two versions of the ‘geneSetTest’ procedure implemented in the limma software package ( 25 ) of the Bioconductor project ( 26 ). The two geneSetTest versions will be denoted geneSetTest-modt and geneSetTest-ranks, respectively. PAGE is implemented as a Python script obtained from the authors. sigPathway is implemented in a Bioconductor package of the same name. The software implementations of PAGE and sigPathway do not support linear models and, therefore, are restricted to two-group comparisons, although generalizing the procedures to a linear model context is straightforward in principle.
All four gene set procedures conduct global tests comparing genes in the test set to genes not in the test set using the genewise test statistics as observations. Specifically, they determine whether the mean  of the genewise statistics is significantly different for genes in the test set versus genes not in the set. PAGE uses logFC as zg whereas sigPathway uses ordinary t -statistics. geneSetTest can accept any genewise statistic, but is most commonly used with moderated t -statistics. sigPathway and geneSetTest-modt evaluate P -values by randomly permuting the gene labels. PAGE conducts a one-sample z -test, treating
  as normally distributed, with the global mean and standard deviation of the genewise statistics across all genes in the experiment as population parameters under the null hypothesis. geneSetTest-ranks conducts a Wilcoxon–Mann–Whitney (WMW) rank sum test to compare the zg for genes in the set to those for genes not in the set. This amounts to a two-sample z -test using the ranks of the moderated t -statistics as zg . geneSetTest-ranks has also been called ‘mean-rank gene set enrichment’ ( 27 ). For results reported in this article, sigPathway and geneSetTest-modt were set to use 10 000 gene permutations, a number sufficient to generate highly repeatable P -values.
GSEA ( 20 ) differs from the other procedures considered in this article because it tests a hybrid hypothesis and because it is designed to test a battery of gene sets against one another rather than to test an individual gene set against background. For these reasons, GSEA is not included in the simulations but is compared to CAMERA on an example data set. GSEA was implemented using the R-GSEA script from http://www.broadinstitute.org/gsea (16 February 2011, date last accessed).
Variance inflation under correlation
 and
and  is the average of the ρ ij . Note that VIF can be greater or less than one depending on the sign of
  . It cannot, however, be <0 or > m .
 Two-sided t -test allowing for correlation
Consider two groups of genewise statistics, with means  and
and  . The standard two-sample t -statistic for comparing the two groups has the form T = δ/{ sp (1/ m1 + 1/ m2 ) 1/2 } where
  is the difference in means, sp is the pooled residual standard deviation and m1 and m2 are the sample sizes in the first and second groups, respectively. The standard test assumes all observations are statistically independent.
 for the average of all pairwise correlations between genes in the first group. If
  is non-zero, the t -statistic remains asymptotically standard normal if it is redefined to be
 is the variance inflation factor for the first group and
  is a consistent estimator of
  . If m1 + m2 is large, and ρ is estimated on d df, then T is approximately t -distributed on d df, under the null hypothesis of no mean difference between the two populations.
 Write G = m1 + m2 , and write  and s for the mean and standard deviation of all G z -values taken as a single group. For the applications in this article, it is convenient to express T in terms of the first group and the global statistics by writing
  and
and  .
.
Wilcoxon rank sum test allowing for correlation
The WMW rank sum test is a well-known statistical test of whether one set of values is highly ranked relative to another, against the null hypothesis that all values are exchangeable. We implemented the usual WMW test following the formulas given in Section 8.10 of Zar ( 28 ), including corrections for ties and for continuity. The usual WMW test computes a standard normal statistic by dividing the rank sum statistic RankSum by the square root of its variance, var(RankSum) = m1m2 ( m1 + m2 + 1)/12. The z -statistic is then treated as standard normal.
 and d = ∞.
 Estimating the inter-gene correlation
Write Y = { ygi } for the m × n matrix of expression values for genes in the test set. Here, rows correspond to genes and columns to RNA samples. We assume that the expression values can be represented by genewise linear models with n × p design matrix X = { xij }. The rows of the design matrix correspond to RNA samples and the columns to coefficients of the linear model. There are d = n − p df available for estimating the genewise variances  and the correlations ρg , g ′ between pairs of expression values ygi and yg ′ i for the same sample i .
Our aim is to estimate the average correlation  , where the average is over pairwise correlations ρg , g ′ . The first step is to compute d independent residuals for each gene. Write X = QR for the QR-decomposition of the design matrix, where Q is n × n and R is n × p . Here, R is upper-triangular and Q satisfies QTQ = I . An m × d matrix of independent residuals is obtained by U = YQ2 , where Q2 represents the trailing d columns of Q . Note that the matrix U is already available as a by-product of fitting genewise linear models to the expression values using standard numerical algorithms. Extracting it requires no extra computation.
The residual standard error sg for gene g is equal to the root mean square of the corresponding row of U . We standardize each row of U by dividing by sg .
 , which is concordant with the range of theoretical values for the VIF. An estimate of the average correlation can be obtained by solving
  for
for  . This
  is in fact numerically equal to the average of all pairwise correlations in the matrix C , although the need to explicitly form these pairwise correlations has been by-passed.
 If m and d are both reasonably large, and  is relatively small, then
  is approximately distributed as
  . This implies that the standard deviation of
  is approximately VIF(2/ d ) 1/2 , and that the standard deviation of
  is approximately VIF(2/ d ) 1/2 /( m − 1).
Simulations
Simulated data sets were generated with a total of G = 10 000 genes and either two or three groups of RNA samples. Log-expression values were multivariate normal. Genewise variances  were generated from an inverse-chisquare distribution on 4 df. Specifically,
  with d0 = 4 and s0 = 0.25, generating a distribution typical of microarray experiments.
Breast cancer data
Expression profiles of human breast tumors were downloaded from GEO series GSE3165. In order to standardize on one microarray platform, only the 94 arrays of platform GPL887 (Agilent Human 1A Microarray V2) were included in the analysis. Each tumor was classified to one of six molecular subtypes, namely basal-like, luminal A, luminal B, Her2, normal-like and claudin-low ( 30 ). Expression values were normalized and filtered as described previously ( 31 ).
Mammary epithelial cell data
Mammary epithelial cells and stroma cells from three human patients were sorted into four cell populations. RNA samples were profiled on two Illumina HumanWG-6 V3 BeadChips, comprising 12 microarrays. Expression values were normalized and filtered as described previously ( 31 ). The data is available as series GSE16997 in the GEO database ( http://www.ncbi.nlm.nih.gov/geo ).
Mouse hemapoietic stem cell data
Hematopoietic stem cells were isolated from four strains (one wild-type and three mutant strains) of inbred laboratory mice. Cells were further sorted into long-term, short-term and multi-potential progenitors. Between two and four biological replicates were available for each strain and cell type, making a total of 35 RNA samples from 12 experimental groups. RNA was hybridized to Illumina Mouse WG-6 Version 2 microarrays. Intensity values were normexp background corrected and quantile normalized using control probes ( 32 ). Probes that failed to reach a detection P -value of 0.05 on at least two arrays were filtered as not expressed, leaving 25 308 probes.
Ortholog mapping of the molecular signatures database
The Molecular Signatures Database (MSigDB) v3.0 was downloaded from http://www.broadinstitute.org/gsea/msigdb (28 September 2010, date last accessed). Ortholog mapping was used to prepare a pure human version of the MSigDB for use with the human expression data and a pure mouse version for use with the mouse expression data. All gene symbols were updated to latest official symbols using the human and mouse Bioconductor annotation packages ( 26 ). The resulting pure human and mouse gene set collections can be downloaded as R objects from http://bioinf.wehi.edu.au/software/MSigDB . The curated C2 gene set collection contains 3269 gene sets. The human C2 gene sets average 85 genes (median 35, maximum 2282) while the mouse C2 sets average 80 genes (median 34, maximum 1968). Inter-gene correlations were computed for sets containing at least 5 genes (3265 human and 3240 mouse).
RESULTS
Competitive gene set tests
Suppose that a gene expression experiment has been conducted, resulting in expression values for each of G genes (or probes or transcripts) in each of n target RNA samples. The total number of genes is assumed to be large, typically representative of the entire genome. The expression values should be at least roughly normally distributed. Typically, they will be normalized log-intensity values from microarrays. In order to be completely general, we assume that the assignment of experimental conditions to RNA samples can be described by a linear model (See ‘Materials and Methods’ section). This covers all common experimental situations. We assume that genewise tests of differential expression have been conducted, resulting in test statistics zg , one for each gene g .
We assume that a particular set of genes is of prior interest. This a priori specified gene set might represent a molecular pathway believed to be relevant to the experiment, or it might be a gene list from a previous microarray experiment hypothesized to be related to the current experiment. We want to test whether the genes in the gene set are highly ranked in terms of differential expression, that is, whether they tend to be associated with higher than average values of the test statistic. This type of test is inherently ‘competitive’ between genes, because the genes in the set are being compared with genes not in the set. We wish to test whether the test statistics associated with genes in the set tend to be more extreme than those associated with genes not in the set.
The competitive null hypothesis
The hypotheses tested by competitive tests have often not been explicitly stated, or else have been stated informally in terms of test statistics as we have just done. It is often unclear, therefore, exactly what is being tested. We now give a formal statement, in terms of model parameters, of what we consider to be a biologically meaningful null hypothesis for a competitive gene test. Suppose that  represents the indices of genes in the set of interest, and
  c is the complementary set of indices of genes not in the set. For a ‘non-directional’ gene set test, we consider the null hypothesis to be that the average absolute-logFC of genes in the set is the same as that for genes not in the set, i.e. the mean |β g | for g ∈
  is equal to the mean |β g | for g ∈
  c . In intuitive terms, this means that genes in the set are no more differentially expressed on average than genes not in the set. The alternative hypothesis is that the average logFC is greater in absolute size for genes in the set than for those not in the set. Note that the hypotheses are in terms of the true unobserved logFC, not the observed expression log-ratios.
For a ‘directional’ gene set test, we consider the null hypothesis to be that the average logFC of genes in the set is the same as the average logFC of genes not in the set, i.e. the mean β g for g ∈  ,
,  , is equal to the mean β g for g ∈
  c ,
c ,  . The directional hypothesis allows for one-sided or two-sided tests. Unless otherwise stated, all gene set tests in this article will be two-sided directional tests with alternative hypothesis
  .
.
Note that these null hypotheses are more general than supposing the genes in the gene set to be a random sample from the genome or from all those genes on the array. This is because the hypotheses make statements only about the fold changes, not about variances or correlations or other distributional aspects. Note also that the competitive null hypothesis differs from the null hypothesis of self-contained tests. A self-contained gene set test would test the null hypothesis that the logFCs β g are all zero for g ∈  ( 8 ), whereas the competitive null hypothesis may be true even when all or most genes in the set is differentially expressed.
P -values from gene permutation
Competitive gene set tests are usually conducted by permuting gene labels. Typically, the gene set test statistic is the average zg for g ∈  , which we will denote as
  . A P -value is assigned by drawing random gene sets of the same size m from the genes on the array. For the one-sided directional test
  versus the alternative
  , the P -value is the proportion of the gene sets, combining the random sets
  * with the original
  ( 33 ), for which the mean statistic
  . For a two-sided test, the P -value is twice the minimum of the two one-sided P -values.
The genewise test statistic zg might be an ordinary two-sample t -statistic ( 2 ), or a moderated t -statistic ( 24 ), or the estimated logFC ( 13 ). Any relevant genewise statistic could be used. The need to draw random gene sets to estimate the P -value is computationally intensive and can be short-circuited in two ways. First, one can replace the zg by their ranks across all the genes on the array, in which case the permutation P -value can be approximated very accurately using the well-known WMW rank sum test ( 27 ). Second, if the zg are roughly normal, then the permutation P -value can be well-approximated by the standard normal tail probability of  where
where  is the average zg for genes in
  and
and  and s are the mean and standard deviation of the zg over all genes on the array.
In this article, we examine four existing gene set tests. sigPathway ( 2 ) and geneSetTest-modt are permutation methods using the ordinary and moderated t -statistics, respectively. geneSetTest-ranks performs a WMW test using ranks from moderated t -statistics ( 27 ). PAGE uses the standard normal approximation for Z computed from the logFCs ( 13 ).
Inter-gene correlation increases the type I error rate
The process of generating P -values from permutation of gene labels treats all genes on the array as equivalent under the null hypothesis. This assumption will be violated, however, if the genes in the test set are more highly correlated with one another than a random set of genes would be. To illustrate this, we simulated data sets with no differentially expressed genes but for which the 100 genes in the test set share an inter-gene correlation of 0.05, whereas all other genes on the arrays are uncorrelated. Even though the null hypothesis is true, all four existing competitive gene set tests give P -values that are not uniformly distributed but instead highly skewed towards small values ( Figure 1 A–D). None of the existing methods come at all close to controlling the type I error rate correctly, yielding type I error rates many times the nominal rate ( Table 1 , first four lines). This shows that even a small inter-gene correlation dramatically increases the type I error rates to dangerous levels.
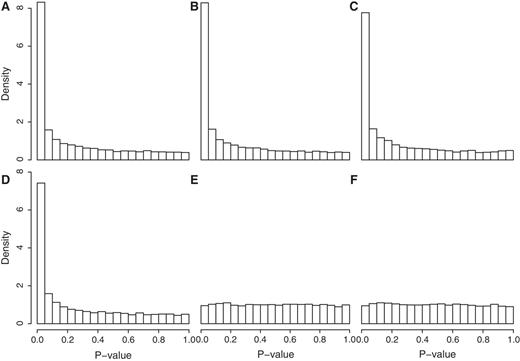
Histograms of P -values from different gene set tests in the absence of any true differential expression, but with a small inter-gene correlation in the test set. The simulation setup and order of test methods is as for Table 1 . Test methods are ( A ) geneSetTest (mod t), ( B ) geneSetTest (ranks of mod t), ( C ) sigPathway, ( D ) PAGE, ( E ) CAMERA (modt) and ( F ) CAMERA (ranks of modt). Existing methods A–D give results highly skewed towards small and falsely significant P -values, whereas CAMERA gives uniformly distributed values.
Type I error rates of gene set tests when genes in the set are correlated
| Test method | Nominal P -value | |||
|---|---|---|---|---|
| 0.01 | 0.02 | 0.05 | 0.10 | |
| geneSetTest (modt) | 0.2779 | 0.3275 | 0.4157 | 0.4950 |
| geneSetTest (ranks of modt) | 0.2826 | 0.3319 | 0.4144 | 0.4955 |
| sigPathway (t) | 0.2524 | 0.3025 | 0.3880 | 0.4704 |
| PAGE (logFC) | 0.2441 | 0.2900 | 0.3709 | 0.4503 |
| CAMERA (modt) | 0.0087 | 0.0187 | 0.0477 | 0.0990 |
| CAMERA (ranks of modt) | 0.0086 | 0.0173 | 0.0473 | 0.1003 |
CAMERA holds its size correctly whereas existing methods are highly liberal.
Entries are probabilities of rejecting the null hypothesis when conducting a gene set test to compare two groups of four arrays. Set size is 100 with inter-gene correlation 0.05. The remainder of 10 000 genes are uncorrelated. Results are based on 10 000 simulated data sets, so the standard error with which the error rate is estimated ranges from slightly < 0.001 (for rates near 0.01) to slightly < 0.005 (for rates near 0.5).
Variance inflation factors
Write  for the average of all pairwise correlations ρg , g ′ for genes in the test set. Also write
  for the background correlation, the average of all pairwise correlations ρg , g ′ for all genes in the genome, or all genes on the array. Normalization of microarray profiles will usually guarantee that
  is close to zero. However,
  is quite likely to be >0 when the test set represents co-regulated genes associated with some biological process.
 would be τ2 / m and the sample variance s2 of the zg for all genes on the array would be good estimate of τ2 . If instead
  is non-zero, then it is straightforward to show (See ‘Materials and Methods’ section) that the variance is not τ2 / m but rather is increased by the variance inflation factor
The PAGE parametric test uses logFCs as genewise statistics zg . These do not have equal variances under the null hypothesis, so the VIF is somewhat more complicated (See ‘Materials and Methods’ section). Nevertheless, the formula gives good guidance and holds approximately when the genewise variances  are roughly equal.
When zg is a rank, the VIF is slightly smaller than the formula above, because converting statistics to relative ranks tends to reduce positive correlations, or induces a small negative correlation if the original statistics were uncorrelated. This agrees with theoretical results that the WMW test is less sensitive to correlation than the t -test ( 34 ). An exact formula can be derived for the variance of the mean rank when the statistics zg are normally distributed and the inter-gene correlation is symmetric in the test set (See ‘Materials and Methods’ section). This exact formula is used in the rank version of the CAMERA procedure.
Estimating the inter-gene correlation
The CAMERA procedure is based on the idea of estimating the VIF from the data. The VIF and mean correlation can be estimated directly from residuals from the linear model for genes in the test set (See ‘Materials and Methods’ section). Briefly, the procedure is to extract a set of d = n − p independent residuals for each gene in the test test. The residuals are standardized to have equal variances, then summed over genes, and the mean square of these sums estimates the VIF. This procedure is equivalent to computing the average of all possible pairwise correlations between genes in the test set, but is numerically more efficient.
The CAMERA procedure treats the estimated VIF as an unbiased estimator of the true VIF, and as having the precision of a scaled chisquare distribution on d df (See ‘Materials and Methods’ section). Simulations show that this approximation is excellent when d and m are large and  is relatively small (data not shown). More generally, however, the VIF and mean correlation estimators are somewhat more precise than these distributional approximations imply ( Table 2 ). This ensures that the CAMERA test procedure will be conservative in small sample situations, and will be close to optimal when more replicates are available and the set size is moderate to large.
Correlation estimates are more precise than implied by the nominal chisquare approximation
| Correlation | Mean estimate | Empirical SD | Theoretical SD |
|---|---|---|---|
| 0 | −0.00007 | 0.00688 | 0.00698 |
| 0.02 | 0.0196 | 0.0117 | 0.0124 |
| 0.05 | 0.0490 | 0.0190 | 0.0206 |
| 0.1 | 0.0981 | 0.0300 | 0.0342 |
| 0.2 | 0.1961 | 0.0481 | 0.0614 |
| Correlation | Mean estimate | Empirical SD | Theoretical SD |
|---|---|---|---|
| 0 | −0.00007 | 0.00688 | 0.00698 |
| 0.02 | 0.0196 | 0.0117 | 0.0124 |
| 0.05 | 0.0490 | 0.0190 | 0.0206 |
| 0.1 | 0.0981 | 0.0300 | 0.0342 |
| 0.2 | 0.1961 | 0.0481 | 0.0614 |
Columns 2 and 3 give the mean and standard deviation (SD) of correlation estimates over 10 000 simulated data sets with set size of m = 40 and residual df d = 27. The empirical SDs are consistently less than the theoretical values. The simulation standard error with which the empirical SD is estimated is about 1.4%.
CAMERA
We develop two versions of CAMERA: a parametric version analogous to PAGE and a rank-based version analogous to geneSetTest. Both versions use genewise moderated t -statistics ( 24 ). The parametric version transforms the genewise t -statistics to z -statistics, zg , that are unit normal under the null hypothesis (See ‘Materials and Methods’ section), then conducts a global two-sample t -test to compare the zg values for genes in the test set to those for genes not in the set. The two-sample t -test is adjusted for correlation between genes in the test set, using the extended t -statistic described in the Materials and Methods section. In this procedure, the VIF estimate for the test set of genes is inserted to inflate the standard error of the two-sample t -statistic. The P -value is evaluated by comparing the t -statistic to the t -distribution on d df.
The rank-based version conducts a two-sample non-parametric test instead of the t -test. It replaces the two-sample t -test with an extended version of the WMW test that allows for a correlation between members of one of the two groups being compared (See ‘Materials and Methods’ section). The extended WMW test uses an exact formula for the variance of the rank-sum statistic under correlation. Again, the P -value is evaluated by comparing the rank-sum statistic to the t -distribution on d df.
CAMERA controls type I error correctly
Both the parametric (mod t ) and rank-based versions of CAMERA control the type I error rate correctly, or are very slightly conservative ( Table 1 , lines 5,6). They generate P -values that are uniformly distributed under the null hypothesis of no differential expression even when genes in the test set are positively correlated ( Figure 1 E and F). The results shown in Figure 1 and Table 1 are for set size m = 100, mean correlation  and residual df d = n − p = 6. The results remain essentially unchanged as these parameters are varied. The two CAMERA procedures continue to hold their size correctly regardless of the experimental setup in all simulations that we have conducted (data not shown).
The simulation setup of Figure 1 and Table 1 assumes that genes not in the test set are uncorrelated. In reality, the background genes may themselves belong to co-regulated pathways that may induce a more complex correlation structure. We, therefore, investigated a genome-wide correlation structure in which the whole genome can be partitioned into distinct molecular pathways, each consisting of 200 genes. Each pathway was assumed to have an inter-gene correlation of the same size as that for the test set. Within each pathway, half the genes were assumed to be up-regulated and half down-regulated by the pathway. Genes regulated in the same direction were assumed to be positively correlated whereas genes regulated in opposite directions were assumed to be negatively correlated. This clumpy genome-wide correlation did not affect the type I error rates for CAMERA. Both parametric and rank-based versions of CAMERA continued to return P -values that were uniformly distributed under the null hypothesis of no differential expression (data not shown).
CAMERA retains good power
CAMERA retains good power to detect small but consistent fold-changes in the test gene set. Table 3 gives power results for four different scenarios. The logFCs shown in the table were selected as the smallest changes for which power in the range of 50–80% was achieved. Further simulations show that power increases very rapidly for larger fold changes (data not shown).
CAMERA has excellent power to detect sets with small but consistent expression fold-changes
| Cor | Percent DE genes | log 2 FC | df = 6 | df = 27 | ||
|---|---|---|---|---|---|---|
| Modt | Ranks | Modt | Ranks | |||
| 0 | 100 | 0.05 | 0.587 | 0.588 | 0.70 | 0.68 |
| 0 | 25 | 0.20 | 0.562 | 0.515 | 0.69 | 0.58 |
| 0.05 | 100 | 0.10 | 0.452 | 0.452 | 0.53 | 0.54 |
| 0.05 | 25 | 0.25 | 0.645 | 0.533 | 0.77 | 0.66 |
Columns 4–7 give probabilities of rejecting the null hypothesis at P <0.05. Set size is m = 100 with either 100% or 25% of genes in the set differentially expressed between two groups of four arrays. Residual df is either 6 or 27 depending on whether or not the experiment includes a third group of 22 arrays. Inter-gene correlation is either 0 or 0.05. ‘Mod-t’ and ‘Ranks’ refer to parametric and rank-based CAMERA procedures, respectively. Results based on 1000 simulated data sets for each scenario.
Not unexpectedly, power is greatest when the genes are uncorrelated and all the genes in the test set are differentially expressed. However, power is still acceptable, even when the genes are correlated, only a subset of genes are actively differentially expressed, and the number of RNA samples is relatively small.
Interestingly, CAMERA loses relatively little power compared with existing unadjusted gene set tests when the genes are in fact independent. In the scenario of the first row of Table 3 , geneSetTest-modt and geneSetTest-ranks give powers 0.72 and 0.71, respectively, only slightly better than CAMERA with df=27. In the scenario of the second row, geneSetTest-modt and geneSetTest-ranks have powers 0.75 and 0.64, respectively, again only slightly better than CAMERA.
Even well-controlled data sets show inter-gene correlations
It should not be surprising that co-regulated genes will typically be positively correlated across diverse RNA samples. We wanted to explore how much inter-gene correlation remains in well-controlled experimental situations, for example, when RNA samples are extracted from sorted homogeneous cells from genetically identical model animals in controlled laboratory conditions. We examined three microarray data sets showing different degrees of biological variation between replicates. The first data set profiles 94 breast cancer tumors classified into six molecular subtypes ( 30 , 31 ). The second data set profiles four types of mammary epithelial progenitor cells from three human subjects ( 31 ). The third data set profiles three types of hemapoeitic stem cells from four strains of genetically identical mice. This dataset has 2–4 biological replicates for each strain and cell type for a total of 35 microarrays. After fitting linear models to remove treatment effects, the three data sets have, respectively, 94 − 6 = 88, 12 − 4 = 8 and 35 − 12 = 23 residual df available for estimating inter-gene correlations. The cancer data should show the most biological variability because replicates represent genetically different tumors, even within a molecular subtype. The mouse data should show the least, because the replicate samples are sorted homogeneous cells from genetically identical mice.
Inter-gene correlations and VIFs were computed for all gene sets containing five or more genes from the C2 collection of the Molecular Signatures Database Version 3.0 (MSigDB) ( 35 ). Although the average correlation between all genes on the arrays was close to zero (0.0026 for the tumor data, 0.0009 for the human cell data, 0.0029 for the mouse cell data), the correlations for the curated gene sets were overwhelming >0, ranging up to 0.71 ( Figure 2 ). For the tumor data, 96% of gene sets had positive correlation and the great majority of VIFs were significantly >1 ( Figure 2 , top right). For the human cell data, 86% of gene sets had positive correlation and more than half the VIFs were significantly >1 ( Figure 2 , bottom left). Even for the mouse data, nearly half of the VIFs were significantly >1, according to a conservative 5% P -value cutoff ( Figure 2 , bottom right). This demonstrates that positive inter-gene correlations and non-ignorably large VIFs are typical for sets of co-regulated genes, even for highly controlled experiments with genetically identical animals.
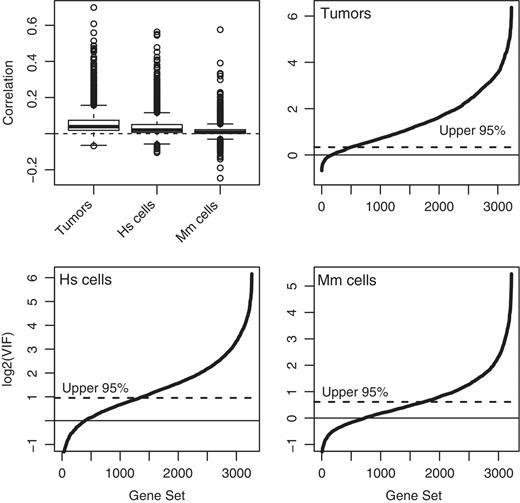
Inter-gene correlations for MSigDB gene sets in three microarray data sets. Top-left panel shows correlations. The other three panels show VIFs for breast cancers, human mammary epithelial cells and mouse hemapoeitic stem cells, respectively. The VIF plots show the cumulative distribution of VIFs over all gene sets. Solid and dotted horizontal lines show the mean and upper 95% quantile under the assumption of zero correlation.
Molecular signature of basal-like breast cancer
Basal-like breast cancer has the worst prognosis of any of six well-accepted subtypes of breast cancer ( 30 , 31 ). To demonstate the ability of CAMERA to recover biologically meaningful results, we contrasted basal-like cancers with the other five cancer subtypes. That is, we formed a contrast for the logFC in expression between basal-like tumors and the average of the other five tumor subtypes. Note that this is more powerful than simply pooling the other five tumor subtypes, in that all the subtypes are still modeled by the linear model and between subtype variability is still removed from the analysis. We ran CAMERA for this contrast for all the gene sets in the curated C2 collection of the MSigDB. CAMERA found 74 signatures, using the Benjamini–Hochberg algorithm to control the FDR at 0.05.
The CAMERA results recapitulate our knowledge of basal-like cancer in the strongest possible terms ( Table 4 ). The basal-like signature itself is the top set, and the negative basal-like signature is third. No fewer than 30 out of the top 35 gene sets are explicitly breast cancer derived, even though there are only 127 such sets in the entire MSigDB. All basal-related signatures are up-regulated whereas signatures associated with other subtypes are down-regulated. In particular, signatures associated with BRCA1 mutations are up-regulated, confirming that this is a defining characteristic of basal-like cancer. Signatures associated with ESR1 are down-regulated, confirming that ESR1 expression is associated with the luminal A subtype and good prognosis. Three other gene sets show an embryonic stem cell-like signature in basal-like cancer, a known characteristic of basal-like cancer ( 30 , 36 , 37 ). Other sets show associations with early onset and metastasis, concordant with the poor patient outcomes associated with basal-like cancer. Note that all the top 35 gene sets show non-ignorable positive correlations.
Molecular signatures distinguishing basal-like from other breast cancer subtypes
| Gene set | N Genes | Correlation | Direction | P -value | FDR |
|---|---|---|---|---|---|
| Smid_Breast_Cancer_Basal_Up | 580 | 0.039 | up | 1.2e-09 | 1.9e-08 |
| Doane_Breast_Cancer_Esr1_Up | 98 | 0.063 | down | 1.4e-09 | 1.9e-08 |
| Smid_Breast_Cancer_Basal_Dn | 569 | 0.035 | down | 1.5e-09 | 1.9e-08 |
| Vantveer_Breast_Cancer_Esr1_Up | 116 | 0.062 | down | 3.2e-09 | 3.2e-08 |
| Smid_Breast_Cancer_Relapse_In_Bone_Up | 85 | 0.044 | down | 1.9e-08 | 1.3e-07 |
| Benporath_Es_Core_Nine_Correlated | 95 | 0.057 | up | 1.9e-08 | 1.3e-07 |
| Smid_Breast_Cancer_Relapse_In_Brain_Up | 38 | 0.065 | up | 2.4e-08 | 1.3e-07 |
| Yang_Breast_Cancer_Esr1_Up | 24 | 0.122 | down | 3.0e-08 | 1.5e-07 |
| Smid_Breast_Cancer_Relapse_In_Brain_Dn | 68 | 0.059 | down | 3.7e-08 | 1.6e-07 |
| Doane_Breast_Cancer_Esr1_Dn | 46 | 0.099 | up | 8.9e-08 | 3.6e-07 |
| Yang_Breast_Cancer_Esr1_Bulk_Up | 15 | 0.109 | down | 3.0e-07 | 1.1e-06 |
| Smid_Breast_Cancer_Relapse_In_Bone_Dn | 281 | 0.044 | up | 3.8e-07 | 1.3e-06 |
| Vantveer_Breast_Cancer_Esr1_Dn | 195 | 0.069 | up | 4.1e-07 | 1.3e-06 |
| Vantveer_Breast_Cancer_Metastasis_Up | 37 | 0.051 | down | 8.0e-07 | 2.3e-06 |
| Benporath_Es_Core_Nine | 9 | 0.097 | up | 9.0e-07 | 2.4e-06 |
| Smid_Breast_Cancer_Luminal_B_Up | 144 | 0.049 | down | 3.2e-06 | 8.0e-06 |
| Doane_Breast_Cancer_Classes_Up | 58 | 0.095 | down | 4.7e-06 | 1.1e-05 |
| Smid_Breast_Cancer_Luminal_A_Dn | 16 | 0.174 | up | 4.9e-06 | 1.1e-05 |
| Yang_Breast_Cancer_Esr1_Bulk_Dn | 15 | 0.066 | up | 6.1e-06 | 1.3e-05 |
| Yang_Breast_Cancer_Esr1_Laser_Up | 24 | 0.053 | down | 8.1e-06 | 1.6e-05 |
| Yang_Breast_Cancer_Esr1_Dn | 19 | 0.175 | up | 1.1e-05 | 2.2e-05 |
| Benporath_Es_1 | 319 | 0.024 | up | 1.7e-05 | 3.2e-05 |
| Vecchi_Gastric_Cancer_Early_Up | 342 | 0.053 | up | 2.1e-05 | 3.6e-05 |
| Smid_Breast_Cancer_Relapse_In_Lung_Up | 21 | 0.051 | up | 3.2e-05 | 5.4e-05 |
| Sotiriou_Breast_Cancer_Grade_1_Vs_3_Dn | 40 | 0.064 | down | 3.4e-05 | 5.5e-05 |
| Landemaine_Lung_Metastasis | 15 | 0.139 | up | 4.5e-05 | 6.9e-05 |
| Lien_Breast_Carcinoma_Metaplastic_Vs_Ductal_Dn | 90 | 0.097 | down | 4.8e-05 | 7.1e-05 |
| Charafe_Breast_Cancer_Luminal_Vs_Basal_Up | 276 | 0.034 | down | 5.2e-05 | 7.4e-05 |
| Vantveer_Breast_Cancer_Metastasis_Dn | 92 | 0.119 | up | 7.1e-05 | 9.8e-05 |
| Pujana_Breast_Cancer_With_Brca1_Mutated_Up | 50 | 0.144 | up | 1.3e-04 | 1.7e-04 |
| Chiang_Liver_Cancer_Subclass_Proliferation_Up | 132 | 0.071 | up | 1.5e-04 | 1.9e-04 |
| Vantveer_Breast_Cancer_Brca1_Up | 27 | 0.039 | up | 2.1e-04 | 2.6e-04 |
| Naderi_Breast_Cancer_Prognosis_Up | 37 | 0.123 | up | 2.8e-04 | 3.2e-04 |
| Doane_Breast_Cancer_Classes_Dn | 31 | 0.072 | up | 2.8e-04 | 3.2e-04 |
| Smid_Breast_Cancer_Luminal_A_Up | 74 | 0.122 | down | 2.9e-04 | 3.2e-04 |
| Luminal progenitor up | 297 | 0.032 | up | 0.00012 | |
| Luminal progenitor down | 157 | 0.040 | down | 0.00049 | |
CAMERA results for the top 35 gene sets from the MSigDB when comparing basal-like cancers to the average of the other five subtypes. Output includes the size of each set, the estimated inter-gene correlation, two-sided P -value and FDR. Also given are results for mammary luminal progentor cell signatures.
For comparison, we used the popular GSEA software ( 20 ) to compare basal-like cancers to the other cancer subtypes, treating the non-basal tumors as a single group, yielding 124 up-regulated gene sets at 5% FDR and 13 significantly down-regulated sets at 5%. GSEA does not perform a two-sided test, so the FDR control is not as stringent as for CAMERA. The sets found by GSEA were less enriched for breast cancer sets and, in particular, did not include the basal-like signatures themselves.
Our previous interest in mammary luminal progenitor cells as the putative ‘cell of origin’ for basal-like cancer lead us to test the luminal progenitor signatures derived by ( 31 ). This confirmed the strong presence of the luminal progenitor signature in the basal-like tumors as opposed to the other tumor subtypes ( Table 4 ), confirming luminal progenitors as the likely cell of origin for basal cancers ( 31 , 38 ). CAMERA allows us to formally take genewise correlation into account in evaluating statistical significance, which we were not able to do in our earlier publication ( 31 ).
DISCUSSION
The majority of gene set tests that appear in the biological literature are of a competitive nature, in that they compare one category of genes to all other genes in the genome or on the microarray. Many or most methods of pathway analysis can be viewed as competitive gene set tests. This includes well-known contingency table tests, such as Fisher's exact test, that are often used to test for enrichment of a gene annotation category in a list of differentially expressed genes. These tests can be viewed as competitive gene set tests, according to the framework of this article, with the genewise statistic taking values one or zero depending on whether the gene is ranked in the top list ( 29 ). Another popular pathway analysis methodology, GSEA software ( 20 ), uses array permutation when the number of samples is large but gives the option of gene permutation when the number of samples is small. It, therefore, switches to a pure competitive test when the sample size is small. All these tests are likely to share the sensitivity to inter-gene correlation that was demonstrated in this article for existing competitive gene set tests.
Our results show positive inter-gene correlation to be prevalent for co-regulated genes, even for highly homogeneous cells and even for genetically identical animals under laboratory conditions. This agrees with Gatti et al . ( 9 ), who surveyed inter-gene correlations for common Kyoto Encyclopedia of Genes and Genomes pathways and gene ontology terms for over 200 data sets from the Gene Expression Omnibus. Gatti et al . used Pearson correlations coefficients, which measure total correlation between two genes, whereas we have computed residual correlations after removing treatment effects, and these are generally smaller. Our results show that inter-gene correlations remain prevalent even across replicates for homogeneous treatment groups. This suggests that inter-gene correlations cannot routinely be ignored in any commonly occuring molecular biology context.
A crucial aspect of the CAMERA procedure is to be able to estimate the inter-gene correlations efficiently, and to be able to characterize the precision of the resulting estimator, so that the uncertainty of estimation can be taken into account when evaluating the significance of the test. This article has shown that the variability of the estimated VIF can be bounded above by the variability of a chisquare distribution, meaning that the CAMERA test can be based on a t -distribution. This ensures that CAMERA controls the type I error rate correctly even for small sample sizes. CAMERA controlled the type I error rate correctly in all simulations we have conducted.
CAMERA continued to hold its size correctly even when all genes in the genome were assumed to belong to co-regulated pathways, each with their own inter-gene correlation structure. In our simulations, inter-gene correlations for background pathways were assumed to be of the same size as that for the test set. In most real situations, we expect that background genes will tend to be less highly correlated than those in the test set, because the test set is typically chosen specifically to contain co-regulated genes based on prior information. Hence, our simulations provide strong support for CAMERA to hold its size correctly in practical situations.
The necessity to estimate the inter-gene correlation from the data inevitably incurs some loss of statistical power, reflected in the use of a t -distribution instead of the standard normal distribution for evaluating the P -value. Yet, simulations show that CAMERA retains surprisingly good power compared to existing competitive tests when those methods are applicable, i.e. when the inter-gene correlation actually is zero. CAMERA actually has greater power than PAGE or sigPathway when the test set contains a large number of genes. One factor that contributes to this retention of statistical power is the use of genewise statistics that are normally distributed with equal variances under the null hypothesis of no differential expression. Previous parametric gene set tests have been based on genewise logFCs, which typically have different variances for different genes ( 13 , 16 ). A consequence is that the arithmetic average of these quantities over genes in the test set is less precise than would be a similar average of equal-variance quantities. Previous gene permutation gene set tests have been based on ordinary t -statistics that can be far from normally distributed when the sample sizes are small ( 2 ). Again, taking the arithmetic average of non-normal quantities is not generally a statistically efficient summary of their average size. Another factor contributing to power is the fact the CAMERA compares genes in the test set versus the complementary set of genes, rather than comparing the test set of genes to the background of all genes. This ensures that strong non-null effects in the test set do not contaminate the background set that is used to generate the null distribution.
CAMERA was applied to the breast cancer subtype data, and shown to be a very effective alternative to existing gene set enrichment analysis software ( 17 , 20 ) for interrogating a data set with a database of molecular signatures. CAMERA has greater statistical power than GSEA procedures based on array permutation when the number of RNA samples is not large.
Competitive tests have been used in the literature for their intuitive interpretation. To our knowledge, the null statistical hypotheses being tested have either not been stated or have been stated in operational terms. In effect, the hypothesis has been defined by the test procedure. This is especially true of competitive tests that evaluate P -values by array permutation ( 17 , 19 , 20 ). For these procedures, the null hypothesis being tested is difficult to characterize in parametric terms. To our knowledge, this article offers the first specification of null and alternative hypotheses for a gene set test in parametric terms. Crucially, the null and alternative hypothesis state relationships between logFCs for genes in or out of the test set, and do not involve other distributional aspects of the expression values such as correlations or variances. Previous statements of competitive null hypotheses in terms of random sampling of gene sets makes this distinction impossible.
Compared to the existing competitive gene set tests, CAMERA assigns less significance to gene sets that show positive inter-gene correlation. Positive correlation is an indication that genes are co-regulated and possibly functionally related, and it has been argued elsewhere that detection of co-regulated sets is of interest in itself ( 13 ). Our view is that inter-gene correlation reflects non-specific co-regulation, unrelated to the treatment conditions of the current experiment, whereas a gene set test should focus on co-regulation that is specific to the treatment comparison of interest.
To be completely general, CAMERA has been developed in a linear model context. This means that it is not limited to two-group comparisons, but can be used to test the behavior of gene sets across any contrast or interaction in a linear model context.
CAMERA is computationally extremely fast. The analysis presented in Table 4 , for example, requiring gene set tests for nearly 4000 gene sets, took only a couple of seconds on a laptop computer. By comparison, the equivalent GSEA analysis took 2 h on a high-performance large memory 16-core computer.
CONCLUSION
CAMERA is a competitive gene set test that controls type I error correctly regardless of inter-gene correlations, yet retains good statistical power. It has good performance for both focused testing of individual gene sets of special interest, and for gene set enrichment analysis using databases of gene annotation categories or transcriptional signatures. CAMERA is freely available as a function in the limma software package available from Bioconductor ( 26 ).
FUNDING
National Health and Medical Research Council [490037 and Research Fellowship to G.K.S.]; Australian Government [Australian Postgraduate Research Award to D.W.]. Funding for open access charge: National Health and Medical Research Council [490037].
Conflict of interest statement . None declared.
ACKNOWLEDGEMENTS
Thanks to our collaborators Benjamin Kile, Libby Kruse, Doug Hilton, Tracey Baldwin and Irina Pleines for allowing us to use data from the mouse microarray experiment conducted in their laboratory, to Yifang Hu for ortholog mapping and preparation of the MSigDB gene sets in R and for pre-processing of the mouse stem cell data, to Seon-Young Kim for providing Python code for PAGE, and to Belinda Phipson and Matthew Ritchie for helpful comments on the manuscript. DW is grateful to Jun S. Liu and Robert Plenge at Harvard University for supporting her as a postdoctoral researcher during the writing of this article.
REFERENCES
Author notes
Correspondence may also be addressed to Di Wu. Tel: +1 617 495 5496; Fax: +1 617 496 8057; Email: dwu@fas.harvard.edu

Comments