Article Text

Abstract
Objectives To examine the modification of temperature-mortality association by factors at the individual and community levels.
Design and methods This study investigated this issue using a national database comprising daily data of 66 Chinese communities for 2006–2011. A ‘threshold-natural cubic spline’ distributed lag non-linear model was utilised to estimate the mortality effects of daily mean temperature, and then examined the modification of the relationship by individual factors (age, sex, education level, place of death and cause of death) using a meta-analysis approach and community-level factors (annual temperature, population density, sex ratio, percentage of older population, health access, household income and latitude) using a meta-regression method.
Results We found significant effects of high and low temperatures on mortality in China. The pooled excess mortality risk was 1.04% (95% CI 0.90% to 1.18%) for a 1°C temperature decrease below the minimum mortality temperature (MMT), and 3.44% (95% CI 3.00% to 3.88%) for a 1°C temperature increase above MMT. At the individual level, age and place of death were found to be significant modifiers of cold effect, while age, sex, place of death, cause of death and education level were effect modifiers of heat effect. At the community level, communities with lower socioeconomic status and higher annual temperature were generally more vulnerable to the mortality effects of high and low temperatures.
Conclusions This study identifies susceptibility based on both individual-level and community-level effect modifiers; more attention should be given to these vulnerable individuals and communities to reduce adverse health effects of extreme temperatures.
- EPIDEMIOLOGY
- PUBLIC HEALTH
This is an Open Access article distributed in accordance with the Creative Commons Attribution Non Commercial (CC BY-NC 4.0) license, which permits others to distribute, remix, adapt, build upon this work non-commercially, and license their derivative works on different terms, provided the original work is properly cited and the use is non-commercial. See: http://creativecommons.org/licenses/by-nc/4.0/
Statistics from Altmetric.com
Strengths and limitations of this study
This is a national effort to assess the temperature–mortality relationship using data from a wide geographical coverage of China.
We examined the effect modifiers at the individual and community levels simultaneously.
We were not able to control for air pollution and influenza epidemics due to data unavailability.
We used ambient temperature as a surrogate for personal exposure, which might cause exposure misclassification.
The small number of daily mortality count in some communities might lead to imprecise risk estimation.
Introduction
Epidemiological studies have demonstrated a significant association between ambient temperature and mortality.1 ,2 This relationship was generally found to be V-shaped, U-shaped or J-shaped, with increased mortality at high and low temperatures and minimum mortality occurring at various temperature points.3–8 Exposure to high temperature may cause dehydration and increase blood viscosity, which can result in some adverse health outcomes, for some vulnerable subpopulations, it is likely to lead to excess cardiovascular and respiratory deaths;9 while during the cold period, the ability to regulate body temperatures is reduced, the cardiorespiratory system cannot adjust well to the outside temperature change, especially for those persons with pre-existing cardiovascular and respiratory diseases.10
The health impacts of temperature variation are likely to be heterogeneous across regions with different geographic conditions, climate and population characteristics.11 ,12 Identification of factors affecting the health susceptibility to temperature variation has been recognised as an important step to protect the vulnerable population.13 Some studies have also reported that some individual-level factors were associated with the health effects of temperature variation, such as age, sex and socioeconomic status.3 ,13–19
Being the largest developing country, China has experienced noticeable climate change over the past decades.20 The annual average temperature has risen by 0.5–0.8°C during the past century.21 Meanwhile, some extreme weather events, such as heat waves and cold spells, have also been witnessed in China, resulting in substantially excessive mortalities.10 ,22 ,23 However, few studies have examined how temperature–mortality relationships differ among different subpopulations and regions in China.24
One of our recent analyses examined the health effects of heat waves and associated effect modifiers based on a national database comprising data from 66 Chinese communities;25 the present study aimed to examine the effect modifiers of temperature–mortality relationship in China. We evaluated whether individual characteristics (age, sex, place of death, education level and cause of death) and community-level factors (average temperature, population density, sex ratio, percentage of older population, health access, average annual income and latitude) could modify the temperature–mortality relationship. This is one of the largest studies of temperature–mortality relationship to date in China.
Materials and methods
Data collection
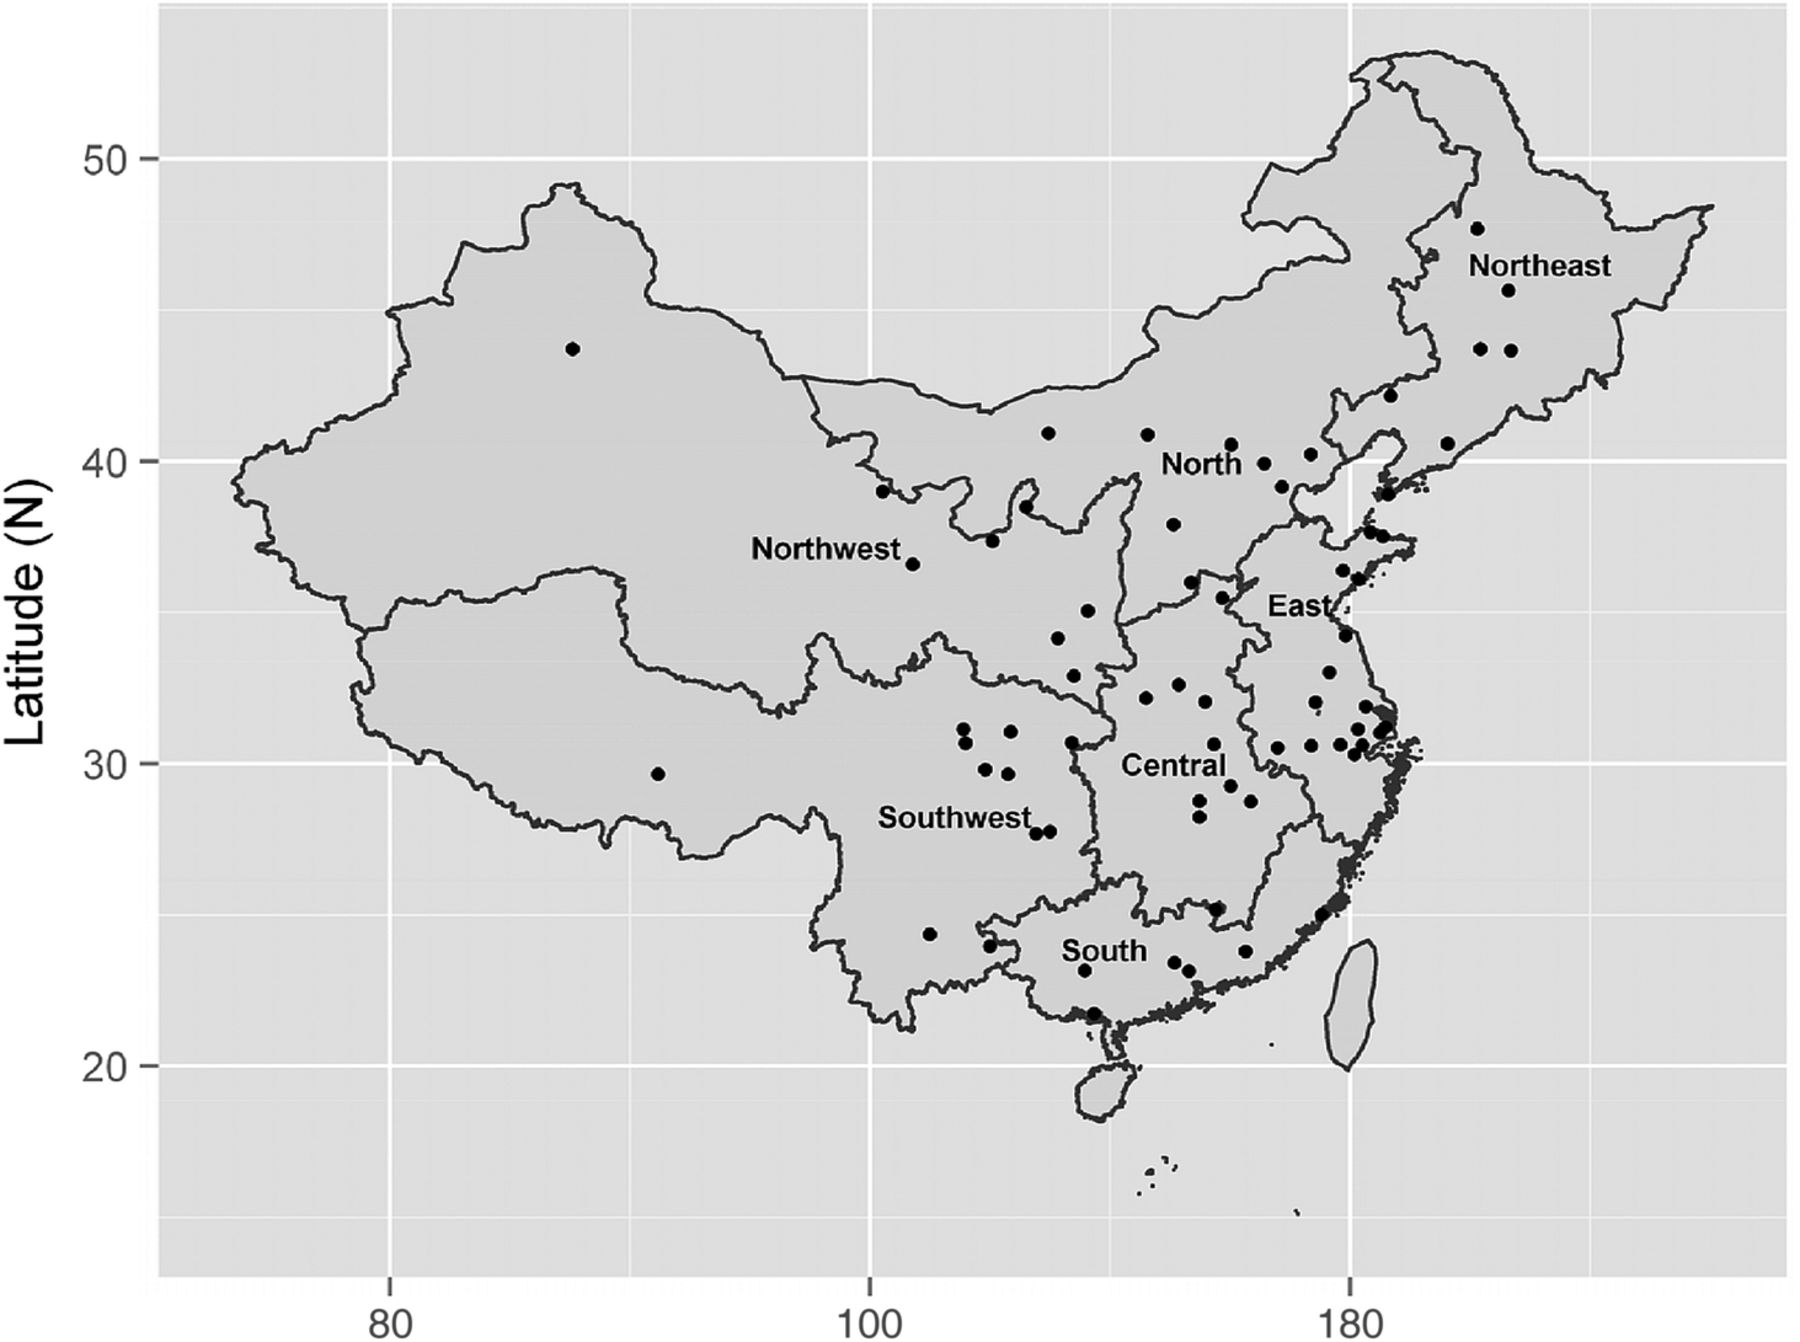
The Climate and Health Impact National Assessment Study (CHINAs) project is a national effort to assess short-term temperature–mortality relationship in 66 Chinese communities with more than 44 million residents. The 66 communities are distributed across seven geographical regions of China in terms of characteristics of geography, climate, natural ecology: northeast China (Heilongjiang, Liaoning, Jilin), north China (Beijing, Tianjin, Hebei, Shanxi, Neimenggu), northwest China (Shanxi, Gansu, Ningxia, Xinjiang, Qinghai), east China (Jiangsu, Zhejiang, Anhui, Shandong and Shanghai), central China (Henan, Hubei, Hunan and Jiangxi), southwest China (Sichuan, Xizang, Guizhou, Yunnan and Chongqing) and south China (Fujian, Guangdong and Guangxi). These communities provided a wide geographical coverage of China (figure 1); details of the data have been described elsewhere.24 ,25
The map of China showing the location of the 66 communities.
Community-specific daily mortality data covering the period from 1 January 2006 to 31 December 2011 were obtained from the Chinese Center for Disease Control and Prevention (China CDC). China CDC is the government agency in charge of health data collection in China. A death, whether it occurred in a hospital or at home, must be reported to the local CDC. In both situations, the hospital or community/village doctors completed a standard death certificate card regarding the death information including some individual-level information, such as age, sex, education level, cause of death and date of death, and place of death. In this study, we classified location of death into ‘in-hospital deaths’’ and ‘‘out-of-hospital deaths’; the former included deaths that occurred in hospitals, clinics or medical centres, as well as outpatients admitted to the emergency room, while ‘out-of-hospital deaths’ were defined as all other deaths, such as deaths in homes.
During the study period, the causes of death were coded according to the 10th revision of the International Classification of Diseases (ICD-10). The mortality data were classified into deaths due to all non-accidental causes (ICD-10: A00-R99), cardiovascular diseases (ICD-10: I00-I99) and respiratory diseases (ICD-10: J00-J99). Stratified data sets were also created with daily death counts by sex, age group and place of death (outside or in a hospital).
Community-specific daily meteorological data for the same period were retrieved from the China National Weather Data Sharing System (http://cdc.cma.gov.cn/home.do), which is publicly accessible. For each community, there was one basic-reference land surface automatic weather observation station which provided the weather information for each community. Meteorological data consisted of the daily mean, minimum, maximum and apparent temperatures (°C), relative humidity (%) and atmospheric pressure (hPa).
The proportion of missing mortality and meteorological data was very low. The highest proportion was found for maximum temperature with a missing rate of less than 0.2%.
Community-level variables (annual average temperature, population density, sex ratio, percentage of population older than 65 years old, hospital beds for per thousand population, annual household income and latitude) were obtained from the sixth national census values.26
Analysis of temperature–mortality relationship
Daily mean temperature was chosen as the temperature indicator for this analysis as it provided more easily interpreted results in a policy context.3 Within each community, the relationship between daily mean temperature and mortality was estimated using a distributed lag non-linear model (dlnm) with daily death counts as the dependent variable. The ‘dlnm’ model has been widely applied to investigate the health effects of air pollution and temperature. This approach has the ability to simultaneously investigate the non-linear and delayed effects of exposure on daily mortality, termed as exposure-lag-response associations.27 ,28 This model used a ‘cross-basis’ function, which allowed a two-dimensional relationship of the non-linear effect of daily temperature variation at each lag and the nonlinear effects across lag days to be estimated.27 The method accounted for the overdispersed Poisson data using the assumption that the total variance was proportional to the total number, with the overdispersion constant estimated through quasi-likelihood. In the ‘cross-basis’ function, we used the spline function for temperature and the polynomial function for the lag structure. The model can be specified as: where E(Yt) denotes the expected daily mortality count on day t, cb means the ‘cross-basis’ function, s() indicates a smooth function based on natural splines for non-linear variables. In this study, the number of knots was set as 3, and it was placed at equally spaced percentiles of the temperature distribution for each community. t is the day of study (an integer value for day 1 to n of the time series, to control for long-term and seasonal trends), β is the regression coefficient, DOW is a categorical variable for day of week, PH is the binary variable indicating public holidays, and COVs are the potential confounding factors, including smooth function of relative humidity (df=3), precipitation (df=3), duration of sunshine (df=3) and atmospheric pressure (df=3).29 ,30 We examined the residuals (the difference between fitted and observed values) of the model to check whether there were discernible patterns and autocorrelation by means of a residual plot and a partial autocorrelation function (PACF) plot. The PACF of residuals of the model was less than 0.1, indicating no serial autocorrelations in the residuals and sufficient confounder control.19
We plotted the relative risks (RRs) against temperature and lag days to show the overall relationship between mean temperature and mortality. Our initial results showed that the temperature–mortality relationships were approximately V-shaped or U-shaped, with a minimum mortality temperature (MMT), a pattern that rendered it necessary to divide the series into two segments with reference to the MMT. Thus, we estimated the linear relationships below and above the city-specific MMT in accordance with previous studies,31 ,32 assuming that the mortality effects of temperatures below and above the MMT were linear. The community-specific MMT was determined in accordance with previous studies and used as the reference temperature for the analysis.31 ,32 In brief, in the model, multiple temperatures were tested on the basis of the minimum residual deviance of the model. For example, by visual inspection of the dose–response curve, we may identify that the potential MMT might be within 25–28°C, and we then examined the potential MMT from 25 to 28°C (by 0.1°C) to identify the model with a minimum residual deviance.24
Previous studies have suggested that the low temperature effect persisted for longer days, even weeks, while high temperature effects were shorter term (usually 0–2 days).22 ,33 In the light of these findings, we modelled the effects of heat and cold weathers with two different regression models: daily temperature at lag 0–2 days was used to model the heat effect and lag 0–21 days was used to represent the cold effect.
We examined the community-specific temperature–mortality relationship and summarised measures of the heat and cold effects. Specifically, for each community we calculated the change in mortality risk for a 1°C decrease in temperature below the MMT (cold effect) and for a 1°C temperature increase above the MMT (heat effect).
Heterogeneity of the effect estimates was observed among the communities, so a random-effect meta-analysis model to combine the heat and cold effect estimates of the 66 communities to generate overall effects at the regional and national levels.34
Effect modifiers of temperature–mortality relationship
For the potential effect modifiers at the individual level, the effect estimates were obtained for each stratum of the potential modifying factor, including cause of death (non-accidental, cardiovascular and respiratory mortalities), age (0–64, 65–74, 75–84, 85–), sex (males and females), education level (low: less than 6 years of schooling, medium: 6–9 years, and high: 9 years and above), and place of death (within or outside of a hospital). A random-effect meta-analysis approach was used to generate overall effects for each category.
For the community-level effect modification, random-effect meta-regression models were used by including potential effect modifiers in the random-effect meta-analysis to examine their contribution to the observed variation in the effect estimates among the communities.35
Sensitivity analysis
Sensitivity analyses were performed by changing the df of long-term and seasonal trends (7–10 df/year). All statistical tests were two sided, and values of p<0.05 were considered statistically significant.
Results of the analysis were expressed as excess relative risk (ERR) of mortality increase for a 1°C increase above the MMT (heat effect) or a 1°C decrease below the MMT (cold effect). ERR was calculated using the formula: ERR=(RR−1)×100%, where RR was obtained through the time series models. All statistical analyses were performed using the R software (V.2.15.1) (R Development Core Team, Austria). The dlnms were fitted using the R package ‘dlnm’, and meta-analysis was conducted using the ‘metafor’ package.
Results
Online supplementary material table S1 summarised the daily mortality and weather statistics by community. During the study period, a total of 1 260 913 deaths were reported in the 66 communities, including 552 866 and 198 777 deaths from cardiovascular and respiratory systems. The communities differed in population size and daily mortality count. The community-specific mean number of daily deaths ranged from 2 to 23. Most of the deceased were above 65 years of age (71.5%), and male (58.2%). A substantial fraction of deaths (72.8%) occurred out of a hospital.
Online supplementary material table S1 and figure S1 illustrated the distribution of daily temperature in the 66 communities. The 66 communities in this study had a wide range of climates, with annual mean temperatures ranging from 4.6°C in Yi'an County in Northeast China (community ID, 230223) to 22.9°C in Hepu County in the Southeast Region (community ID, 450521). Among the seven regions, the Southern region had the highest mean temperature, and the Northeastern region had the lowest temperature.
Online supplementary material figures S2 and S3 showed the diagnostic graphs of the model, including the plot of the residuals and the plot of PACF for a few communities. There were no discernible seasonal patterns and no autocorrelation in the residuals, indicating acceptable goodness of fit of the models.
Online supplementary material figure S4 showed the temperature-mortality association and the identified MMT in a few communities. Online supplementary material figure S5–S8 showed the association for males, females, cardiovascular and respiratory mortalities, respectively. The results showed that the curves varied across communities, but generally was U-shaped or V-shaped. We found significant mortality effects from low and high temperatures, with a most comfortable temperature value; in general, the MMT was found to be higher in the southern regions. The overall effect estimates for all the 66 communities and each of the seven regions were illustrated in table 1. The strongest cold effect was observed for the North and Central regions, and the Northeast Region had the lowest mortality effect from cold weather. For the mortality effect of high temperature, the highest effect was observed in South China, and the lowest effect in the Northwest Region.
Percentage increase in daily mortality for a 1°C decrease below the threshold and a 1°C increase above the threshold by geographic region, China, 2006–2011
Individual-level effect modifiers
In the stratified analyses by various individual-level factors, the cold and heat effects were found to vary by age, sex and place of death (table 2).
Comparison of heat-related and cold-related mortality risks by individual-specific effect modifiers
Cold-related mortality risk had a generally increasing pattern with age, whereas the highest risk was observed among those aged 85 years and above (the ERR being 4.11%, 95% CI 3.53% to 4.69%). Location of death was a strong modifier of the cold effect with an ERR of 2.34% (95% CI 1.76% to 2.93%) for dying in a hospital, and 3.93% (95% CI 3.40% to 4.46%) for the deaths occurring out of a hospital. Other personal characteristics had a similar association.
The individual factors that increased susceptibility to heat effect included old age, female, dying out of a hospital, dying of respiratory diseases and education level. For example, sex was a strong effect modifier, the ERR being 1.36% (95% CI 1.06% to 1.66%) for females and 0.89% (95% CI 0.70% to 1.08%) for males. The hot weather had stronger health effects for those with respiratory conditions (ERR: 1.37%, 95% CI 0.99% to 1.75%) compared with those dying of cardiovascular illness (ERR: 1.20%, 95% CI 0.99% to 1.41%) and non-accidental diseases (ERR: 1.04%, 95% CI 0.90% to 1.18%). People with lower education level had higher heat effect (ERR: 1.38%, 95% CI 1.16% to 1.60%) than those with moderate education level (ERR: 0.58%, 95% CI 0.34% to 0.83%) and higher education level (ERR: 0.84%, 95% CI 0.47% to 1.21%).
Community-level effect modifiers
We evaluated whether the observed temperature–mortality relationship could be explained by some community-level factors, such as average temperature, population density, sex ratio, percentage of people with low education level, population aged 75 years and above, living in an urban setting, hospital beds per thousand population, average income and latitude (table 3). The analysis found that the cold effects were slightly higher in warmer communities. A 7.2°C increase in annual average temperature was associated with a 0.59% (95% CI −0.04% to 1.21%) increase in cold-related RR, while communities with higher education level, more residents living in an urban area, better healthcare facility and higher latitude were less susceptible to the cold impacts. For the heat effects, we found that annual temperature, living in an urban setting, income and latitude were significant effect modifiers, for example, a 7.2°C increase in annual average temperature was associated with a 0.31% (95% CI 0.11% to 0.51%) increase in heat-related mortality risk.
Increase in heat-related and cold-related mortality per IQR increase in community-specific effect modifiers
Sensitivity analysis
We found generally similar effect estimates using different degrees of freedom (7–10 df/year) for temporal adjustment compared with those of the main analyses, suggesting a robust result of this analysis.
Discussion
In this large multicommunity study, we provided unique evidence on individual-specific and community-specific indicators that were related to the vulnerability to temperature-related mortality risk in China. Our analysis found that most of the effect modifiers were generally similar for individual-level and community-level factors, which enhanced the possibility that these factors were valid potential markers of vulnerability, which contributed to the advantage of this study. The underlying mechanisms for the observed excess mortality during days with high temperature may be related to the stress placed on the respiratory and circulatory systems to increase heat loss through skin surface blood circulation.36 This, coupled with an increase in blood viscosity and cholesterol levels, may lead to elevated mortality risk. The possible mechanisms for the cold-related mortality risk have also been suggested. One underlying reason might be the higher prevalence of respiratory infection during the winter season, particularly influenza epidemics and an increase in plasma cholesterol and plasma fibrinogen with low temperatures, coupled with a higher blood pressure in cold weather, could lead to thrombosis through haemoconcentration and trigger an acute mortality event.37 Moreover, the extremely cold weather might have also contributed to the excess mortality by reducing access to a hospital.
Socioeconomic inequalities at community and individual levels have been linked with a higher burden of environmental risks, including those from weather variation.3 ,13 ,38 ,39 For example, higher mortality effects of high temperature were observed for those at an older age, dying out of a hospital and with existing cardiopulmonary conditions.13 Regional differences in the association between ambient temperature and mortality may be partly due to the dissimilar population structure in terms of age, sex, education attainment and other socioeconomic status.3
Our study found that low socioeconomic conditions were generally associated with higher mortality risk from high and low temperatures, which was generally consistent with several previous studies. For example, a study about the heat-related mortality risk in Chicago in 1995 found that people with existing medical conditions and low socioeconomic status were the vulnerable population.40 In Texas, heat-related excess mortality was higher among the elderly and persons involved in heavy labour.41 An analysis examining the effect indicators of the temperature-mortality association in 107 US cities found that age, cause of death, place of death, median household income, unemployment rate, usage of air conditioning and education level were potential markers of vulnerability to temperature extremes.3 Similar findings have also been observed in other studies.14 ,17 ,42 ,43
Our study suggested that the temperature-mortality association increased with age, with those aged over 85 years being the most susceptible population, which was consistent with several previous studies.44 ,45 The older persons were generally at poor health status, had pre-existing medical conditions and diminished ability to detect changes in their body temperature, and thus had reduced thermoregulatory capacity, which might be the major reason for their increased susceptibility to temperature extremes.14 ,22 ,46
Education level was a good indicator of socioeconomic status that conveyed susceptibility.42 For cold and heat effects, our study found a generally higher mortality risk for areas with a lower education level, which was consistent with a study of 7 US cities14 ,47 and Curriero et al's45 study of 11 US cities. Persons with more educational attainment were more likely to have greater wealth and better health access, dietary intake, better domestic heating system in winter and air conditioning usage in summer.48 Higher mortality rates among the low-educated population have also been observed in several other studies, such as a cohort study in the USA.49
Location of death was found to be an important effect modifier of the mortality effect of cold and hot weathers in this study, which has also been reported in a few studies;13 ,14 however, these two studies13 ,14 found that the effect modification was mainly for heat effects, while our study found that it was more obvious for cold effects; the underlying reason for this discrepancy remained unknown. The finding of higher vulnerability for those dying out of hospitals was biologically plausible. It was possible that people dying out of a hospital had higher intensity of exposure to an ambient environment, and it was also partly due to the better healthcare received by the residents living in a hospital, as it was likely that those dying out of a hospital usually had lower socioeconomic status.14
The factors leading to the community vulnerability to mortality effects of temperature were found to be community-specific temperature, urbanisation, education level, healthcare facility, household income and latitude and the effect modification was particularly noteworthy for cold effects. Previous studies also found that group-level factors could explain some heterogeneity in community-specific effects.3 ,45 ,50 ,51 This phenomenon may be due to the general health and nutrition status, healthcare access, and overall knowledge, attitude and adaptation capacity to the health effects of temperature. A study examining the temperature-related mortality in Chicago also showed that areas with lower socioeconomic status had higher mortality risk.50 Anderson et al's3 study including 107 US communities also examined the community-specific effect modifiers, and found that communities with a higher unemployment rate, more population with lower education attainment, and more population living in an urban environment were more vulnerable to the temperature extremes.
This study found that southern communities with lower latitude and higher annual average temperature had temperature-related mortality risk, which has also been reported elsewhere.4 ,16 ,45 The higher cold effect in southern areas may suggest the evidence for acclimatisation. Though the winter temperature was higher in south China than in northern areas, the lack of a centralised heating system in south China made people in southern areas suffer more from the cold weather, causing excess mortality risk,22 while higher heat effect in south region observed in this study might be due to more exposure opportunities and higher intensity of heat exposure by the population in south China. However, some other studies have reported that low latitude areas had lower risk from heat effects, which was inconsistent with findings from our study.44 ,52
Though previous studies suggested that hot weather is an important health hazard in the context of global climate change,53 our study suggested that cold weather was also an important health hazard, which should not be neglected. This finding also indicated that the health impact of cold weather, particularly its long delayed effects, should be considered in the health effect analysis and projecting health impact of future climate change.
A few limitations should be noted when interpreting the findings from this study. One limitation was that we were not able to control for air pollution and influenza epidemics in the analysis due to data unavailability. Our previous work suggested that the health effects of temperature extremes remained similar after controlling for various air pollutants and influenza epidemics.22 However, O'Neill et al54 examined the mortality impact of temperature controlling for ozone and particulate matter and found that while the effect of high temperature on mortality reduced by about 30%, the associations persisted. Goldberg's study in Canada also suggested that air pollution could not distort the temperature–mortality relationship to a great extent.55 Another limitation was the use of ambient temperature as a surrogate for personal exposure. The misclassification derived from this assumption will be largely determined by the extent to which ambient and microenvironmental temperatures are correlated,16 which will most likely be affected by adaptive mechanisms such as the use of air conditioning. Furthermore, for both individual-level or community-level analyses of effect modifiers, we cannot control the potential confounding effect of one modifier by another. Owing to the high correlation between some variables, we cannot simply put them in the same model, making the observed effect modification difficult to attribute to one specific factor. It should also be noted that small number of daily mortality in some communities might lead to imprecise risk estimation, and for this reason we only examined the effects on mortality from respiratory and cardiovascular systems; further studies on more specific diseases are warranted in future studies. Another limitation was that this study used weather data from only one weather observation station for each community; however, a community in this study covered a relatively small geographic area, and the weather data from one station could generally represent the local weather pattern.
The findings from this study have some public health implications for policymakers and the scientific community by providing evidence of the temperature–mortality relationship in China and related effect modifiers at the individual and community levels. Climate adaptation planning should be taken as one local issue, which means adaptation strategy development should take into consideration local weather conditions, population characteristics and socioeconomic status. The identified susceptible subpopulations from this study provided evidence for the targeted temperature-mortality prevention and adaptation measures. The community-level effect modifiers indicate the necessity of a multicity study and indicate that community-specific prevention strategies are warranted.
Conclusions
In summary, this study identifies the susceptibility of mortality effects of temperatures based on both individual-level and community-level effect modifiers; more attention should be given to these vulnerable individuals and vulnerable communities to reduce adverse health effects of extreme temperatures.
Acknowledgments
The authors thank the Chinese National Weather Data Sharing System for providing the meteorological data. This study was funded by Adapting to Climate Change in China project (ACCC/20100528) and National Major Research Programme of China (2012CB955500).
References
Supplementary materials
Supplementary Data
This web only file has been produced by the BMJ Publishing Group from an electronic file supplied by the author(s) and has not been edited for content.
- Data supplement 1 - Online supplement
Footnotes
ZH and HL contributed equally.
Contributors ZH, YL, LW and MZ provided the mortality data. HL, WM, TL and JX conceived of the study, participated in the study design and statistical analysis, and drafted the manuscript. TL, JX, WZ, XL and YZ collected the meteorological data and result interpretation. TL, ST, KLE and HL participated in the study design and coordination. All authors read and approved the final manuscript.
Funding National Major Research Programme of China.
Competing interests None declared.
Provenance and peer review Not commissioned; externally peer reviewed.
Data sharing statement No additional data are available.