Article Text

Abstract
Objectives A previously identified signal transduction and activator of transcription-3 (STAT3) target-enriched gene signature in circulating CD4+ T cells of patients with early rheumatoid arthritis (RA) was prominent in autoantibody-negative individuals. Here, interleukin (IL)-6-mediated STAT signalling was investigated in circulating lymphocytes of an independent early arthritis patient cohort, seeking further insight into RA pathogenesis and biomarkers of potential clinical utility.
Methods Constitutive and IL-6-induced expression of phosphorylated STAT1 (pSTAT1) and pSTAT3 was determined in T and B cells using Phosflow cytometric analysis in patients with RA and controls. Contemporaneous levels of serum cytokines were measured by immunoassay. Induced gene expression was measured in cultured CD4+T cells by quantitative real-time PCR.
Results Among circulating lymphocytes of 187 patients with early arthritis, constitutive pSTAT3 correlated with serum IL-6 levels maximally in CD4+ T cells. Increased constitutive pSTAT3, but not pSTAT1, was observed in circulating CD4+ T cells of patients with early anticitrullinated peptide autoantibody (ACPA)-negative RA compared with disease controls, and these levels decreased alongside markers of disease activity with IL-6R-targeted treatment. Among patients presenting with seronegative undifferentiated arthritis (UA) the ratio of constitutive pSTAT3:pSTAT1 in CD4+ T cells contributed substantially to an algorithm for predicting progression to classifiable RA during a median of 20 months follow-up (area under receiver operator characteristic curve=0.84; p<0.001).
Conclusions Our findings support a particular role for IL-6-driven CD4+ T cell activation via STAT3 during the induction of RA, particularly as a feature of ACPA-negative disease. CD4+ T cell pSTAT measurements show promise as biomarkers of UA–RA progression and now require independent validation.
- Early Rheumatoid Arthritis
- T Cells
- Cytokines
This is an Open Access article distributed in accordance with the Creative Commons Attribution Non Commercial (CC BY-NC 4.0) license, which permits others to distribute, remix, adapt, build upon this work non-commercially, and license their derivative works on different terms, provided the original work is properly cited and the use is non-commercial. See: http://creativecommons.org/licenses/by-nc/4.0/
Statistics from Altmetric.com
Introduction
Anti-citrullinated peptide autoantibody (ACPA)-negative undifferentiated arthritis (UA) remains a unique diagnostic challenge in the early arthritis (EA) clinic.1We previously identified a gene expression ‘signature’ in circulating CD4+ T cells of EA clinic attendees, which was most prominent in patients with ACPA-seronegative rheumatoid arthritis (RA), and predicted UA–RA progression.2 In that work, signal transducer and activator of transcription (STAT)3-regulated genes were over-represented in the signature's make-up, their expression correlating with paired serum interleukin (IL)-6 concentrations independently of C reactive protein (CRP) and tumour necrosis factor (TNF).2 Similar patterns were not seen for other serum mediators that signal via STAT3. The importance of IL-6-mediated STAT3 signalling among CD4+ T cells during the induction of experimental arthritis, and in established human RA, has been independently highlighted,3 ,4 and the therapeutic efficacy of IL-6 receptor (IL-6R) blockade in RA management emphasises the pathway's importance in disease pathogenesis.5–8 However, the cellular mechanisms by which IL-6 drives the induction and perpetuation of human disease remain to be resolved.
IL-6 shares with other gp130-related cytokines its reliance for signal transduction on the ubiquitously expressed, membrane-bound β-receptor subunit gp130, but must also bind to its α-subunit IL-6R (CD126) in either membrane or soluble form (classical or trans signalling, respectively).9–11 Although downstream signalling occurs primarily via STAT3, STAT1 is also used,12 and cross-regulation between these pathways appears to be an important determinant of cellular responses to gp130-related cytokines.13 ,14
The aims of the current study were to validate our initial observations in an independent EA patient cohort and to develop a more tractable assay to facilitate replication by other research groups. In so doing, we sought a better understanding of IL-6 signalling in lymphocytes as an early pathological event in the natural history of RA, compared with other arthritides.
Methods
Subjects
Biological material was obtained from consecutive, consenting patients referred from primary care with recent onset arthritis and recruited from the Newcastle Early Arthritis Clinic (NEAC), UK, during 2012–2013. Patients had not been exposed to disease-modifying antirheumatic drugs or corticosteroids. In this cohort, a working clinical diagnosis was assigned by a rheumatologist at the first consultation as previously described,2 with RA being diagnosed with reference to 2010 European League Against Rheumatism/American College of Rheumatology classification criteria.15 Diagnoses were validated or, in the case of UA, updated at follow-up visits over a median period of 20 months (range 13–25). Patients with established RA treated with the anti-IL-6R monoclonal antibody tocilizumab16 were recruited from the Freeman Hospital Musculoskeletal Unit. Additional patients with RA (similarly fulfilling 2010 classification criteria) and healthy volunteers were recruited from the Princess Alexandra Hospital and community, respectively, in Brisbane, Australia. They received a combination of methotrexate, sulfasalazine and hydroxychloroquine, unless contraindicated, immediately after diagnosis of RA. Treatment was intensified according to a response-driven step-up algorithm.17
All subjects gave written informed consent before inclusion into the study, which was approved by local ethics committees at the respective institutions. Patients with pre-existing rhematological diagnoses, and all those aged <16 years, were excluded. The disease activity score in 28 joints (DAS28; erythrocyte sedimentation rate, ESR) was used throughout the study to determine RA disease activity.
Multiparameter flow cytometric analysis of whole blood
The following antibodies were used for Phosflow and IL-6R phenotype analysis in samples processed at Newcastle: anti-CD3-Pacific Blue (UCHT1), anti-CD19-FITC (4G7), anti-CD19-APC (HIB19), anti-Stat3 (pY705)-Alexa Fluor 647 (4/P-STAT3) and anti-Stat1 (pY701)-Alexa Fluor 647 (4a; all BD Biosciences, Oxford, UK); anti-CD4-APC-eFluor 780 (SK3; eBioscience, Hatfield, UK); IL-6R-Fluorescein (17506; R&D Systems Europe, Abingdon, UK). Phosflow was performed on whole blood, which was either left unstimulated or stimulated with 100 ng/mL IL-6 (PeproTech EC, London, UK) for 15 min at 37°C. BD Phosflow Lyse/Fix and BD Phosflow Perm Buffer III (both BD Biosciences) were used as per the manufacturers’ instructions. IL-6R expression was assessed in whole blood using BD FACS Lysing Solution (BD Biosciences) as per the manufacturers’ instructions. Data were collected on a BD FACSCanto II (BD Biosciences) and analysed using FlowJo (Treestar, Ashland, Oregon, USA). The protocol followed for samples processed in Brisbane was similar, using anti-CD3-Pacific blue (UCHT1), and anti-Stat3 (pY705)-PE (4/P-STAT3; BD Biosciences), with a Gallios flow cytometer and Kaluza software for data acquisition/analysis (both Beckman Coulter). Flow-Set Pro Fluorospheres (Beckman Coulter) were used to normalise median fluorescence intensities (MFI) for pSTAT3 measurements between data sets.
Serum cytokine measurement
Between 09:30 and 12:30, baseline serum was drawn and frozen at −80°C until use. Serum IL-6, TNF and soluble IL-6R (sIL-6R) were measured using a highly sensitive, validated electrochemiluminescence immunosorbance detection system (Meso Scale Discovery, Gaithersberg, Massachusetts, USA) as described.2 Soluble gp130 (sgp130) and IL-23 measurements were made using a Quantikine ELISA kit (R&D systems, Minneapolis, Michigan, USA). Manufacturer guidance was adhered to, but a cocktail of non-human sera (Heteroblock, Bozeman, Missouri, USA) was added to each assay at an optimised final concentration of 32 µg/mL to correct for potential assay interference by heterophilic antibodies present in sera.18
Gene expression assays in cultured CD4+ T cells
High-purity CD4+ T cell isolation from whole blood of healthy volunteers, cell culture in the presence of IL-6/sIL-6R, RNA extraction and quantitative real-time PCR for measurement of STAT3 target gene expression were performed as previously described.2 Raw gene expression data were normalised relative to the housekeeping gene 18S as 2−ΔCt values to determine fold induction.
Calculation of Leiden Prediction Score
Using a range of readily available clinical and serological parameters, the Leiden Prediction Score1 ,19 ,20 was developed to stratify individuals’ risk of UA–RA progression with reference to the 1987 RA classification criteria,21 but its value for the same purpose when applying the 2010 criteria is diminished.22 In the absence of a validated alternative prediction tool for this setting, we devised a modification to the algorithm described by its authors,19 ,23 incorporating pSTAT1 and pSTAT3 parameters as outlined in the text and using methodology outlined in the online supplementary text: ‘Prediction Rule’.
Statistical analyses
The majority of analyses were carried out using SPSS (Chicago, Illinois, USA), with statistical significance defined by α=5%. Non-parametric analyses of variance (Kruskal–Wallis test; Dunn's posthoc pairwise analyses) and Mann–Whitney U tests were used for multiple-group and two-group independent comparisons, respectively, and Wilcoxon matched pairs test for paired comparisons. Spearman's rank correlations and analyses of covariance were performed for bivariate comparisons; for multiple or logistic regression dependent variables were selected as indicated in the text, and skewed data were log10 transformed. Additional receiver operator characteristic (ROC) analyses, including paired area under curve (AUC) comparisons by DeLong's non-parametric method24 and bootstrap cross-validation (1000 bootstrap samples), were conducted using the pROC statistical package25 (http://cran.r-project.org). Diagnostic evaluations were calculated from contingency tables using http://statpages.org.
Results
Patient groups
A total of 187 NEAC attendees were recruited into the study. Among this cohort, definitive diagnoses could be assigned by rheumatologists at first consultation for 152 individuals (81%). This number increased to 184 (98%) during follow-up. Diagnoses were further categorised as RA (ACPA positive or negative), non-RA inflammatory arthritis (non-RA IA) or non-IA/arthralgia (NIA), as previously described,2 and clinical characteristics of this cohort are described in table 1. (The same data stratified by baseline diagnosis is provided in the online supplementary table S1). The non-RA IA group comprised psoriatic arthritis (36%), reactive or self-limiting IA (22%), other spondyloarthropathy including ankylosing spondylitis (11%), crystal arthropathy (18%) or other IA (13%). Twenty-seven (40%) of the NIA group were diagnosed with probable osteoarthritis. A total of 22 additional patients with RA and 13 healthy controls were recruited from Brisbane, contributing only to experiments presented in figure 1E, F; their clinical details are provided in the online supplementary table S2. Details of tocilizumab-treated patients are given in the online supplementary table S3.
Newcastle early arthritis clinic patients stratified by diagnostic outcome at the end of follow-up
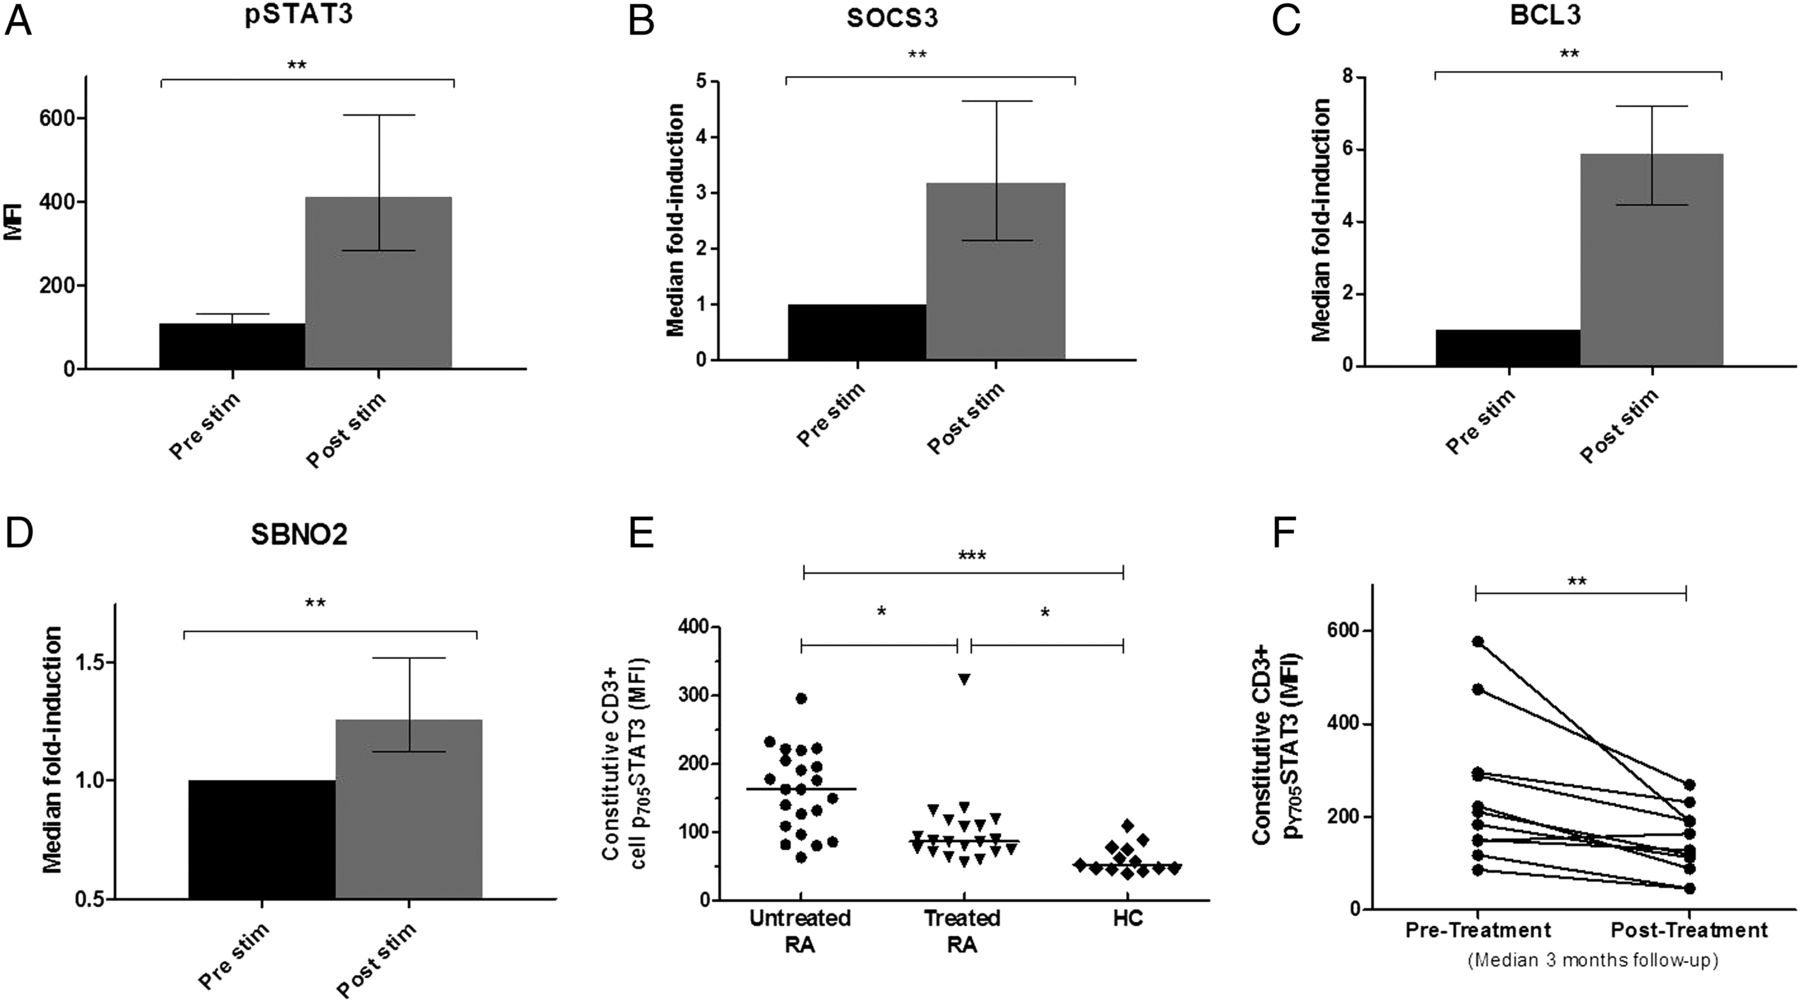
(A–D) CD4+ T cells isolated from whole blood of eight healthy volunteers were cultured with 50 ng/mL final concentration recombinant interleukin (IL)-6 and an equimolar concentration of soluble IL-6 receptor (sIL-6R). Intracellular phosphorylated signal transduction and activator of transcription-3 (pSTAT3) expression was measured by flow cytometric analysis from one aliquot (A), with induced expression of early rheumatoid arthritis (RA) ‘signature’ STAT3 target genes SOCS3, BCL3 and SBNO2 being measured in another aliquot for each individual (B–D); preliminary work established that peak expression was reached at 15 and 60 min, depicted here for pSTAT and transcripts, respectively. (E) pSTAT3 was measured in circulating CD3+T cells of patients with early RA, established RA counterparts and healthy donors as described; additional clinical information supplied in the online supplementary table S1. (F) Constitutive CD3+ T cell pSTAT3 was measured serially in 11 newly diagnosed patients with RA before (pre) and 2–4 months (median 12 weeks) post initiation of disease-modifying antirheumatic drug therapy. Wilcoxon signed-rank test (A–D and F) or non-parametric analysis of variance with Dunn's posthoc pairwise analyses (E): *p<0.05, **p <0.01 and ***p<0.001. Error bars indicate interquartile ranges. MFI, median fluorescence intensity.
IL-6-mediated STAT3 phosphorylation induces RA ‘signature genes’ in CD4+ T cells in vitro and is a potential biomarker
The measurement of gene expression in peripheral blood subsets used in our previous investigation2 is technically challenging, and we therefore sought a more tractable tool for clinical application. Whole blood flow cytometric analysis presented a promising solution. We first confirmed that IL-6-mediated activation of primary CD4+ T cells could, via STAT3 phosphorylation, induce the same genes that featured prominently in our transcriptional signature. Maximal STAT3 phosphorylation was observed 15 min after IL-6 exposure (figure 1A), and upregulation of its exemplar targets SOCS3, BCL3 and SBNO2 reached significance at 1 h (figure 1B–D). We next confirmed that detectable differences in pSTAT3 were present between distinct patient populations. We measured constitutive pSTAT3 in circulating T cells (CD3+) of patients with early untreated RA, patients with treated RA and healthy volunteers (see online supplementary table S2A). Significantly higher CD3+ pSTAT3 expression was seen in patients with early RA compared with both healthy controls and patients with treated RA (figure 1E). Consistent with this, CD3+ T cell pSTAT3 measurements in prospectively followed patients with early RA treated with disease-modifying antirheumatic drugs (DMARDs) diminished over time (figure 1F; see online supplementary table S2B for additional clinical detail).
Strong and independent association between circulating CD4+ T cell pSTAT3 and paired serum IL-6 in EA
Constitutive pSTAT1, pSTAT3 and IL-6R expression in lymphocyte subsets was measured alongside paired serum IL-6, IL-6R and sgp130 concentrations in 187 NEAC patients (all diagnoses; table 1). Constitutive pSTAT3 expression was highest in CD4+ T cells (figure 2A). A similar pattern was seen for pSTAT1 (figure 2B). Constitutive pSTAT3 correlated with paired serum IL-6 levels most strongly in CD4+ T cells (r=0.60) and, to a lesser extent, CD8+ T cells (r=0.36), but not B cells (figure 2C; also online supplementary figure S1A–C). The relationship was similar irrespective of diagnostic category (figure 2D; online supplementary figure S1D–E). Importantly, multiple regression analysis (using CD4+ T cell pSTAT3 as the independent variable) indicated that the association with IL-6 remained after correction for age, CRP and circulating of TNF, which does not signal primarily via STAT3 (β=0.44; p<0.001; online supplementary table S4), providing strong evidence for a causal relationship between IL-6 and STAT3 activation. No such correlations were seen in respect of pSTAT1 in any lymphocyte subset (figure 2E; online supplementary figure S1F–H). As was the case with IL-10 in our previous study,2 IL-23 (also known to signal via STAT3) was undetectable in all but a small number of NEAC patients’ sera (<10%; detection threshold 39 pg/mL; not shown) and did not correlate with pSTAT3. These results indicate that, in EA, CD4+ T lymphocytes are most sensitive to circulating IL-6. No correlation was seen between pSTAT1/3 in any subset and either circulating IL-6R or sgp130 (see online supplementary figure S2), excluding an overt influence of these mediators of trans IL-6 signalling on STAT activation in circulating lymphocytes. Moreover, strikingly higher levels of membrane IL-6R expression were expressed by circulating CD4+ T cells than by CD8+ T cells or CD19+ B cells (figure 2F).

(A) Constitutive phosphorylated signal transduction and activator of transcription-3 (pSTAT3) expression is maximal in CD4+ T cells compared with CD8+ and CD19+ cells in the peripheral blood of patients with early arthritis, and (B) a similar pattern is seen for pSTAT1. (C) Relationship between constitutive pSTAT3 and paired serum interleukin (IL)-6 is strongest in the CD4+ T cell lymphocyte population; significant differences are seen between best-fit line slopes (analyses of covariance (ANCOVA) p<0.001). (D) Comparable strength of association between constitutive pSTAT3 in CD4+ T cells and paired circulating IL-6 levels in patients with early rheumatoid arthritis (RA; black) and a disease control group comprising non-RA inflammatory arthritis (grey); no difference in the slope of the best-fit lines is seen between the comparator groups (ANCOVA). (E) Serum IL-6 does not correlate with basal pSTAT1 in any lymphocyte subset. (F) Surface IL-6R expression is maximal in the CD4+ T lymphocyte subset. ***p<0.001, non-parametric analysis of variance with Dunn's posthoc pairwise analyses; Spearman correlation coefficients (rho) and associated p values are depicted. Correlation plots are also presented individually in the online supplementary figure S1, for further clarity. MFI, median fluorescence intensity.
Reduction in constitutive CD4+ pSTAT3 after anti-IL-6R blockade mirrors RA disease activity
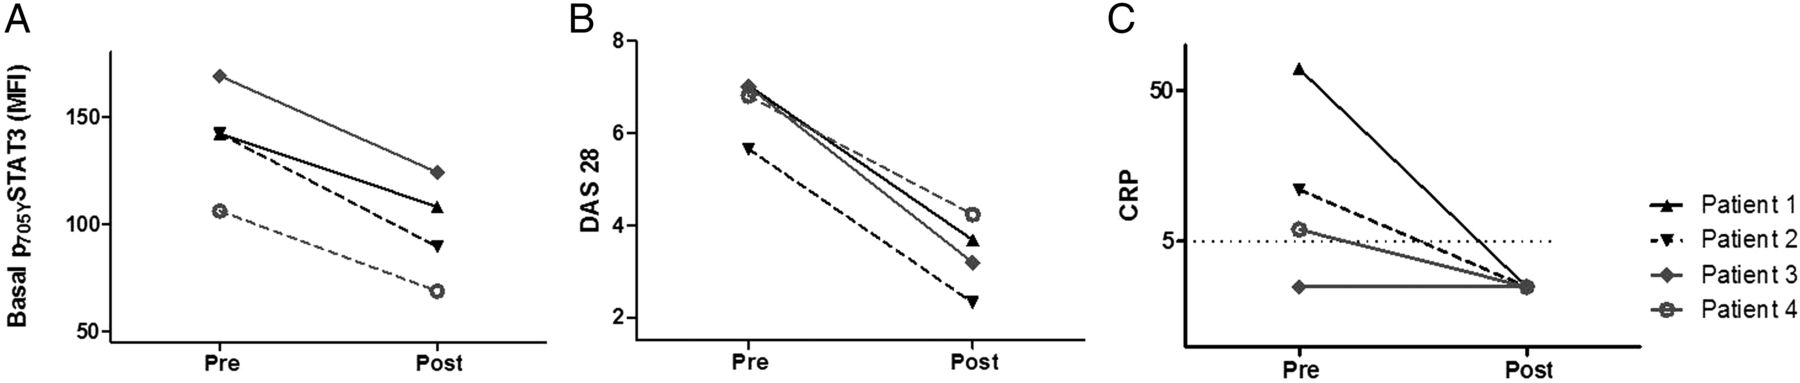
To confirm the in vivo role of IL-6 signalling in STAT3 activation in RA, CD4+ T cell pSTAT3 was monitored in four patients with established, active RA in whom tocilizumab therapy was initiated. Clinical characteristics of the patients are provided in the online supplementary table S3. All four patients responded clinically to tocilizumab, and we observed that peripheral blood CD4+ T cell pSTAT3 declined with treatment (figure 3A) in a manner that more closely resembled serial disease activity scores (DAS28; figure 3B) than did a cruder measure of response, such as CRP (figure 3C). These data provide direct in vivo evidence that IL-6-mediated CD4+ T cell STAT3 activation is associated with disease activity. Furthermore, pSTAT3 measurement may have value as a biomarker for monitoring disease activity in RA.

Longitudinal analysis of total CD4+ phosphorylated signal transduction and activator of transcription-3 (pSTAT3) (A), disease activity score in 28 joints (DAS28) (B) and C reactive protein (CRP; C) in four patients with established rheumatoid arthritis. Measurements were made immediately before, and 1 month after, initial treatments with tocilizumab. Additional clinical information is available in the online supplementary table S4. MFI, median fluorescence intensity.
Constitutive and induced CD4+ T cell pSTAT3 discriminates early ACPA-negative RA, reflecting serum IL-6 levels
Constitutive and IL-6-induced pSTAT1 and pSTAT3 expression was measured in lymphocytes of 184 EA clinic attendees, stratified by diagnostic category. Neither pSTAT1 nor pSTAT3 differed between diagnostic groups among CD8+ T cells or CD19+ B cells (see online supplementary figure S3A–D). In CD4+ T cells, basal pSTAT3 was significantly higher in patients with ACPA-negative RA than in non-RA IA and NIA controls (figure 4A,B; the same pattern was observed when patients with RA were stratified according to whether they were seronegative for both rheumatoid factor and ACPA; online supplementary figure S3E). The expected reciprocal pattern was seen with respect to induced pSTAT3 in CD4+ T cells on ex vivo IL-6 stimulation of whole blood (figure 4A, C; online supplementary figure S3F), reflecting reduced STAT3 phosphorylation capacity in vitro where constitutive pSTAT3 is increased. The relationship between serum IL-6 concentration and diagnostic category mirrored that of CD4+ T cell pSTAT3, being highest among patients with ACPA-negative RA (median 8.6 pg/mL; figure 4D). No differences were seen in constitutive CD4+ T cell pSTAT1 between diagnostic outcome groups (see online supplementary figure S4). Given the relatively high surface expression of IL-6R by CD4+ T cells (figure 2F), we investigated whether differential expression of this receptor according to diagnostic category could explain the observed differences in CD4+ T cell pSTAT3 levels, but found this not to be the case (figure 4E). Neither sIL-6R nor sgp130 differed between patients grouped according to diagnostic category (see online supplementary figure S5). These results indicate that IL-6 drives STAT3 phosphorylation prominently (and in preference to STAT1 phosphorylation) in circulating CD4+ T lymphocytes of patients with early ACPA-negative RA.

(A) Representative flow cytometry histograms depicting basal and interleukin (IL)-6-induced phosphorylated signal transduction and activator of transcription-3 (pSTAT3) in CD4+ T cells from exemplar patient with non-rheumatoid arthritis (non-RA) inflammatory arthritis disease control (shaded plots) and anticitrullinated peptide autoantibody (ACPA)-negative RA (non-shaded plots); constitutive pSTAT3 is greater in the patient with ACPA-negative RA (dotted lines depict fluorescence-minus-one control). (B) Constitutive CD4+ T cell pSTAT3 expression differs according to diagnosis, being significantly higher in ACPA-negative RA than in inflammatory/non-inflammatory control groups. (C) The opposite relationship with diagnostic outcome is seen in respect of ex vivo IL-6-induced CD4+ T cell pSTAT3 fold induction. (D) Serum IL-6 concentrations differed according to diagnosis, mirroring CD4+ T cell STAT3 pattern (compare B). (E) Differences in constitutive pSTAT3 between disease phenotypes were not explained by differential CD4+ T cell membrane expression of IL-6R. *p<0.05, **p<0.01 and ***p<0.001 (Dunn's posthoc pairwise analysis following non-parametric analysis of variance); MFI, median fluorescence intensity; OA, osteoarthritis.
Constitutive CD4+ T cell pSTAT measurement has predictive value in diagnosing UA
We explored the potential of CD4+ T cell pSTAT3 as a diagnostic biomarker for EA patients with unclassifiable disease. Among 32 of 35 such patients with UA for whom outcome diagnoses became available, 12 had evolved to classifiable RA over a median of 20-months follow-up, compared with the remaining 20 assigned alternative (non-RA) diagnoses. Despite equivalent baseline clinical parameters (including inflammatory markers; online supplementary table S5) and circulating IL-6 levels (figure 5A), pSTAT3 in total CD4+ T cells differed significantly between the two outcome groups at baseline, being highest in UA–RA patients (p=0.02; figure 5B). Although no difference was seen between the two groups in respect of CD4+ T cell pSTAT1 or surface IL-6R expression (see online supplementary figure S6), the ratio of constitutive CD4+ T cell pSTAT3 to pSTAT1 ([MFIpSTAT3]/[MFIpSTAT1]) was again found to be highest in the UA–RA group (p=0.008; figure 5C).

Phosphorylated signal transduction and activator of transcription (pSTAT) measurements in circulating CD4+ T cells have potential utility in predicting evolution of rheumatoid arthritis (RA) in 32 Newcastle Early Arthritis Clinic patients presenting with undifferentiated arthritis (UA). (A) Baseline serum interleukin (IL)-6 does not differ according to diagnostic outcome. (B) Constitutive CD4+ T cell pSTAT3 at presentation is highest in patients with UA who progress to RA. (C) This is also true regarding the ratio of constitutive CD4+ T cell pSTAT3:pSTAT1, suggesting a potentially robust biomarker. *p<0.05 and **p<0.01 (Mann–Whitney U test). (D) Receiver operator characteristic curves depicting compared discriminatory utilities with respect to diagnostic outcome. The Leiden prediction rule has modest discriminatory utility (area under the curve (AUC)=0.67; 95% CI 0.47 to 0.87, light grey line) and that of constitutive pSTAT3:pSTAT1 ratio in circulating CD4+ T cells is, by comparison, promising (AUC=0.78; 95% CI 0.60 to 0.96, dark grey line). However, only a composite prediction metric that excludes anticitrullinated peptide autoantibody and instead incorporates a measure of constitutive CD4+ T cell pSTAT3:pSTAT1 demonstrates a predictive utility that is significantly enhanced over that of the Leiden rule alone (AUC=0.84; 95% CI 0.68 to 1.0, black line); †difference between AUCs (Leiden prediction rule vs composite score)=0.17; 95% CI 0.01 to 0.33; p=0.04; see text. IA, inflammatory arthritis; MFI, median fluorescence intensity.
The use of revised RA classification criteria15 has diminished the prevalence of ACPA in early UA,26 and this was reflected in our small cohort, all but one of whom were ACPA negative (see online supplementary table S5). The Leiden prediction rule, developed for use prior to this revision in classification, assigns a heavy predictive weighting to ACPA-positive individuals with respect to progression from UA to RA.1 ,19 Therefore, we reasoned that substitution of the prediction rule's ACPA component with an indicator of constitutive CD4+ STAT3/1 signalling might enhance its utility for predicting ACPA-seronegative UA–RA progression under 2010 classification criteria. Indeed, the predictive power of the published Leiden rule for an RA outcome in our small patient group was modest (AUC 0.67, 95% CI 0.47 to 0.87; figure 5D), consistent with previous reports.1 ,2 ,22 By comparison, the predictive power of constitutive CD4+ T cell pSTAT3 (MFI; AUC=0.77, 95% CI 0.61 to 0.95) or, as depicted in figure 5D, the pSTAT3:pSTAT1 ratio (AUC 0.78; 95% CI 0.61 to 0.95) appeared greater, although differences were not significant (p=0.4).
Maximal predictive utility for RA was achieved when the Leiden rule was modified to incorporate pSTAT3:pSTAT1 in place of ACPA status (see online supplementary text: ‘Prediction Rule’; AUC 0.84; 95% CI 0.68 to 1.0). This was significantly enhanced over that of the Leiden score alone (p=0.04; figure 5D). To address a potential over-fitting issue, a bootstrap cross-validation approach was also performed and gave similar AUC values, indicating that they are unlikely to be grossly inflated (see online supplementary table S6). An optimum cut-off value for the composite metric of 9.5 for determining likely progression of UA to RA had positive and negative predictive values of 0.82 (95% CI 0.54 to 0.96) and 0.86 (0.71 to 0.93), respectively (see also online supplementary table S7).
Discussion
We report the first detailed, prospective analysis of IL-6 pathway activation parameters in a well-characterised EA patient cohort. Of particular clinical relevance, we find that measurement of the constitutive pSTAT3:pSTAT1 ratio in CD4+ T cells by flow cytometry holds promise as a predictive biomarker for RA progression among newly presenting ACPA-negative UA patients. Moreover, its incorporation into a prediction algorithm for evolving RA, itself published prior to revised classification criteria, yields a potentially valuable tool for predicting UA–RA progression in the post-2010 era. Our finding warrants replication in diverse EA cohorts as a priority. Importantly, our new data confirm the importance of IL-6-mediated CD4+ T cell STAT3 signalling in early RA2 and highlight flow cytometry as a method by which IL-6/STAT3 pathway activation might be used as a diagnostic biomarker. With this in mind, the use of the pSTAT3:pSTAT1 ratio was preferred over pSTAT3 MFI alone, representing a metric that can be more easily standardised for use between laboratories and technologies.
The activation of STAT3 by IL-6 in circulating CD4+ T cells raises intriguing questions as to the pathway's role in RA induction. Our observation that cytokine-mediated T cell activation accompanies the earliest clinical phase of RA recalls previous evidence that such mechanisms might underpin disease pathogenesis independently of antigen recognition.27 ,28 An IA mouse model characterised by mutated IL-6 signalling machinery has recently added support to this concept.29–31 We noted that peripheral blood CD4+ T cells from patients with untreated RA and non-RA IA were similarly ‘sensitive’ to circulating IL-6 (figure 2D) excluding differential cytokine responsiveness as the driver of distinctive cellular STAT3 phosphorylation between disease phenotypes. However, CD4+ pSTAT3 (together with the pSTAT3:pSTAT1 ratio) appears to be a more accurate predictor of ACPA-negative RA than IL-6 before the disease is fully clinically manifest (figure 5), potentially incriminating factors other than IL-6 that affect the STAT3 pathway (such as membrane-bound gp130 expression, which we did not measure in our study). Understanding such processes within the clinical context of early RA will inform efforts to refine targeted RA treatments of the future.32 ,33
Despite being carefully planned and conducted over a 2-year period, our study was limited by relatively few patients with UA. Considering this alongside the heterogeneity of EA, this affected statistical power. Moreover, it is conceivable that the utility of our putative biomarker is critically dependent on one or other of the technical parameter(s) that were carefully controlled at our unit—including (but not limited to) the UA definition, non-exposure to DMARDs among participants, the time of blood draw or the decision to stain fresh blood (eg, rather than frozen peripheral blood mononuclear cells). Replication of our findings will therefore be the final arbiter of both their validity and their clinical utility.
Key questions raised by our work include the cellular source of excess IL-6 in incipient RA, its influence on downstream effector CD4+ T cell function and the relative contribution of classical versus trans IL-6 signalling to the process. Of further interest will be the extent to which these steps are regulated by genetic determinants.34 ,35 Finally, the apparent dominance of IL-6-driven CD4+ T cell STAT3 activation in ACPA-negative, over ACPA-positive, RA deserves attention (figure 4B,D). In fact, our data overall suggest that IL-6-driven STAT3 activation is relevant to the pathogenesis of both serotypes, but its relative importance in ACPA-negative disease may be greater. Other mechanisms (including the production of autoantibodies themselves) may play a balancing role in ACPA-positive RA induction, but further study will be needed to explore this hypothesis.
Acknowledgments
We thank Julie Diboll, Jamie Watson, Phil Mawson and Helen Pahau for valuable technical support, Katharine Irvine and Raymond Steptoe for helpful discussions and all participating patients and volunteers.
References
Supplementary materials
Supplementary Data
This web only file has been produced by the BMJ Publishing Group from an electronic file supplied by the author(s) and has not been edited for content.
Files in this Data Supplement:
- Data supplement 1 - Online supplement
Footnotes
Handling editor Tore K Kvien
AEA, AGP and MAKS contributed equally.
JDI and RT contributed equally.
Contributors AEA contributed intellectually to the design and analysis of the study and carried out the majority of the laboratory work, as well as contributing to analyses and manuscript drafting. MAKS also contributed substantially to the design and execution of laboratory work and its analysis. AGP conceived and designed the study, carried out some of the laboratory work, contributed to its analysis and wrote the manuscript. JPD made an important contribution to laboratory work and analysis. CR and BH carried out and recorded detailed assessments of patients, contributing to the analysis of clinical data, with valuable assistance from PMB. K-ALC provided important intellectual and analytical input to the revised manuscript. RT and JDI contributed to the study's conception, design, interpretation and manuscript drafting. All authors critically appraised and approved the final manuscript.
Funding Pfizer, the Academy of Medical Sciences, NIHR Newcastle Biomedical Research Centre at Newcastle upon Tyne Hospitals Foundation Trust & Newcastle University; NHMRC grants 1027657 and 569938; ARC Future Fellowship. The views expressed are those of the authors and not necessarily those of Pfizer, the NHS, the NIHR or the Department of Health.
Competing interests None.
Ethics approval County Durham and Darlington Regional Ethics Committee, UK.
Provenance and peer review Not commissioned; externally peer reviewed.