Article Text

Abstract
Background Within a surveillance of the prevalence and causes of vision impairment in high-income regions and Central/Eastern Europe, we update figures through 2015 and forecast expected values in 2020.
Methods Based on a systematic review of medical literature, prevalence of blindness, moderate and severe vision impairment (MSVI), mild vision impairment and presbyopia was estimated for 1990, 2010, 2015, and 2020.
Results Age-standardised prevalence of blindness and MSVI for all ages decreased from 1990 to 2015 from 0.26% (0.10–0.46) to 0.15% (0.06–0.26) and from 1.74% (0.76–2.94) to 1.27% (0.55–2.17), respectively. In 2015, the number of individuals affected by blindness, MSVI and mild vision impairment ranged from 70 000, 630 000 and 610 000, respectively, in Australasia to 980 000, 7.46 million and 7.25 million, respectively, in North America and 1.16 million, 9.61 million and 9.47 million, respectively, in Western Europe. In 2015, cataract was the most common cause for blindness, followed by age-related macular degeneration (AMD), glaucoma, uncorrected refractive error, diabetic retinopathy and cornea-related disorders, with declining burden from cataract and AMD over time. Uncorrected refractive error was the leading cause of MSVI.
Conclusions While continuing to advance control of cataract and AMD as the leading causes of blindness remains a high priority, overcoming barriers to uptake of refractive error services would address approximately half of the MSVI burden. New data on burden of presbyopia identify this entity as an important public health problem in this population. Additional research on better treatments, better implementation with existing tools and ongoing surveillance of the problem is needed.
- public health
- epidemiology
- glaucoma
This is an Open Access article distributed in accordance with the Creative Commons Attribution Non Commercial (CC BY-NC 4.0) license, which permits others to distribute, remix, adapt, build upon this work non-commercially, and license their derivative works on different terms, provided the original work is properly cited and the use is non-commercial. See: http://creativecommons.org/licenses/by-nc/4.0/
Statistics from Altmetric.com
Introduction
Vision impairment is of great importance for quality of life and for the socioeconomics and public health of societies and countries. In the recent Global Burden of Disease Study (GBD) 2015, sense organ deficits including vision impairment and hearing impairment ranked second after low back and neck pain and before depressive disorders among the all-age causes for years lived with disability (YLDs) worldwide.1 Within the population aged 65+ years, sense organ deficits were the most common causes for YLDs. In a previous meta-analysis including data and results of most of the up-to-then available population-based studies in ophthalmology worldwide, 32.4 million people were blind (defined as presenting visual acuity <3/60 in the better eye) in 2010, and 191 million people had a moderate and severe vision impairment (MSVI; defined as presenting visual acuity <6/18 but ≥3/60 in the better eye).2 The corresponding figures for the high-income countries and for Eastern and Central Europe were 2.736 million individuals blind (473 000 in high-income North America; 956 000 in Western Europe) and 22.176 million individuals visually impaired (3.102 million in North America; 7.490 million in Western Europe).3 The most common causes for blindness and vision impairment worldwide were by far cataract and undercorrection of refractive error, whereas glaucoma, macular degeneration, diabetic retinopathy and other causes altogether included less than 25% of all causes.3 The burden of presbyopia has not been assessed.
Since surveillance of changes in public health parameters is needed to better analyse the effect of recent public health measures and to better allocate financial means for further improvement in public health, the Vision Loss Expert Group of the GBD Study has undertaken to monitor the status of visual impairment and blindness in the heterogeneous parts of the world every 5 years. We performed the current analysis to update the information on blindness and vision impairment and its causes in the high-income countries and Eastern and Central Europe. Important changes in the countries in Eastern and Central Europe have included rapid economic development and large-scale migration of middle-aged individuals to Western European countries. Key novel features of this 2015 regional burden of visual impairment update include use of an improved statistical model, incorporation of more data sources, estimation of the burden of presbyopia and projections of numbers of people affected by distance vision impairment burden to 2020, an important milestone year from a health-policy perspective.
Methods
The methodology used for the preparation of prevalence estimates for vision impairment and blindness, which includes a Preferred Reporting Items for Systematic Reviews and Meta-Analyses (PRISMA) checklist, PRISMA flow sheet and a detailed account of the statistical models used, has been published in full elsewhere.4–6 A brief overview is given as follows. The study was approved by the ethics committee II of the Medical Faculty Mannheim of the University of Heidelberg, Germany. Using data in the Global Vision Database, we estimated 1990–2015 trends in vision impairment prevalence and their uncertainties, by age and gender, for 188 countries in the 21 GBD regions.7 The super region of ‘high-income countries, Eastern and Central Europe’ addressed in this report consists of the regions of Asia-Pacific, Australasia, North America high income, Western Europe, Central Europe and Eastern Europe. The distribution of countries within these regions is presented in table 1.
Countries included in the category of ‘high-income countries, Eastern and Central Europe’
Using definitions and an analytical framework similar to that applied by Stevens and colleagues, we used statistical models to estimate the prevalence of two of the core categories of vision impairment: blindness, defined as presenting visual acuity worse than 3/60 in the better eye, and MSVI, defined as presenting visual acuity in the better eye of worse than 6/18 to 3/60 inclusive. For the process of identification, access and extraction of data, we included data on distance vision impairment from population-based studies as identified through a systematic review.2–4 Mild vision impairment was defined as presenting visual acuity in the better eye of worse than 6/12 to 6/18 inclusive. This review included investigations which were published between 1980 and July 2014. Additionally, we assessed unpublished data which were identified by members of the Vision Loss Expert Group of the GBD Study.8 In total, nine new studies were added to the Global Vision Database for the high-income countries, Eastern and Central Europe super region, giving a total of 46 studies contributing data from 22 countries.
For the statistical analysis, we fitted two hierarchical Bayesian logistic regressions to estimate vision impairment prevalence over time–by age group, gender and country–one model for the prevalence of blindness and one model for the prevalence of MSVI.9 We modelled hierarchical linear trends over time, allowing for region-specific trends in prevalence of vision impairment in the seven world regions. Prevalence estimates were reported as posterior means along with 80% posterior uncertainty intervals (UIs).5 We calculated trends, with UIs, of age-standardised vision impairment by calculating the difference between the 1990 and 2015 age-standardised prevalence.
In order to estimate the prevalence of presenting near vision impairment due to uncorrected presbyopia (functional presbyopia), we included studies where presbyopia was defined as presenting near vision worse than N6 or N8 at 40 cm regardless of distance refractive status. For broad estimates of vision impairment including both distance and near presenting impairment, we only included data from those people whose best-corrected visual acuity was 6/12 (20/40) or better, so as to avoid double counting those with both distance and near vision impairment associated with non-refractive causes. We developed a similar model to the main model used for blindness and MSVI. For the high-income countries, Eastern and Central Europe super region, there were three subnational sources of presbyopia prevalence used in the analysis, one from the USA, one from Australia and another from Canada.10–13
To forecast the prevalence of blindness and vision impairment to 2020, we applied our model to forecast prevalence of blindness and MSVI into the future using United Nations Population Division’s forecasts to derive the anticipated crude numbers and age-standardised prevalence estimates.14 Finally, for estimating the causal attribution to the blindness and vision impairment burden, we estimated the proportions of overall vision impairment attributable to cataract, glaucoma, age-related macular degeneration (AMD), diabetic retinopathy, corneal opacity, trachoma, uncorrected refractive error and non-cause specific in 1990–2015 by geographical region and year.3–5
Results
The super region of interest of our meta-analysis was the focus of 46 studies (table 1). All of the included studies were cross-sectional population-based investigations, and the visual acuity data were ascertained through clinical examination. The majority of studies (41/46) included a broad age range in the adult population with a minimum age of 40 years. Out of the 46 studies, 28 were performed in urban regions, 4 studies in rural areas and 17 investigations were carried out in both, rural and urban regions. Six studies involved a Rapid Assessment methodology.
In the study super region in 2015, the crude prevalence of blindness for all ages was 0.32% (80% UI 0.13–0.55), with a prevalence of 2.42% (80% UI 1.08%–4.08%) for MSVI and 2.33% (80% UI 0.77–4.38) for mild vision impairment. The crude prevalence of presbyopia was 18.94% (5.59–35.22). These and age-standardised rates are given in table 2. Women were more likely to be blind or MSVI than men (high-income countries relative OR for blindness: 1.12 (95% UI 0.95–1.32); for MSVI: 1.15 (95% UI 1.05–1.25)).
Crude and age-standardised prevalence (%) of blindness and MSVI, mild VI and presbyopia in 2015 in high-income countries and in Eastern and Central Europe (all ages); 80% uncertainty intervals are given in brackets
The prevalence of blindness and of any kind of distance vision impairment in 2015 was slightly higher among women than among men across most of the regions (tables 2 and 3; figures 1, 2 and 3). As compared with the figures for 1990, the age-standardised prevalence of blindness for all ages and genders decreased from 0.26% (0.10–0.46) in 1990 to 0.15% (0.06–0.26) in 2015, and the age-standardised prevalence of MSVI decreased from 1.74% (0.76–2.94) in 1990 to 1.27% (0.55–2.17) in 2015.3 These crude prevalence rates were used to calculate number of individuals in the subregions affected by blindness, MSVI and mild vision impairment, respectively: 70 000, 630 000 and 610 000 in Australasia; 980 000, 7.46 million and 7.25 million in North America and 1.16 million, 9.61 million and 9.47 million in Western Europe (table 4).
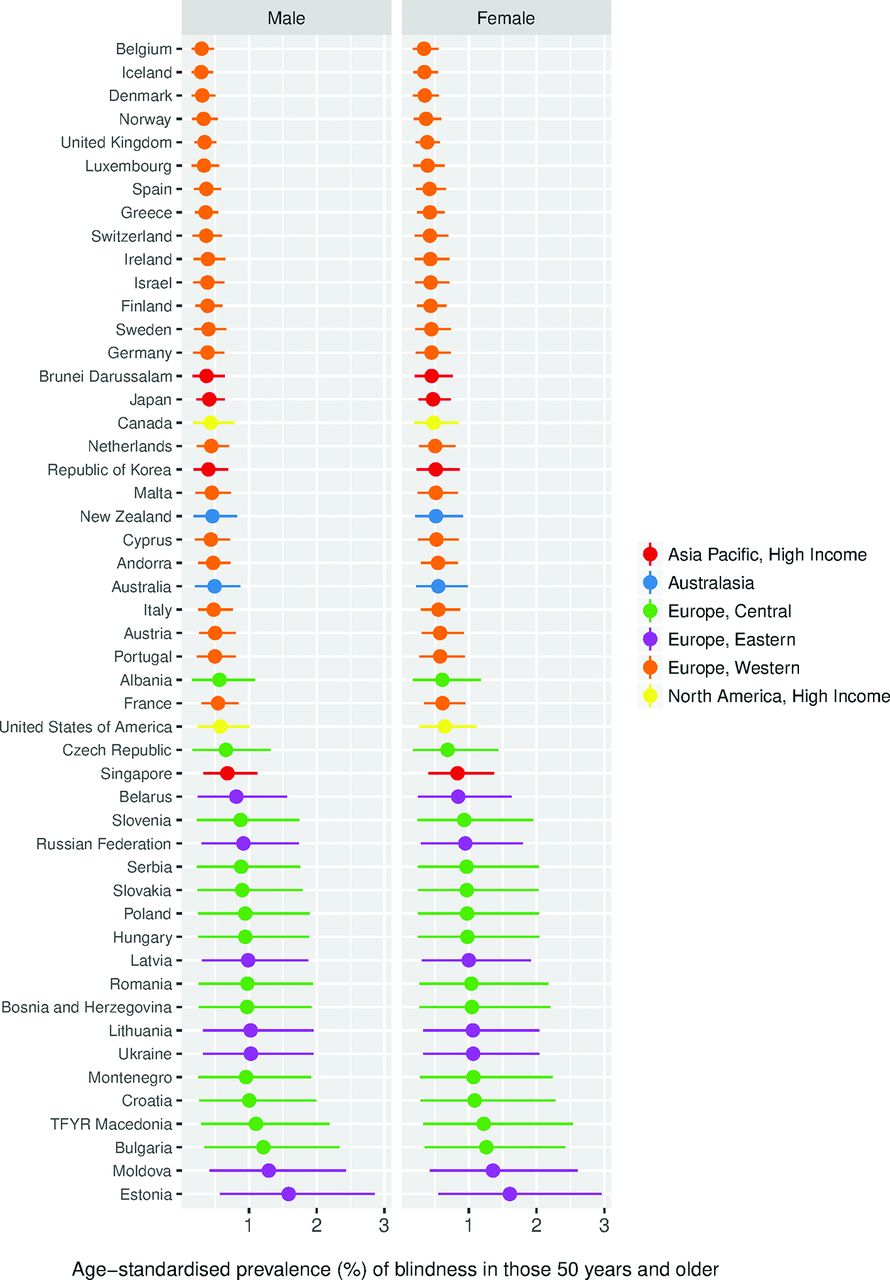
Ladder plot showing the age-standardised prevalence of blindness in men and women aged 50+ years for 2015. These are modelled estimates using prevalence figures applied to the individual populations of countries (point estimates with 80% uncertainty intervals are displayed).

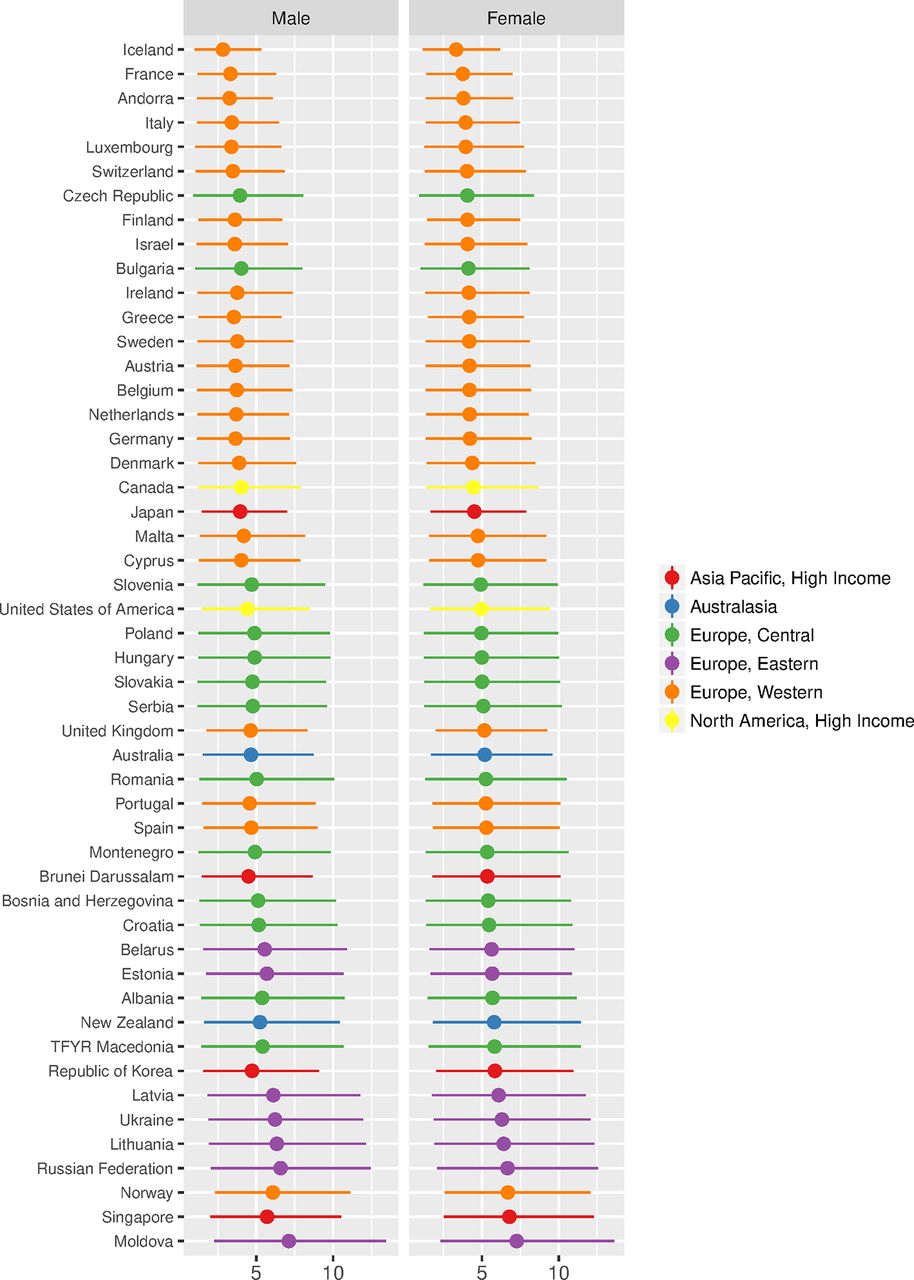
Ladder plot showing the age-standardised prevalence of moderate and severe vision impairment in men and women aged 50+ years for 2015. These are modelled estimates using prevalence figures applied to the individual populations of countries (point estimates with 80% uncertainty intervals are displayed).
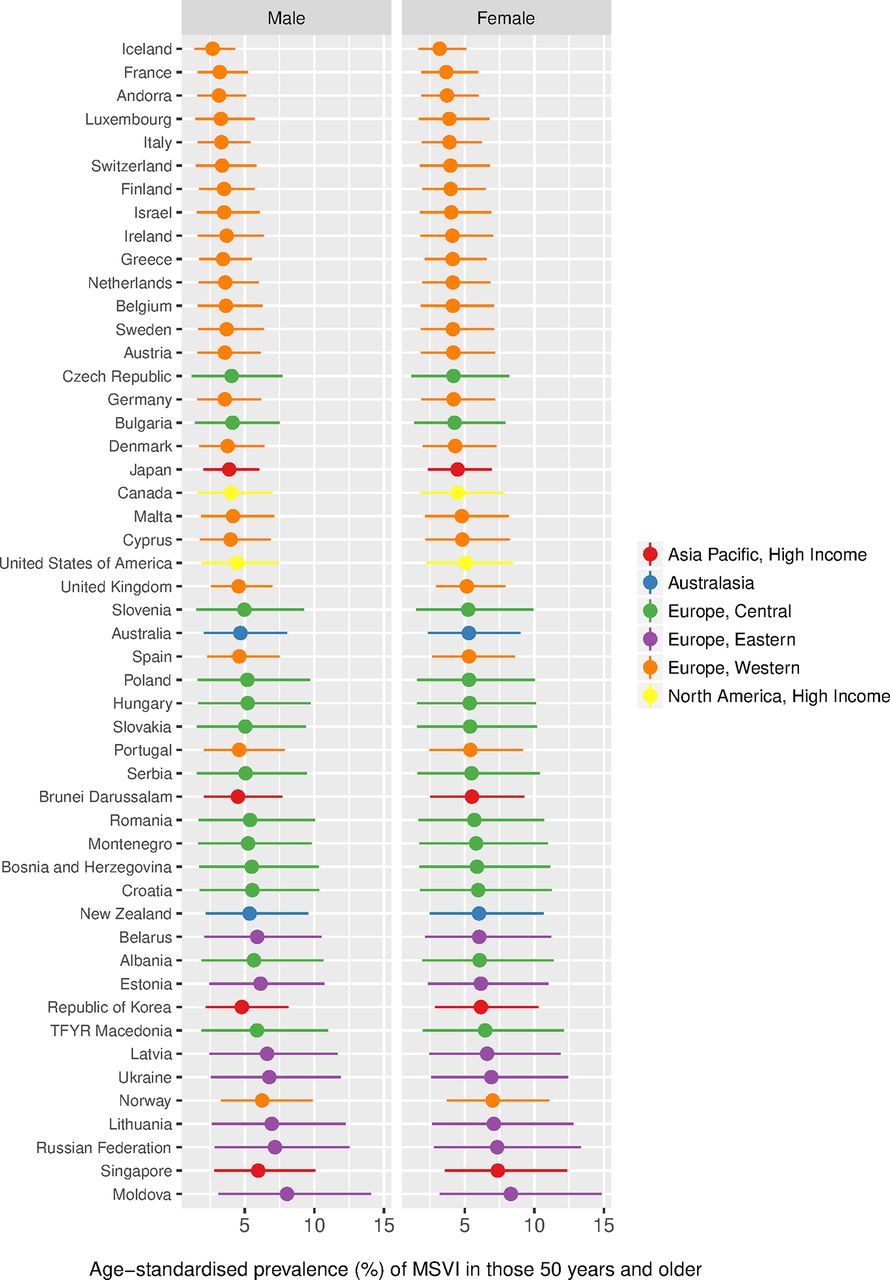
Ladder plot showing the age-standardised prevalence of mild vision impairment in men and women aged 50+ years for 2015. These are modelled estimates using prevalence figures applied to the individual populations of countries (point estimates with 80% uncertainty intervals are displayed).
Age-standardised prevalence of blindness and MSVI and VI by sex and region comparing adults 50 years and older with all ages, for 2015 in high-income countries and in Eastern and Central Europe; 80% uncertainty intervals are given in brackets
Estimated number of people (millions) affected by blindness and MSVI, mild VI and presbyopia in high-income countries and in Eastern and Central Europe by region in 2015 and projections to 2020; 80% uncertainty intervals are given in brackets
Among those aged 50 years and older in the super region of high-income countries and Eastern and Central Europe, 6.72% (80% UI 2.99–11.33) were blind or vision impaired. The most common cause of all forms of vision impairment in this age group was uncorrected refractive error with a crude prevalence of 3.03% (80% UI 1.28%–5.3%). Ranked by crude prevalence in this age group, the next most common causes were cataract (1.07%; 80% UI 0.31–2.53), AMD (0.81%; 80% UI 0.09–2.80), glaucoma (0.33%; 80% UI 0.04–1.15) and diabetic retinopathy (0.28%; 80% UI 0.02–1.10). A detailed datasheet of cause-specific crude and age-standardised prevalence and number of people affected of blindness and MSVI for high-income countries and in Eastern and Central Europe by region in 5-year intervals from 1990 to 2020 is given in online supplementary appendix table 1 for all ages and in online supplementary appendix table 2 for those aged 50 years and older.
Supplementary file 1
Supplementary file 2
The top causes of blindness worldwide from 1990 to 2020 are presented in table 5a–d.14 In 1990, cataract was the most frequent cause of blindness, followed by uncorrected refractive error, glaucoma, AMD, cornea-related diseases, trachoma and diabetic retinopathy (table 5a). This world ranking of top 4 causes remained constant in 2015 (table 5c) and by 2020 (table 5d).
Percentage of total blindness by cause for all ages in (a) 1990, (b) 2010, (c) 2015 and (d) 2020; 80% uncertainty intervals are given in brackets
Within the regions that comprise the super region of high-income countries and Eastern and Central Europe, cataract was also the most common cause of blindness in 2015 (table 5c) ranging from 19.7% (Australasia) to 25.4% (Central Europe) of the blindness burden (vs 35.2% of world blindness burden). AMD was the second most common cause of blindness in all regions accounting for 15.4% (Western Europe) to 19.5% (Eastern Europe) of the blindness burden (vs 5.9% of world blindness burden), corresponding to a higher prevalence of more easily treated conditions in less developed countries. Within this super region, glaucoma was the third most common cause of blindness in all regions, accounting for 13.5%–14.3% of the blindness burden. It was followed by uncorrected refractive error that caused 13.0% to 13.1% of all blindness burden. Diabetic retinopathy accounted for 3.1% (Central Europe) to 4.9% (Eastern Europe) of the blindness burden (vs 1.1% of world blindness burden). Cornea-related disorders accounted for 2.4% (North America, high income) to 3.6% (Central Europe) of the blindness burden, ranking sixth in all regions except for Central Europe where they surpassed diabetic retinopathy to rank fifth as a cause of blindness. The cause-specific proportion of blindness rankings in this super region are expected to change by 2020 with glaucoma becoming the third most common cause for blindness in all regions, whereas undercorrection of refractive error is expected to fall back to the fourth position (table 5d). Between 1990 and 2015, a decline in the proportion of blindness due to cataract and cornea-related diseases was observed, whereas the proportion of diabetic retinopathy-related blindness increased.
The top causes of MSVI worldwide from 1990 to 2020 are presented in table 6a–d.6 In 1990, uncorrected refractive error was worldwide the most frequent cause of MSVI followed by cataract, AMD, glaucoma, corneal opacity, trachoma and diabetic retinopathy (table 6a). This world ranking of top 4 causes remained constant in 2015 (table 6c) and by 2020 (table 6d). At the lower end of the ranking list, diabetic retinopathy increased, and cornea-related disorders decreased in their ranking positions as causes for MSVI.
Percentage of total moderate to severe vision impairment by cause for all ages in (a) 1990, (b) 2010, (c) 2015 and (d) 2020; 80% uncertainty intervals are given in brackets
Within the regions that comprise the super region of high-income countries and Eastern and Central Europe, uncorrected refractive error was by far the most common cause of MSVI in 2015 (table 6c) ranging from 48.5% (Eastern Europe) to 49.6% (Western Europe) of the MSVI burden (vs 52.3% of world MSVI burden). Cataract was the second most common cause of MSVI in all regions and accounted for 14.1% (Australasia) to 18.2% (Central Europe) of the MSVI burden (vs 25.2% of world MSVI burden). Within this super region, AMD was the third most common cause of MSVI in all regions and accounted for 10.7%–13.4% of the MSVI burden (vs 4.4% of world MSVI burden). Glaucoma accounted for 3.6% (Western Europe) to 4.1% (Eastern Europe) of the MSVI burden (vs 2.1% of world MSVI burden), whereas diabetic retinopathy accounted for 3.1% (Central Europe) to 5.1% (Eastern Europe) for MSVI burden. Glaucoma was the fourth most common cause of MSVI in Central and Western Europe, whereas diabetic retinopathy was the fourth most common cause of MSVI in the Asia Pacific high-income region, Australasia, Eastern Europe and in the North America high-income region. The cause-specific proportion of MSVI rankings in this super region are expected to remain relatively constant to the year 2020 (table 6d), except for a slight increase for diabetic retinopathy in its proportion of MSVI burden.
Between 1990 and 2015, a decline in the proportion of cataract MSVI and of cornea-related diseases associated MSVI was observed, whereas the proportion of MSVI due to diabetic retinopathy increased.
Discussion
This update, using an improved statistical model, provides prevalence data and numbers affected for this super region through 2015 using data from more data sources (n=46) than our previous meta-analysis (n=37) for 2010 estimates. This super region of high-income countries and for Eastern and Central Europe is home to 11.5%, 14.7% and 16.2% of the World’s blind, moderately and severely vision impaired and mild vision impaired people, respectively (table 4). Additionally, we estimate that 13.0% of the world’s population of presbyopes resides in this super region. By 2020, this contribution to the world’s vision impaired is expected to lessen slightly (10.8%, 13.9%, 15.5% and 11.9%, respectively). We estimate that 66.6 million people in this super region were unable to see 6/12 in the better eye in 2015, and that this number will rise to 69.0 million by 2020.
Within this super region, cataract was the most common cause of blindness in 2015, followed by AMD. The contribution of glaucoma to blindness decreased between 1990 and 2015 (table 5). Only few studies have assessed the incidence of glaucoma blindness over the years of interest. The Olmsted County study suggested that incidence of glaucoma blindness was decreasing, since the 20-year probability of glaucoma-related blindness and the incidence of blindness due to open-angle glaucoma in at least one eye decreased from 1965 to 2009.15
Despite the ageing of the population, AMD has decreased in its percentage of causes for blindness during the study period. The success of previously introduced clinical therapies of exudative AMD, that is, the intravitreal injection of antivascular endothelial growth factor drugs,16–18 may have reduced the extent of vision loss from AMD to a level more favourable than 3/60.
The increasing importance of diabetic retinopathy as a cause for vision loss likely reflects the increasing prevalence of diabetes mellitus in the general population and the ageing of the population so that individuals with diabetes live to an age at which ocular complications of their systemic disease are experienced.19
Limitations of our study should be mentioned. First, there were some, mostly minor, differences in causal proportions for 1990 and 2010 in these new estimates compared with what we published for those years previously.3 This is because the model has been improved, the sources have increased and the nature of the new sources has changed. Second, rapid assessment surveys often only contributed data on presenting visual acuity and, in some cases, data on best-corrected visual acuity data, usually measured though a pinhole. With these surveys, only data relating to cataract and uncorrected refractive error were included in the model as causes for vision impairment. Third, the proportions of best-corrected vision attributable to causes other than cataract, AMD, glaucoma or trachoma (ie, diabetic retinopathy and corneal diseases) were calculated with data from surveys that had assessed at least cataract and AMD. Fourth, despite extensive data seeking, data were not available for many countries and years, were reported using sometimes incomparable definitions of vision impairment or were representative of a subnational or community area only. Fifth, a major part of the causes of blindness and MSVI has remained uncovered and has been included as ‘other causes’ in the analysis. In this updated meta-analysis, we report that ‘other causes’ accounted for about 23% worldwide of the causes of blindness, whereas our previously published 2010 estimate was 28%.4 While the proportion in the non-specific ‘other’ category is in the present report, many causes remain unspecified as a result of logistically imposed limitations of the data in the meta-analysis. Sixth, most population-based studies of eye disease did not include individuals living in nursing homes, whereas there were reports in high-income countries of double the prevalence of vision loss. Seventh, the basic studies used different definitions of the diseases, in particular for glaucoma.20 Eighth, eyes with vision loss often had several diseases, so that it might have been difficult to decide which one of the diseases was the factor contributing most to the vision loss. Finally, caution should be exercised in interpretation of projections to 2020 by cause. These projections assumed that the United Nations population projections for the future were correct, and the covariates that we used in our model for access to healthcare and literacy which have not been modelled into the future will remain unchanged after 2015. Thus, the projections to some extent reflect what would be if improvements are not made in response to this and other reports.
The results of this surveillance exercise have important implications for future health policy. The burden of uncorrected refractive error contributes to almost half of the moderate and severe vision impairment burden. Identification of remediation of barriers to adults seeking refractive error correction needs to be a priority both because of this disease burden and because this is often the route in high-income countries that leads to diagnosis of other coexistent ocular pathologies, such as cataract which also remains a substantial contributor to vision impairment. Efforts to reduce the backlog of patients requiring cataract operations should be prioritised. Heightening awareness of these causes, most of which are relatively simple to address, particularly in economically developed countries will undoubtedly assist, yet within these populations, substantial inequity in eye care access exists which needs to be better understood. Screening for glaucoma may be of benefit if targeting high-risk groups in populations.21 Vision impairment from both glaucoma and forms of AMD may be arrested or mitigated by timely intervention, and therefore, awareness of these diseases and detection and treatment strategies need to be prioritised. Although diabetic retinopathy was a less common cause of vision impairment, its contribution is rising. Several high-income countries have effective diabetic retinopathy screening programmes; programmes such as this should be actively encouraged. A broader data stream regarding the burden of visual impairment and the causes thereof also is needed to improve the accuracy of ongoing surveillance efforts to inform health policy.
References
Footnotes
RRAB and JBJ contributed equally.
Contributors RRAB, MVC, AD, AJS, NT and TP prepared the vision impairment survey data. SRF and RRAB analysed the data. JBJ and RRAB wrote the first draft of the manuscript. All authors contributed to the study design, analysis and writing of the report. RRAB oversaw the research.
Funding This study was funded by the Brien Holden Vision Institute. The results in this paper are prepared independently of the final estimates of the Global Burden of Diseases, Injuries and Risk Factors study.
Disclaimer The funders had no role in study design, data collection and analysis, decision to publish or preparation of the manuscript.
Competing interests JBJ: consultant for Mundipharma (Cambridge, UK), patent holder with Biocompatibles UK (Farnham, Surrey, UK) (Title: Treatment of eye diseases using encapsulated cells encoding and secreting neuroprotective factor and/or anti-angiogenic factor; patent no 20120263794) and patent application with University of Heidelberg (Heidelberg, Germany) (Title: Agents for use in the therapeutic or prophylactic treatment of myopia or hyperopia; Europäische Patentanmeldung 15 000 771.4). AMB: consultant for Allergan, Bausch + Lomb, Carl Zeiss Meditec, Théa and VISUfarma. Research grants from Horus. JHK: consultant for Gilead and Santen. SR: consultant for Brien Holden Vision Institute.
Patient consent Detail has been removed from this case description/these case descriptions to ensure anonymity. The editors and reviewers have seen the detailed information available and are satisfied that the information backs up the case the authors are making.
Provenance and peer review Not commissioned; externally peer reviewed.
Data sharing statement Global Vision Database (available at: http://www.globalvisiondata.org).
Collaborators A list of the members of the Vision Loss Expert Group of the Global Burden of Disease Study can be found online (http://www.anglia.ac.uk/epidemiology).
Linked Articles
- Global issues
- Global issues
- Global issues
- Global issues