Article Text

Abstract
Objective The significance of the metabolic syndrome (MS) is debated. We investigated whether MS component (by ATPIII and IDF definitions) clustering and any association between MS and prevalent cardiovascular disease (CVD) varied with age.
Research design and methods In all, 1429 adults (≥25 years) from randomly selected households in rural Victoria, Australia, were assessed for components of MS and prevalent CVD. The expected prevalence of MS was calculated following a simple probabilistic model using the prevalence of each MS component.
Results The observed prevalence of MS was greater than expected: 27.0% vs 21.2% (ATPIII) and 36.0% vs 30.1% (IDF; p<0.0001), based on the prevalence of individual components. There was significant clustering of 4 and 5 MS components in participants <65 years (p<0.0001). CVD was more prevalent in MS participants, 13.5% (IDF), 14.5% (ATPIII) versus 5.3% (no MS) p<0.0001. The OR for CVD in MS participants was greatest in those <45 years OR (95% CI): IDF 17.5 (1.8 to 172); ATPIII 24.3(2.4 to 241), p<0.001 for both, and was not significant in those >65 years. The prevalence of MS (ATPIII) with normal waist circumference (WC) was less than expected (4.8% vs 7.9%, p<0.002). Low levels of high-density lipoprotein and high triglyceride were less common in older MS participants.
Conclusions ATPIII MS is rare among those with a normal WC. MS components cluster most markedly among those aged <65 years, who also experience substantially greater rates of CVD. Younger patients with MS may warrant more aggressive CVD preventative treatment than suggested by the summation of their individual risk factors.
- Metabolic Syndrome
- Cardiovascular Epidemiology
- Ageing
- Mathematical Models and Methods
This is an Open Access article distributed in accordance with the Creative Commons Attribution Non Commercial (CC BY-NC 4.0) license, which permits others to distribute, remix, adapt, build upon this work non-commercially, and license their derivative works on different terms, provided the original work is properly cited and the use is non-commercial. See: http://creativecommons.org/licenses/by-nc/4.0/
Statistics from Altmetric.com
Key messages
Although the metabolic syndrome is associated with cardiovascular risk, the significance of this syndrome over and above its individual components is controversial.
In this study, the components of the metabolic syndrome cluster more than would be expected by chance, and this clustering is most pronounced in younger adults.
In this study, the cardiovascular disease association with the metabolic syndrome is greatest in young adults and diminishes with increasing age.
Introduction
Clustering of individual components of the metabolic syndrome (MS),1 the association of MS with cardiovascular disease (CVD),2 and the increasing prevalence of MS with age3 ,4 are not disputed, but the best definition, and indeed the overall significance, of MS remain highly controversial.5 ,6
Detractors from MS have suggested that its relevance in terms of CVD risk is no greater than the contribution of the individual components.7–11 Others have suggested that MS contributes significantly to CVD risk after correcting for risk associated with MS components in isolation, and/ or traditional CVD risk factors not included in the definitions of MS (eg, smoking).12–17 Differences in the characteristics of populations studied may account for some of the observed disparity in studies of MS and CVD, and—in particular—many,8 ,13 ,18–23 but not all,17 ,24 ,25 studies have suggested MS may have little or no association with CVD in elderly populations. The association between MS and CVD has only rarely been studied across a wide age range (inclusive of participants below middle age), although two recent such studies suggest a significant influence of age22 and gender.26
To explore this further, we assessed the impact of age on the prevalence of MS components, the clustering of MS components, and the prevalence of self-reported CVD, using both the ATPIII27 and IDF28 definition of MS.
Research design and methods
A detailed description of the methodology for the Crossroads Undiagnosed Disease Study (CUDS) has been published elsewhere.29 ,30 Briefly, this was a household survey conducted between 2000 and 2002, established to compare the prevalence of various chronic diseases, including diabetes, in a regional center (Shepparton-Mooroopna, population 35 828) with the six surrounding ‘Shire capitals’ (populations 2094–10 955) in the Goulburn Valley, rural Victoria, Australia.
Households were randomly selected from residential address lists, stratified to provide half from the regional center and a sixth from each Shire capital. A census of household residents was completed for all occupants aged ≥25 years in face-to-face interviews wherever possible. All usual residents who completed a household census were invited to participate in the CUDS, including completion of further questionnaires, blood sampling, and waist measurement. The overall survey response rate was 61% and 1454 participants participated. Of these 1454 participants, 15 participants were unable to have an ethnic-specific waist cut-off defined, and were excluded, leaving 1439 participants, in whom data were incomplete in 10: 9 had missing waist measurements, and 1 had missing blood glucose data, leaving 1429 participants.
Data were available on the presence of certain lifestyle factors, for example, alcohol consumption and cigarette smoking, and for history of treatment for diabetes, hypertension, and dyslipidemia. Specific classes of drugs such as statins were not recorded. Height, weight, blood pressure, plasma lipid, and blood glucose were measured using standard techniques, described elsewhere.29 ,30 Those without diabetes had a 75 g oral glucose tolerance test and those with diabetes had fasting plasma glucose measured. Hypertension was defined as blood pressure above ATP or IDF criteria (table 1), or treatment for hypertension. A diagnosis of pre-existing diabetes was based on a self-reported prior diagnosis of diabetes and a new diagnosis based on WHO criteria.
Frequency of MS components, and the observed versus expected frequency of MS, within age and gender subgroups
CVD was considered to be present if the participants gave a self-reported history of any of the following diseases or symptoms: myocardial infarction, angina pectoris, coronary artery bypass grafting or percutaneous coronary intervention, stroke, transient ischemic attack, arterial thrombosis, peripheral vascular disease, intermittent claudication or heart failure (in the absence of known valvular heart disease or arrhythmia). The study was approved by the Goulburn Valley Ethics Committee and signed individual consent obtained.
Statistical methods
The prevalence of each of the individual components of MS, according to ATPIII and IDF definitions, was determined within the cohort. The expected prevalence of MS was determined using a simple probabilistic model based on the product of the overall population prevalence of each MS component (see online supplementary appendix 1). This was performed for each possible combination of components satisfying the MS definition (16 possible combinations of components can satisfy the ATPIII definition, with 11 combinations for IDF). Comparison of observed and expected prevalence was made using the χ2 goodness of fit test. The sample size was originally determined on the basis of 80% power to detect a difference in prevalence of diabetes in regional versus rural centers.29 Comparison of means was performed using unpaired t test and analysis of variance for gender and age subgroups, respectively. The 95% CIs for proportions were derived by using the normal approximation of the binomial distribution.31 The data were divided into age-specific and gender-specific subgroups. Statistical significance was taken as being p<0.05. Analyses were performed using SPSS statistical software, V.22 (IBM).
Supplementary appendix
Results
The observed and expected prevalence of MS, by IDF and ATPIII definitions, and of the MS components, by age and gender, is shown in table 1. There was a 25% (95% CI 21% to 28%) absolute increase in the prevalence of high waist circumference when defined by IDF versus ATPIII criteria, and this increase was relatively constant in the age and gender subgroups. The observed prevalence of MS was significantly higher than expected by chance association of the components by IDF and ATPIII definitions, and in all subgroups except the >65 years of age subgroup. The extent to which MS components cluster, determined by the difference in observed versus expected prevalence, is greatest in those <45 years of age and diminishes with age (table 1).
The observed prevalence of MS, and of the individual MS components (except for low levels of high-density lipoprotein (HDL) cholesterol and high triglyceride) increased with age. High blood glucose was the component that showed the most pronounced increase (sixfold by ATPIII definition, fourfold by IDF) across the age categories. Hypertension showed a threefold increase.
The prevalence of self-reported CVD was 7.9% overall, and increased with age (table 2). MS (both ATPIII and IDF definitions) was associated with a higher prevalence of CVD in participants <65 years of age. The degree of association was higher in women, and markedly declined with increasing age in men and women, with no statistically significant difference above the age of 65 years, and the prevalence being numerically very similar except in men older than 65 years of age by ATPIII definition. Diabetes was associated with a higher prevalence of CVD (males 25.5% vs 10%, OR 3.07 (95% CI 1.57 to 6.03), p<0.001; females 14.9% vs 5.4%, OR 3.09 (95% CI 1.47 to 6.52), p=0.002). Analysis of age and gender subgroups did not show a significant association between diabetes and CVD except in middle-aged women, but numbers were small. However, the OR for the association between diabetes and CVD was broadly similar to the OR for MS and CVD, in each age and gender category, with the exception of middle-aged women with MS by the IDF criteria, where the OR was much higher (table 2).
Frequency of self-reported prevalent cardiovascular disease, by gender, age group, and presence of MS (by ATPIII and IDF definitions), or a diagnosis of new or pre-existing DM
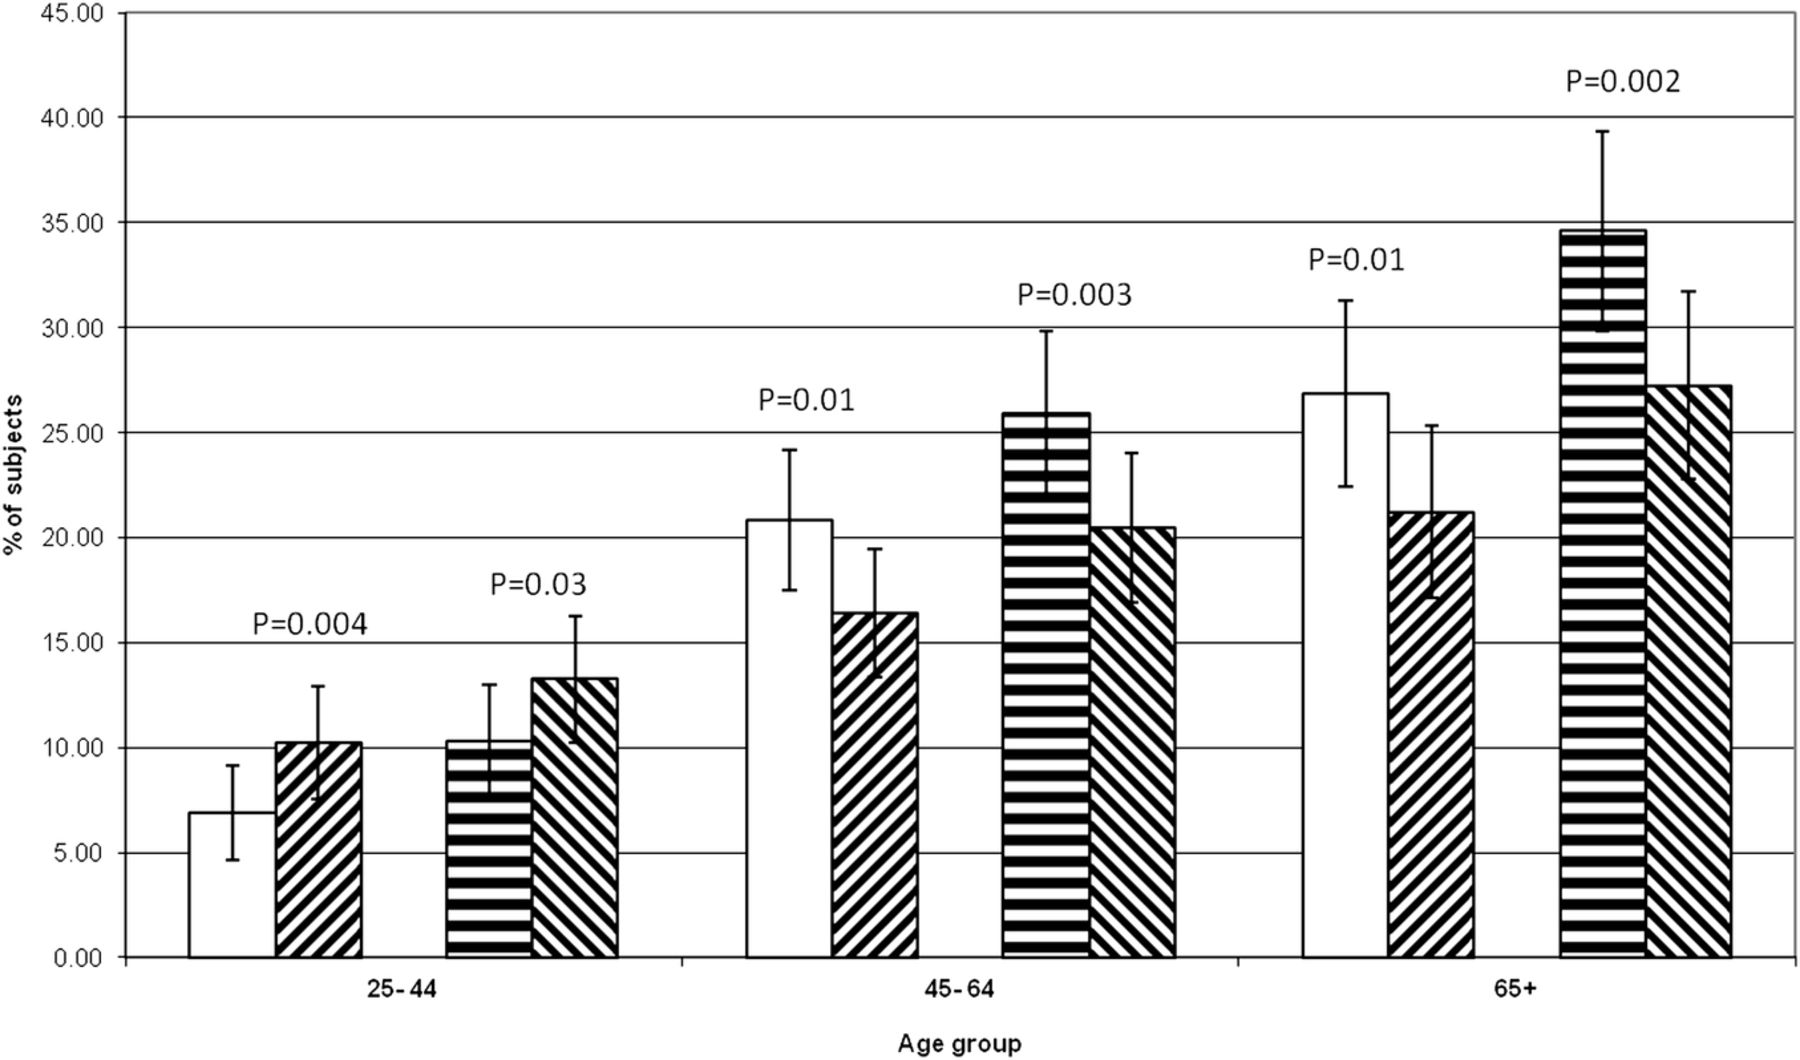
Figures 1 and 2 show the observed versus expected frequency for MS by age category when considering participants with four or five components of MS, or only three components, respectively. These show that the observed frequencies of MS with four or five components present are far greater than expected across all age groups, and by both definitions, being most pronounced in younger participants. However, there is only a greater than increased prevalence of three-component MS in the youngest age group. In those aged ≥45 years, MS is significantly less prevalent than expected, and in the oldest age group, this accounts for a lack of greater than expected prevalence of MS overall. Analysis by gender subgroup also showed higher than expected prevalence of MS by both definitions for participants with four or five MS components for males and females (data not shown).
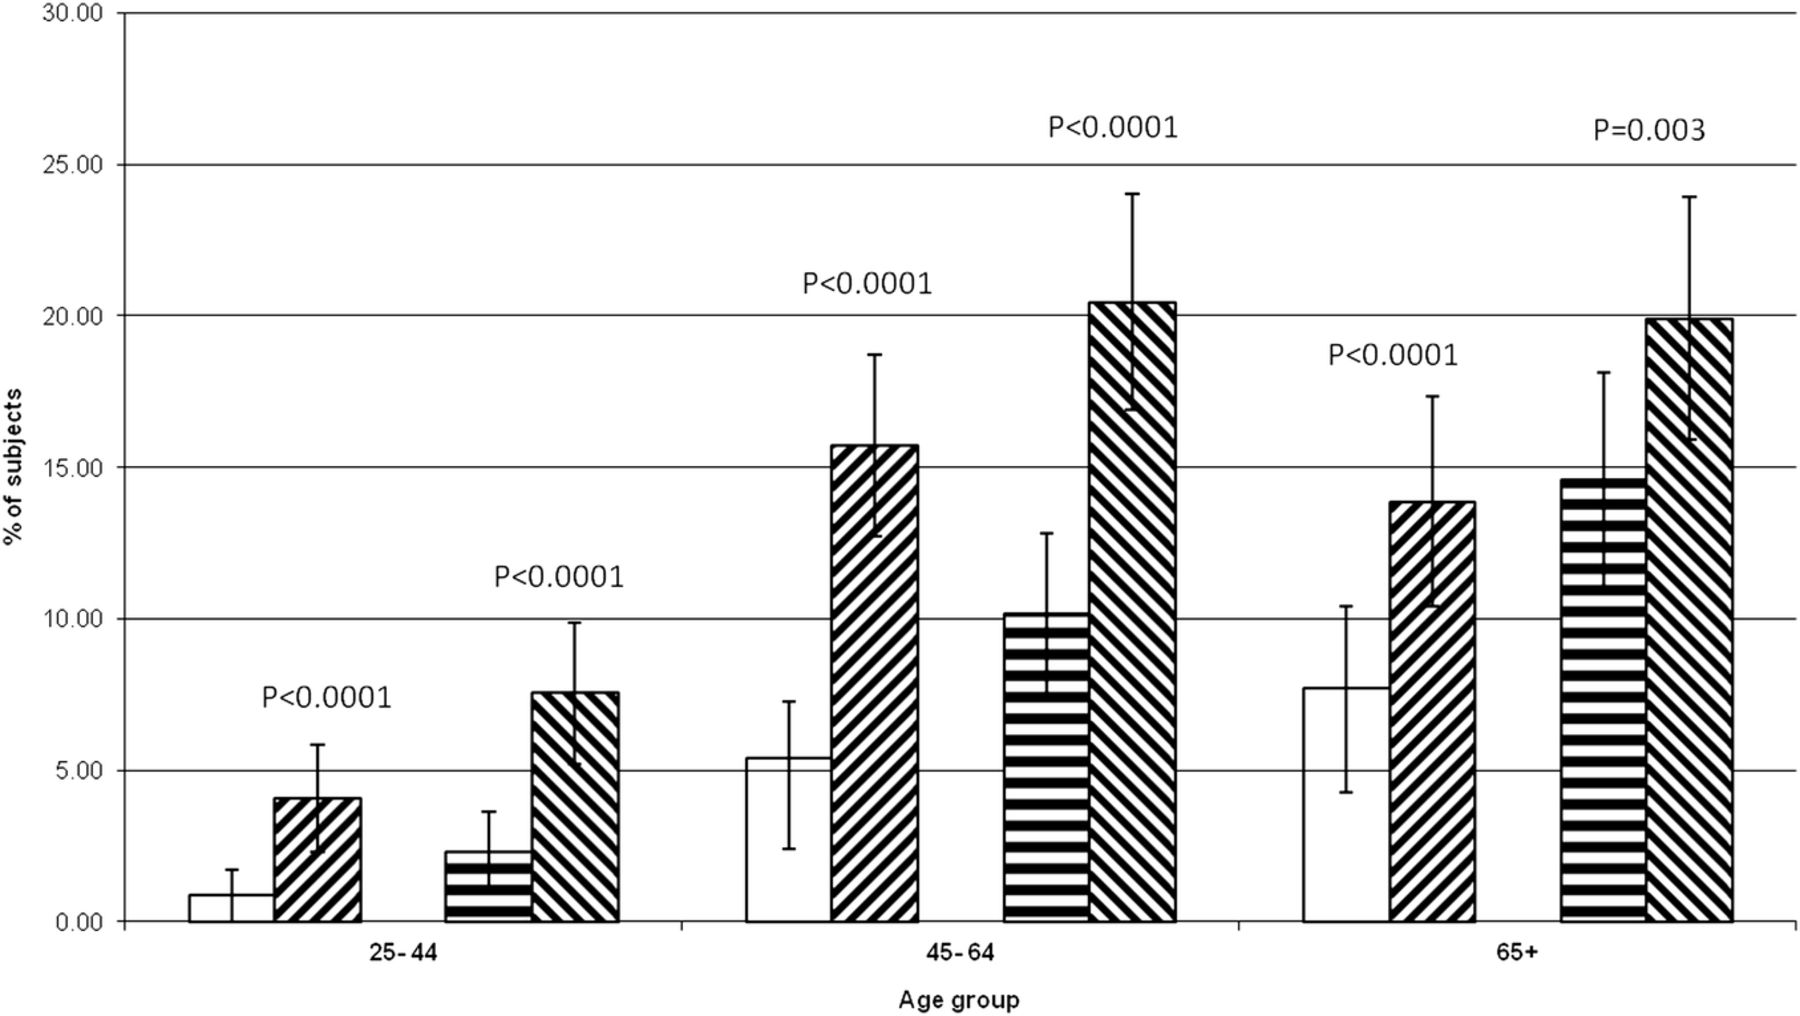
Metabolic syndrome—participants with four and five components—expected and observed frequencies by age. No lines: ATP expected, diagonal lines (upward to right): ATP observed, horizontal line: IDF expected, diagonal lines (downward to right): IDF observed. Error bars=95% CI of proportion. p Value is observed versus expected frequencies.
Metabolic syndrome—participants with only three components—expected and observed frequencies by age. No lines: ATP expected, diagonal lines (upward to right): ATP observed, horizontal line: IDF expected, diagonal lines (downward to right): IDF observed. Error bars=95% CI of proportion. p Value is observed versus expected frequencies.
The expected versus observed frequency of MS in those with normal waist circumference (by ATPIII definition) was: 2.8% vs 2.4% at age 25–44 years, 9.8% vs 3.8% at age 45–64 years, and 12.8% vs 10.8% at age >65 years (statistically significant only for age 45–64 years, p=0.002). MS therefore occurs less often than expected in participants with a normal waist, if all age groups are considered together, but this only becomes significant in the middle-aged when the age groups are considered separately. Nonetheless, the observed waist trend is the same in all three age groups.
The proportion of participants reporting CVD by MS definition was: IDF 13.5%, ATPIII 14.5%, both IDF and ATPIII 13.9%, ATPIII only 50%, IDF only 12.3%, and no MS by either definition 5.3% (p<0.0001 (MS overall vs no MS), p=NS for MS subgroups). Six participants had MS by the ATPIII, but not the IDF definition (ie, they had a normal waist circumference by IDF criteria). Although they had a high prevalence of CVD, the number of participants in this subgroup is too small for meaningful statistical comparison.
Discussion
The clinical entity of a syndrome is not uniquely defined but usually involves the simultaneous occurrence of symptoms, signs, diseases, or laboratory findings more often than expected by chance, implying a single underlying cause, and an association with risks or outcomes greater than those of the individual parts of the syndrome considered in isolation. The extent to which MS fulfills some or all of these criteria is hotly debated.
The optimal definition of MS, and indeed which components and which cut-offs to include, has been controversial and is reflected in the many definitions of MS in use over the past 17 years.27 ,28 ,32 ,33 Some argue that in defining MS, we lose rather than gain predictive power for CVD and mortality if MS does not confer any risk beyond that of its individual components, because in defining MS in a dichotomous fashion, requiring the presence of three or more risk factors, we lose predictive information from some risk factors entirely and from others in part.5 ,7
Some individual reports,8–10 and meta-analyses2 ,34 suggest that the value of MS beyond that of its individual components or traditional risk factors as a predictor of mortality and CVD is modest at best, in contrast to other reports.12–17 However, as Ford2 suggests, a gradient of risk of adverse outcomes may exist within MS due to other factors not included in the definition.
Our data demonstrate a prevalence of MS that is higher in men than in women, that increases with age and that is more common when defined by IDF rather than ATPIII criteria. This has been shown in other populations.3 ,4 ,22 ,35 Our data showed a similar prevalence of MS (ATPIII and IDF definitions) according to gender and age to that of another study in an Australian population.36 By contrast, comparing our data showed a more marked difference in prevalence by definition, and also by gender, than a US population, with a slightly lower prevalence of MS overall.3 The individual MS components (except for low HDL and high triglyceride) increased with age, which is again a finding consistent with other populations.4 ,26 Sumner et al observed similar age-specific prevalence in a US population, and also noted lower HDL, less HBP, and less hyperglycemia in young participants. That study, however, excluded participants with CVD.4
Despite the increasing prevalence of MS with age, our study demonstrated that the effect of clustering of MS components diminished, rather than increased, with age. The relative difference in observed and expected MS prevalence was highest in the youngest age group (almost 100% for the ATPIII definition). This pattern of clustering, and the different relative contribution of components with age, suggests that MS in young participants may be ‘different’ from that in older participants, with different prognostic and treatment implications. Whether this age difference is due to competing mortality and gradual loss (death) of those with more MS components or a different etiology is unclear and requires a prospective study. The leveling off in the rise of MS prevalence with age, shown in our data and also in those of another study on the Australian population,36 could be explainable by a survivor effect—that is, a relatively earlier death by young participants with MS, causing a fall in prevalence in old age.
An explicit underlying disease process has long been implied and sought for MS,37 with central obesity and/or insulin resistance being the most likely candidates, although these factors have not been able to account for all the clustering observed in MS populations.5 The lower than expected prevalence of MS (by ATPIII definition) in those with a normal waist would strengthen the case for central obesity being fundamental to the definition of MS. Obesity in the young may predispose to MS to a greater extent than in the elderly,38 and may account for the observed increase in prevalence of MS in recent years that is disproportionately highest in the young, particularly females.35
Our data show a striking difference in CVD association with age. The OR for CVD in MS was much higher in young participants than in old participants (in whom the effect of MS was not significant). The association in women was greater than that in men in those <65 years of age. The CVD risks of MS2 ,34 ,36 and of diabetes39 have been shown to be greater in women in several studies. Other studies have suggested this excess risk may relate to the loss of the cardioprotective effect of female gender with MS or type II diabetes.39 The lack of CVD association with MS in older participants is supported by the findings of Mozaffarian et al,8 who found that MS did not better predict cardiovascular risk in older adults than did hypertension and impaired glucose tolerance alone, which are the two components that increase the most in prevalence with age; and Thomas et al,22 who found that HBP, but not presence of MS, predicted mortality in the elderly. Others have also suggested no increased risk,11 ,13 ,18–21 ,23 or a risk of lesser magnitude,36 of CVD in older participants with MS. In studies where increased mortality in older age associated with MS has been identified,17 ,24–26 it has been shown in women only in two studies24 ,25 and in men only in one.26 This recent study (the MORGAM study),26 using a pooled data set from several European populations and MS defined using surrogates for waist circumference and glucose intolerance, found MS was associated with coronary heart disease and stroke in men at all ages, but only predicted stroke in older women. The prevalence of MS in that study was low, particularly in men, compared with ours, and with those in other Australian studies36 and in US populations,3 ,35 and may reflect a lower population prevalence when the cohort had been recruited (1982–1997).
Our study has some strengths and weaknesses. Strengths were a large prospectively recruited data set, randomly selected from members of the general population who had criteria for MS addressed directly, rather than inferred from surrogate measurements of BMI or blood glucose. Weaknesses are the use of prevalent (and therefore retrospective), self-reported data on CVD, rather than long-term data with hard end points for CVD incidence or mortality. Also, we did not specifically address if the CVD was in excess of that predicted by the individual MS components in isolation. The use of prevalence rather than incidence data raises the possibility of a survivor effect—in other words, the decreasing association of CVD and MS in age could be due to premature death from CVD in participants who did not survive until older age. Long-term treatment or differential use of lipid-lowering therapy could account, in part, for the change in HDL and triglycerides, with age. Our study did not have data on the specific classes of lipid-lowering agents used. Our data were originally collected some time ago, and the prevalence of MS has changed in that time. The prevalence of obesity is rising, with an increase in MS prevalence reported in the USA between 1909 and 2000.35 Recent estimates40 of the US population comparing 1999–2010 show a reduction in MS prevalence, and a lower MS prevalence than we report; however, MS in that study was defined on the basis of biological parameters rather than treatment, and the obesity rate and treatment rates (with hypoglycemic agents, lipid-lowering agents, and antihypertensives) have all risen in that time. This is unlikely to diminish the positive findings of our study.
The small number of participants with a normal or near-normal waist but who satisfy other criteria for MS (by ATPIII) may be a special subgroup41 deserving further study—they have a very high prevalence of CVD (although statistically insignificant), and perhaps have a different phenotypic expression of underlying disease—or may have lost earlier obesity secondary to underlying severe cardiovascular or liver disease.
Conclusion
MS is common in this Australian population, using both ATPIII and IDF definitions. It occurs more than we would expect by the chance combination of its components, due to clustering in younger participants, and also in participants with four or more MS components. However, only younger participants have an increase in reported prevalent CVD. Whether this is due to older patients with MS being ‘survivors’ is unclear and requires a prospective study. Modern CVD risk engines do not adjust for a clustering of risk factors and randomized controlled trials of prevention of CVD have not been reported in patients with 4–5 MS components. We wonder if younger patients with MS, with their greater absolute risk, would benefit from more aggressive CVD prevention, and recommend urgent post hoc analyses from existing studies to address this question.
References
Footnotes
Contributors DS established the CUDs project and oversaw recruitment and data collection. The idea for this study came from DS, MCD, and SC. Data analysis was by SC and DS. The initial draft of the manuscript was prepared by MCD and SC. All the authors approved the final manuscript.
Funding This work was supported by The International Diabetes Institute and the University of Melbourne, Department of Rural Health, which is funded under the Department of Health and Ageing Rural Health programme.
Competing interests None declared.
Ethics approval Goulburn Valley Ethics Committee.
Provenance and peer review Not commissioned; externally peer reviewed.
Data sharing statement No additional data are available.