Article Text

Abstract
Objectives To (a) assess the association between dietary diversity (DD) score, socioeconomic status (SES) and maternal body mass index (BMI), and (b) the variation of the effects of DD and SES at different points of the conditional distribution of the BMI.
Methods The study used Demographic and Health Surveys round 5 data sets from Ghana, Namibia and Sao Tome and Principe. The outcome variable for the analysis was maternal BMI. The DD score was computed using 24-hour dietary recall data. Quantile regression (QR) was used to examine the relationship between DD and SES, and maternal BMI, adjusting for other covariates. The QR allows the covariate effects to vary across the entire distribution of maternal BMI.
Results Women who consumed an additional unit of DD achieved an increase of 0.245 in BMI for those in the 90th quantile in Ghana. The effect of household wealth increases for individuals across all quantiles of the BMI distribution and in all the 3 countries. A unit change in the household wealth score was associated with an increase of 0.038, 0.052 and 0.065 units increase in BMI for individuals in the 5th quantile in Ghana, Namibia and Sao Tome and Principe, respectively. Also, 0.237, 0.301 and 0.174 units increased for those in the 90th quantile in Ghana, Namibia and Sao Tome and Principe, respectively. Education had a significant positive effect on maternal BMI across all quantiles in Namibia and negative effect at the 5th, 10th and 90th quantiles in Sao Tome and Principe.
Conclusions There is heterogeneity in the effects of DD and SES on maternal BMI. Studies focusing on the effects of diet and socioeconomic determinants on maternal BMI should examine patterns of effects at different points of the conditional distribution of the BMI and not just the average effect.
- PUBLIC HEALTH
This is an Open Access article distributed in accordance with the Creative Commons Attribution Non Commercial (CC BY-NC 4.0) license, which permits others to distribute, remix, adapt, build upon this work non-commercially, and license their derivative works on different terms, provided the original work is properly cited and the use is non-commercial. See: http://creativecommons.org/licenses/by-nc/4.0/
Statistics from Altmetric.com
Strengths and limitations of this study
Use of large nationally representative samples, thereby providing more robust estimates of observed associations.
Outcome variable (body mass index) for the analysis was objectively measured, reducing possible misclassification.
Use of quantile regression enables us to get a complete picture of the effects of dietary diversity and socioeconomic status on maternal nutritional status.
The use of cross-sectional surveys may not allow causation to be established.
Individuals may not be able to report their food consumption accurately due to recall bias.
Introduction
The poor nutritional status of women is of great concern globally, both for the health and well-being of women and their offspring. Maternal undernutrition contributes to fetal growth restrictions, which in turn increase the risk of neonatal deaths and, for survivors, of stunting by 2 years of age.1 Regrettably, however, poor nutrition is highly prevalent among women in low and middle income countries, resulting in substantial increases in mortality and overall disease burden.2 ,3 For example, in three Asian countries: India, Bangladesh and Pakistan, it is estimated that the proportion of women suffering from chronic energy deficiency (CED) (body mass index (BMI) <18.5 kg/m2) stands at about 70%,4 while in Africa the corresponding proportion ranges from 20% to 40%.1 ,2 The high prevalence of undernutrition among women could be explained partly by the burdens of childbirth and social conditions in general.5 Also, it has been observed that the bane of undernutrition in Africa is compounded by high prevalence of HIV infection among women, which compromises their nutritional status.3 Relatedly, across the African continent, the prevalence of anaemia ranges from 21% to 80%, with similarly high values for both vitamin A and Zinc deficiency levels.3 Narrowing down to the countries being studied, the prevalence of anaemia among women aged 15–49 years is as high as 42% in Sao Tome and Principe and Ghana, respectively,6 ,7 while 21% of women in Namibia are anaemic.8 In relation to mortality, about 20% of maternal deaths in developing countries can be attributed to poor nutrition.9 The preceding discussion strengthens the case for continued research to identify the key factors associated with maternal nutrition. To this end, the review below highlights some of the factors explaining women's nutrition in resource-poor settings.
Dietary diversity (DD), a proxy indicator for micronutrient adequacy in women, is one of the key factors associated with maternal nutritional status. The positive effects of DD on maternal nutritional status have been documented by a few studies in the literature.10–13 Women who have higher DD tend to have better nutritional outcomes compared with those who have low DD. This is evident in studies conducted in rural Burkina Faso.10 ,11 Conversely, a related study also in Burkina Faso did not find a significant association between DD and women's anthropometric status.14 Although there is a paucity of evidence on the relationship between DD and maternal nutritional status, the few studies reviewed above have clearly shown the importance of DD for maternal health outcomes.
Women's employment status is an important socioeconomic variable explaining nutritional status. Girma and Genebo15 observed in Ethiopia that compared with women who were employed, the unemployed women were at a significantly higher risk of CED. The possible explanation proffered by the authors is that women in paid employment could provide an additional income source that can improve food security of the household and raise the status of women by allowing them to have more control over resources.15 Thus, women's employment increases household income, with consequent benefit to household nutrition in general, and the woman's nutritional status in particular.15 ,16 Some evidence also indicates that the nutritional impact of increased household income is a function of the income earner and the kind of income earned.17 The findings about the importance of employment for maternal health outcomes are further strengthened by another study which found that unemployed women were at high risk of undernutrition, even in households with a relatively better socioeconomic status (SES).18 Conversely, a study that assessed the impact of part-time employment on the nutritional status of women in rural Nepal found that women employed part-time did not have improved nutritional status as compared with their unemployed counterparts.19 This is not surprising as other studies have documented that the casual wage workers group is a group with one of the worst nutritional outcomes.20
Similarly, women's educational status, an important indicator of SES, plays an important role on maternal nutritional status, irrespective of the level achieved. For example, there is evidence that women who receive even a minimal education are generally more aware than those who have no education regarding how to use available resources for the improvement of their own nutritional status and that of their families.15 Education may also empower women to make independent decisions, to be accepted by other household members, and to have greater access to household resources that are important to nutritional status.4 ,16
Furthermore, household economic status is another key determinant of nutritional status of women. Evidence from the literature showed that compared with women residing in medium/higher economic status households, women in very poor or poor households have a significantly higher risk of being malnourished.15 ,16 ,20 Similar findings were observed in earlier studies.21 ,22 This may be an indication that household economic status is positively associated with household food security, which is a prerequisite for access to adequate dietary intake and improved nutritional status for all members of the household.23 Several other studies have shown the strong relationship between household SES and maternal nutritional status in resource-poor settings.24 ,25 Nonetheless, a study in Kenya showed that the mean BMI of women decreases with increasing household income.26 One possible reason for the apparently low response of BMI to increasing household income is the time allocation patterns of women. Women in the sample spend the largest proportion of their day in home production activities which are energy intensive.26 In examining the relationship between nutritional indicators and the time devoted to work, Kennedy and Garcia26 observed a significant, positive association between both BMI and height and the amount of time devoted to work.
Although the studies reviewed above provided valuable insights into the factors associated with maternal nutritional outcomes, their results only throw light on the mean of the outcome variable. This does not give a full picture of the relationship between explanatory and outcome variables. There is almost non-existent literature in the maternal nutrition research arena on the use of quantile regression (QR) to estimate the effects of DD and SES on maternal nutritional status. The present study is therefore intended to fill this gap. Suffice it to say that the ordinary least squares (OLS) is designed to estimate the mean effect of the independent variables on the dependent variable. This provides an estimate of how an improvement in the independent variable can positively affect the dependent variable. The alternative QR approach we employed in this paper goes further. It allows us to estimate the effect of DD and SES at different points of the conditional BMI distribution. This makes it possible to assess the equity implications resulting from changes in DD or SES. Thus, making the question more precise, where we ask not what the effect of DD and SES on maternal BMI is on average, but for whom such effects are significant and how large they might be. To this end, this study applies a QR technique to the DD and SES issue in order to better understand for whom improvement in DD and SES counts and how large the effects are across various points of the conditional BMI distribution. There lies the significance of this study. The empirical question this study intended to address was ‘Does the effects of dietary diversity and socioeconomic status on maternal BMI vary across the conditional distribution of the BMI?’.
Methodology
Study settings
The study used data collected in Ghana, Namibia and Sao Tome and Principe. Ghana, officially called the Republic of Ghana, is an independent state. It is located in the West Africa subregion. Ghana is bordered by the Ivory Coast in the west, Burkina Faso in the north, Togo in the east and the Gulf of Guinea and Atlantic Ocean in the south. The population of Ghana in 2015 is estimated to be 27 million, up from the official 2010 census figure of 24.2 million.27 Similarly, Namibia, officially the Republic of Namibia, is a country in south-western Africa that covers ∼824 000 km2. It is bordered by the Atlantic Ocean in the west, Angola and Zambia in the north, Botswana in the east, and South Africa in the south and east.8 According to the 2014 population census, the total population of Namibia stands at about 2.4 million people. Sao Tome and Principe, officially the Democratic Republic of Sao Tome and Principe, is an island nation in the Gulf of Guinea off the western coast of Central Africa. It comprises two main islands: Sao Tome and Principe, which are 87 miles apart and about 150 miles off the coast of Gabon. It has a total population of 192 993 people, according to the 2013 population census.
Data source and study participants
The study used Demographic and Health Surveys (DHS)28 data from three African countries: Ghana, Namibia and Sao Tome and Principe. These countries were selected based on the availability of maternal dietary data. Our plan was to choose one country from each of the five subregions in Africa (regional representation). However, after examining all the data sets from Africa, we noticed that most of them were missing maternal dietary data. For example, in East Africa, only Ugandan DHS collected maternal dietary data. However, Uganda was not included in the analysis because more than 50% of the cases were missing maternal anthropometry data.
The design of the DHS surveys is identical across all participating countries, making possible the comparisons between and across countries. The DHS used a two-stage sample design.29 ,30 The first stage involved the selection of sample points or clusters from an updated master sampling frame constructed from the National Population and Housing Census of the respective countries. The clusters were selected using systematic sampling with probability proportional to size. Household listing was then conducted in all the selected clusters to provide a sampling frame for the second stage selection of households. The second stage of selection involved the systematic sampling of the households listed in each cluster, and households to be included in the survey were randomly selected from the list. The rationale for the second stage selection was to ensure adequate numbers of completed individual interviews to provide estimates for key indicators with an acceptable precision. All men and women aged 15–59 and 15–49, respectively, in the selected households were eligible to participate in the surveys if they were either usual residents of the household or visitors present in the household on the night before the survey. However, the analyses of this study were restricted to women. To assess the nutritional status of participants, anthropometry data were collected from participants. The weight measurements were undertaken using electronic Seca scales with a digital screen, which was designed and produced under the guidance of UNICEF. Height measurements were obtained using a measuring board produced by Shorr Productions. The total samples used in this analysis were 2038, 3222 and 1112 women aged 15–49, representing Ghana, Namibia and Sao Tome and Principe, respectively.
Ethics statement
Ethical approvals were obtained from the national ethics committees of the respective countries before the surveys were conducted. Written informed consent was obtained from every participant before they were allowed to take part in the survey. The DHS Program, USA, granted the authors permission to use the data. Since the data were completely anonymous, the authors did not seek further ethical clearance.
Measures
Outcome measure
The outcome measure was maternal BMI, an indicator of CED in women. BMI, which is also known as Quetelet's index,31 was derived by dividing weight in kilograms by the square of height in metres.31 Unlike the nutritional status of children, the evaluation of nutritional status of women does not require a reference table from a well-nourished population. For the purpose of this study and due to the methodological choice to use QR, the estimated BMI (kg/m2) was used in the analysis as a continuous variable.
Explanatory measures
The candidate explanatory variables were classified into DD score and SES. The maternal DD score was computed using 24-hour dietary recall data of mothers' own consumption from nine main food groups:32 (1) grain, tubers, roots; (2) flesh meat (beef, pork, chicken, fish, etc); (3) dairy products (milk, cheese, yogurt, etc); (4) legumes (food made from beans, peas, lentils, nuts); (5) eggs; (6) organ meat (liver, heart, kidney, etc); (7) dark green vitamin A rich leafy vegetables; (8) vitamin A rich fruits and other vitamin A vegetables and (9) other fruits. The women were asked whether they had consumed foods from the above food groups on the previous day. Responses were recorded as ‘yes’ or ‘no’. A ‘yes’ response was scored as ‘1’, and a ‘no’ response was scored as ‘0’. The scores were summed up to create the women DD score, which ranged from 0 to 9 and used in the analysis as a continuous predictor variable. SES was assessed using two factors at the individual level (maternal education and occupation) and one factor at the household level (household wealth).33 The wealth index in the DHS data set was created based on assets ownership and housing characteristics of each household: type of roofing, and flooring material, drinking water, sanitation facilities, ownership of television, bicycle and motorcycle, among others. Principal component analysis was employed to assign weights to each asset in each household. The asset scores were then summed up and individuals ranked according to the household score. The wealth index was then divided into quintiles: poorest, poorer, middle, richer and richest. However, in this analysis, the household wealth index was used as a continuous variable. The following factors were controlled for in the analysis: maternal level factors (age and parity) and household level factors (sex of household head, number of children under 5 years, presence of co-wives and number of household members). The selection of the explanatory variables was based on an extensive review of the literature. The identified variables were further subjected to bivariate analysis to establish their relationship with the outcome variable. Only variables showing statistically significant relationships were retained for further analysis. Variables that were not statistically significant in the bivariate analysis but considered biologically important were included in the multivariate analysis.
Data analysis
Estimation of QR model
QR was introduced by Koenker and Bassett34 as a location model to extend OLS which summarises the distribution at its grand mean to a more general class of linear models in which the conditional quantiles have linear form to fully account for the overall distribution of the response variable. To formalise the QR, consider a real-valued random variable Y characterised by the following distribution function: 1
1
Then for any TƬɛ(0, 1), the TƬ-th quantile of Y is defined as follows: 2
2
The most common quantiles T from equation (1) are T=0.25, T=0.50 and T=0.75 for the first, the median and the third quartile, respectively. Therefore, unlike the OLS which minimises the squared differences around the mean, QR minimises the weighted absolute difference between the observed value of y and the Tth quintile of Y. It can easily demonstrate that OLS is nested in QR.34
Analytical strategy
Analysis included descriptive, bivariate and multivariate techniques using STATA V.13. The descriptive analyses explored the characteristics of the sample. This was followed by bivariate analysis to establish the relationship between the predictor variables and the outcome variable. Only variables that were statistically significant (p<0.05) or considered critical were used in the multivariate analysis. We employed QR to conduct the multivariate analysis to capture the full distribution of the outcome. We estimated OLS regressions and QRs at the 5th, 10th, 25th, 50th, 75th and 90th quantiles. QR was chosen over linear regression because we wanted to answer an important question ‘Does the effects of dietary diversity and socioeconomic status on maternal BMI vary across the conditional distribution of the BMI (kg/m2)?’. This question cannot be addressed with linear regression, as standard linear regression techniques summarise the average relationship between a set of regressors and the outcome variable based on the conditional mean function E(y|x). This provides only a partial view of the relationship, as we might be interested in describing the relationship at different points in the conditional distribution of y. Unlike OLS, QR provides a complete view of the effect of an independent variable on the outcome variable; therefore, it is possible to identify the more vulnerable groups and devise more effective interventions. Besides, while OLS can be inefficient if the errors are highly non-normal, QR is more robust to non-normal errors and outliers.34 QR also provides a richer characterisation of the data, allowing us to consider the impact of a covariate on the entire distribution of y, not merely its conditional mean. For QR estimates, key independent variables, including maternal DD, occupation, education and household wealth index, were included in the first model. The second model included the control variables. Since we were also interested in the differences between OLS and QR estimates, results from OLS and QR were plotted in graphs to depict the levels of estimates produced by the two types of estimations.
Results
Descriptive statistics
Table 1 presents the characteristics of the sample used in the analysis. The mean DD score was higher in Ghana (4.4±1.59) and Sao Tome and Principe (4.41±1.43) than in Namibia (3.20±2.13). Also, women in Sao Tome and Principe tended to be a little heavier and bore more children on average than women in Ghana and Namibia. The household headship in Namibia was shared almost equally between men (52.7%) and women (47.3%), but was below 30% for women in Ghana and Sao Tome and Principe. In Sao Tome and Principe, a majority of the women (74.3%) had primary school education, while more than half of those in Namibia had at least a secondary school education. Regarding occupation, almost half of the women in Namibia and Sao Tome and Principe were not engaged in any form of work, while in Ghana only 10% of the women were not engaged in any form of work.
Characteristics of the samples, categorical and continuous variables
Bivariate analyses
In the bivariate analysis, DD score was significantly and positively associated with maternal BMI (kg/m2) in Ghana (t=5.82, p=0.001) and Namibia (t=7.74, p=0.001). No statistically significant association was observed in Sao Tome and Principe. SES variables such as maternal education, occupation and household wealth were significantly and positively associated with maternal BMI (kg/m2). The following covariates were also significant: maternal age and sex of household head were positively associated with maternal BMI, while presence of co-wives, number of household members and number of children under 5 years in the household were negatively associated with maternal BMI (kg/m2). Maternal parity was not significant in the bivariate analysis but was included in the multivariate analysis because it was considered a critical variable as far as its relationship with maternal health is concerned.
Multivariate analysis
Tables 2⇓–4 present the results of the multivariate QR analysis. The effect of DD score on maternal BMI (kg/m2) occurred at the 90th quantile among Ghanaian women. Thus, individuals who consumed one more unit of DD score achieved an increase of 0.245 in BMI (kg/m2) for those in the highest quantile (90th). This increase was also significantly higher than the mean effect observed in the OLS point estimate. The effect of maternal occupation (white-collar work) was significantly positive in at least two quantiles in each of the five countries. The significant positive effect of occupation (white-collar work) on maternal BMI (kg/m2) occurred at the 25th and 75th quantiles in Ghana and Namibia, respectively, while in Sao Tome and Principe the effect occurred across the four lower quantiles (5, 10, 25 and 50) but in non-linear ways. However, in Ghana, besides the positive effect of occupation (white collar), there was also a negative effect of agriculture as an occupation on maternal BMI (kg/m2) at the lowest quantile. Mothers at the lowest quantile (5th) and who were engaged in agriculture or manual jobs were found to have lower BMI (kg/m2) than those who were not engaged in any work. The effect of household wealth increased for individuals across all quantiles and in all the three countries. A unit change in the household wealth factor score was associated with an increase of 0.038, 0.052 and 0.065 units in BMI (kg/m2) for individuals in the lowest quantile (5th) in Ghana, Namibia and Sao Tome and Principe, respectively, and 0.237, 0.301 and 0.174 units increased for those in the highest quantile (90th) in Ghana, Namibia and Sao Tome, respectively. The effect of household wealth score on individuals BMI (kg/m2) in the highest quantiles across countries was greater than the mean effects obtained in the OLS regressions for each country. Education had a significant impact on maternal BMI (kg/m2) across all quantiles in Namibia and a negative effect at quantiles 5, 10 and 90 in Sao Tome. There was no significant effect across quantiles in Ghana. In Namibia, one more year of education was associated with a 0.059 unit increase in BMI (kg/m2) for those in the lowest quantile (5th) and an increase of 0.172 for those in the highest quantile (90th). The effect at the 90th quantile was higher than the OLS point estimate. For Sao Tome and Principe, one more year of education reduces maternal BMI (kg/m2) by 0.271 in the lowest quantile (5th) and 0.301 in the highest quantile (90th). Other covariates that had a significant effect on maternal BMI (kg/m2) included maternal age, parity, household size, sex of household head and marriage type.
Multivariate quantile regression analysis of the association between DD and SES, and maternal BMI (kg/m2), Ghana
Multivariate quantile regression analysis of the association between DD and SES, and maternal BMI (kg/m2), Namibia
Multivariate quantile regression analysis of the association between DD and SES, and maternal BMI (kg/m2), Sao Tome and Principe
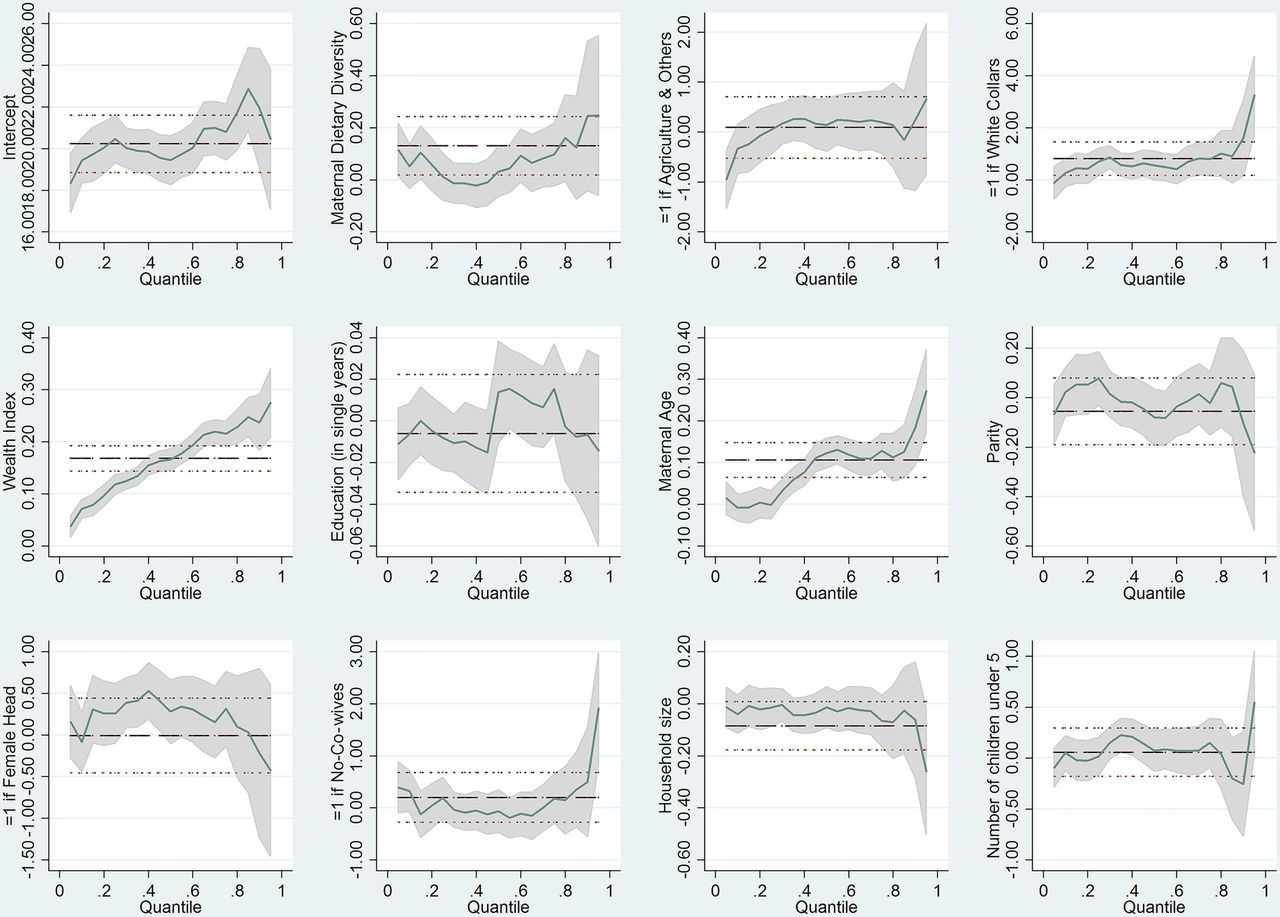
Figures 1⇓–3 are a graphical presentation of the results obtained in the QR analysis. The graphs illustrate how the effects of DD and socioeconomic variables on maternal BMI (kg/m2) vary over quantiles, and how the magnitude of the effects at various quantiles differs considerably from the OLS coefficients, even in terms of the CIs around each coefficient.

Graphical illustration of quantile regression results, Ghana.

Graphical illustration of quantile regression results, Namibia.

Graphical illustration of quantile regression results, Sao Tome and Principe.
Discussion
This paper investigates the association between DD, SES and maternal nutritional status, measured by BMI (kg/m2), in Ghana, Namibia and Sao Tome and Principe. Our main findings in relation to DD are that a high DD score is significantly and positively associated with women's nutritional status in Ghana at the 90th quantile. It seems that women with higher DD in this sample tend to have a higher BMI (kg/m2), probably because they are also more likely to consume higher amounts of calories. This does not mean that women in the 90th quantile have better nutritional status, as they are likely to be at higher risk of overweight/obesity (another form of malnutrition). The results are only an indication that women in the uppermost end of the BMI distribution are likely to benefit more from improvement in DD than those in the lower end of the distribution. As to whether these benefits will have a causal effect on actual improvement in nutritional status is beyond the scope of this study. However, the OLS estimates show that, on average, DD has a positive effect on the nutritional status of all women in the sample. This is somewhat misleading. In effect, OLS does not give a complete picture of the effect of DD on maternal nutritional status. By using a QR, we are able to show that DD is associated importantly with the nutritional status of only those women in the highest quantile. Nevertheless, the analysis of the samples from Namibia and Sao Tome and Principe did not reach statistical significance, suggesting that the effect of DD on maternal nutritional status may be context specific. The findings in this paper are consistent with those in previous studies. For example, studies in Burkina Faso revealed a strong positive association between DD and maternal nutritional status.10 ,11 ,13 The limitation of these studies is the employment of OLS, which only gives the mean effect of DD on maternal nutritional status. This does not paint a comprehensive picture about whom DD affects most. In a related study, it was established that DD has no effect on women's anthropometric status.14 The authors concluded that a qualitative measurement of DD is not sufficient to identify women at risk of nutritional deficiencies. This supports the findings obtained in Namibia and Sao Tome and Principe in this study.
In our analysis, we also found that women's occupation has a significant effect on maternal nutritional outcomes. In Ghana and Namibia, women who are engaged in white-collar jobs have a higher BMI (kg/m2) in the 25th and 75th quantiles compared with those who are not engaged in any work. This is not unexpected because white-collar workers are likely to be well educated and therefore earn decent incomes. Indeed, the positive relationship between income and health has long been established.35 These findings are in line with related studies in the literature. In Ethiopia, women who are in paid employment were found to have improved nutritional status than those who were unemployed.15 The authors concluded that women who are employed earn an additional income which they could use to purchase nutritious foods for the household, the consequent effect of which is improvement in nutritional status of the household and the individual women for that matter. It is worth noting that whether income will have an effect on women's nutritional status depends to some extent on the individual who earns the income and the type of income earned.17 Contrariwise, in Ghana, being an agricultural worker has a negative effect on the nutritional status of women at the lowest quantile (5th). Thus, women who are engaged in agricultural work have a lower/reduced BMI (kg/m2) compared with those who are not doing any work. This may be explained by the fact that agriculture is an energy intensive exercise and thus may have taken its toll on women engaged in this type of occupation. Earlier studies have shown the negative effect of time devoted to work and intensity of work on women's nutritional status.4
Related to maternal occupation is the association between women's education, another important marker of SES and maternal nutritional status. Our analysis of the Namibian sample shows that an improvement in women's education has a significant positive effect on maternal nutritional status across all groups (quantiles), with the largest effect on those with a high BMI (kg/m2). The across groups (quantiles) effects of women education show the critical role education plays in maternal nutritional outcomes. This may suggest that interventions in Namibia to improve maternal nutritional status should take into account the education of women. Contrariwise, education is inversely related to maternal BMI (kg/m2) in Sao Tome and Principe for the first two groups (5th and 10th quantiles) and the last group (90th quantile). These findings are puzzling, considering the fact that a majority of women in this sample as per the descriptive analysis have at least primary education, and considering that minimum education is found to have a positive effect on maternal health,15 one would have expected that education would have a positive effect on maternal nutrition outcomes in this sample. Further investigations will be needed to unravel these unexplained findings. Relating the results obtained in this study to previous studies, one can observe some similarities. Previous studies on maternal nutritional status in sub-Saharan Africa demonstrate clearly the significant positive effects of women's education on maternal nutritional status.16 ,36 ,37 Women with education tend to have better nutritional status compared with those with no education. Similar findings were observed in Ethiopia and Bangladesh.21 ,38 ,39 Some of the important arguments about the positive effects of education are based on the fact that education empowers women to be able to make independent decisions on the use of available resources to improve their nutritional status as well as that of the household.4 ,15 It thus follows that the effect of education is mediated to some extent by the knowledge, empowerment and awareness it gives to women.
Another important finding of this paper is the relationship between household wealth, an indicator of household SES, and maternal nutritional status. The results of our study show that household wealth is significantly and positively related to maternal nutritional status across all quantiles and in all the three countries. Improvement in household wealth is associated with positive effect on maternal nutritional status but in a graded manner. Thus, the effect of household wealth index increased as moving from the lowest to the highest quintiles. This is not surprising because there is substantial evidence from low and middle income countries that point to a positive correlation between household wealth and the weight of individual household members, especially women.40–42 Thus, the more affluent the household is, the more likely it is that its members, especially women, will be overweight. Relating the findings in this paper to others reported in the literature, one can observe some consistencies. In Ethiopia, women who lived in households ranked in the medium to higher wealth index were found to have better nutritional status compared with those in poorer households.15 ,20 Several other studies conducted in similar settings have shown the strong positive relationship between household SES and maternal nutritional status.21 ,22 ,24 ,25 This may be an indication that household economic status is positively associated with household food security,23 which is a prerequisite for access to adequate dietary intake and improved nutritional status for all members of the household. This may suggest that interventions aimed at improving household SES may have a positive effect on women's nutritional status.
Strengths and limitations
An important strength of this study is the use of large nationally representative samples, thereby providing more robust estimates of observed associations. Second, the outcome variable (BMI) for the analysis was objectively measured, reducing possible misclassification. The use of QR in the analysis is also an important methodological contribution of the paper as previous research mostly relied on OLS. This enables us to get a complete picture of the effects of DD and SES on maternal nutritional status, which OLS is insufficient to do.
There are also limitations associated with the study. One such limitation has to do with the fact that the data used for this study are from cross-sectional surveys; therefore, the analyses have not been able to disentangle potential reciprocal causations. The conclusions in this paper are therefore carefully restricted to statements about the associations between the predictor variables and the outcome variable. Another limitation is related to the DD score used in the analysis. The key weakness of this method is that the individual may not be able to report their food consumption accurately due to cognitive challenges such as lack of knowledge, forgetfulness and interview situations.43 There is evidence that the 24-hour recall tends to underestimate food intake by about 10% relative to observed intake;44 however, these cognitive challenges can be overcome by the use of probes by the interviewer, which has been well established as an effective means to recover foods that the respondent has not reported.43 The DHS, like any other surveys, has made probes an integral part of their interviewing protocols. Therefore, the DHS data collectors might have addressed any cognitive challenges of respondents during the data collection processes. Another limitation is that QR in its current form and implementation in STATA does not incorporate the complex survey design of DHS. To address this shortcoming, we bootstrapped our estimates to ensure that appropriate inference is done. In this regard, we used 1000 replications to obtain SEs and CIs.
Conclusions
The research question was ‘Does the effects of dietary diversity and socioeconomic status on maternal BMI vary across the conditional distribution of the BMI (kg/m2)?’. Methodologically, QR is more appropriate to answer the research question. The paper concludes that DD and SES factors are associated with maternal BMI (kg/m2) differently. DD is only positively associated with BMI of women in the highest BMI (kg/m2) group in Ghana. In all the three countries, household wealth was positively associated with women in the medium to high BMI (kg/m2) groups more than those in the lower BMI (kg/m2) categories. Women's education shows a positive gradient effect on maternal BMI in Namibia, while showing a negative effect on women in the two lowest BMI (kg/m2) groups (5th and 10th quantiles) and the highest BMI (kg/m2) group (90th quantile) in Sao Tome and Principe. In Ghana and Namibia, women working in white-collar jobs had a higher BMI (kg/m2) at the 25th and 75th quantiles compared with those who were not engaged in any work. Thus, there is much heterogeneity in the effects of DD and SES on maternal nutritional outcomes, which is not highlighted by OLS estimations. The foregoing submissions highlight that only considering the conditional mean (OLS) of the entire distribution can yield misleading results. In fact, the paper showed that the effect of DD and SES factors differ depending on the BMI (kg/m2) level in the samples. Therefore, studies in the maternal nutrition arena should examine patterns of effects across the entire distribution and not just the average effect. Programmatically, policy interventions to address maternal nutrition need to be sensitive to this reality.
Acknowledgments
The authors wish to express their profound gratitude to the DHS Program, USA, for providing them access to the data. They also wish to acknowledge institutions of respective countries that played critical roles in the data collection process.
References
Footnotes
Twitter Follow Zacharie Dimbuene at @ztsala
Contributors DAA conceived and designed the study. DAA and ZTD conducted the data analysis, interpreted the results and drafted the manuscript. PB, EWK-M, TNH and BM contributed to the study design, data analysis, interpretation and critical revision of the manuscript. All authors take responsibility for any issues that might arise from the publication of this manuscript.
Funding This research received no specific grant from any funding agency in the public, commercial or not-for-profit sectors.
Competing interests None declared.
Provenance and peer review Not commissioned; externally peer reviewed.
Data sharing statement This study was a reanalysis of existing data that are publicly available from the Demographic and Health Survey (DHS) Program at http://dhsprogram.com/publications/publication-fr221-dhs-final-reports.cfm. Data are accessible free of charge on registration with the DHS Program. The registration is done on the DHS website indicated above.