Article Text

Abstract
Objectives We sought to develop prognostic risk scores for compensation-related stress and long-term disability using markers collected within 3 months of a serious injury.
Design Cohort study. Predictors were collected at baseline and at 3 months postinjury. Outcome data were collected at 72 months postinjury.
Setting Hospitalised patients with serious injuries recruited from four major trauma hospitals in Australia.
Participants 332 participants who made claims for compensation for their injuries to a transport accident scheme or a workers’ compensation scheme.
Primary outcome measures 12-item WHO Disability Assessment Schedule and 6 items from the Claims Experience Survey.
Results Our model for long-term disability had four predictors (unemployed at the time of injury, history of a psychiatric disorder at time of injury, post-traumatic stress disorder symptom severity at 3 months and disability at 3 months). This model had good discrimination (R2=0.37) and calibration. The disability risk score had a score range of 0–180, and at a threshold of 80 had sensitivity of 56% and specificity of 86%. Our model for compensation-related stress had five predictors (intensive care unit admission, discharged to home, number of traumatic events prior to injury, depression at 3 months and not working at 3 months). This model also had good discrimination (area under the curve=0.83) and calibration. The compensation-related stress risk score had score range of 0–220 and at a threshold of 100 had sensitivity of 74% and specificity of 75%. By combining these two scoring systems, we were able to identify the subgroup of claimants at highest risk of experiencing both outcomes.
Conclusions The ability to identify at an early stage claimants at high risk of compensation-related stress and poor recovery is potentially valuable for claimants and the compensation agencies that serve them. The scoring systems we developed could be incorporated into the claims-handling processes to guide prevention-oriented interventions.
- accidents
- injuries
- disability
- stress
- mental health
This is an Open Access article distributed in accordance with the Creative Commons Attribution Non Commercial (CC BY-NC 4.0) license, which permits others to distribute, remix, adapt, build upon this work non-commercially, and license their derivative works on different terms, provided the original work is properly cited and the use is non-commercial. See: http://creativecommons.org/licenses/by-nc/4.0/
Statistics from Altmetric.com
Strengths and limitations of this study
All participants had experienced a serious injury and the outcomes were measured prospectively and over a long time period.
Objective data were collected on the nature and status of participants’ compensation claims.
We were able to identify predictors of claimant stress and disability, not explanations for these outcomes.
The cohort was recruited in 2004–2006, and our findings represent the experiences of the participants in the 6 years that followed; however, the operational processes of the particular compensation schemes involved may have changed since then.
There may be unmeasured variables that predict both outcomes, for instance, accident fault.
Introduction
Transport and work-related accidents contribute substantially to human suffering and illness.1 2 For instance, the 2010 Global Burden of Disease study1 ranked road injuries as the 10th leading cause of disability-adjusted life years, and the fifth leading cause in North America. Many countries have established injury compensation systems to provide financial and health service support for people harmed in these circumstances. Although the structure of these compensation systems varies across countries and jurisdictions, they generally share a common goal: restoring injury victims to health and returning them to work.3
Historically, much of the research exploring the health of claimants was driven by concerns that compensation systems prompt overclaiming and exaggeration of residual symptoms.4 5 More recently, attention has turned to a growing body of literature that has uncovered a more nuanced relationship between system design and claimant recovery.5–12 Aspects of the process of seeking injury compensation, such as delay, adversarialism and being subjected to multiple medicolegal assessments, may contribute to poor health outcomes among injured claimants.13–16
In a recent longitudinal study, we followed over a 6-year period a cohort of individuals who had sustained traumatic injury on the road or at work—from the time they were hospitalised for their injury through the lodgement and resolution of their claims for compensation for those injuries.17 We detected a strong association between the stressfulness of their experiences in seeking compensation and their health status 72 months after occurrence of the injury. Claimants who reported experiencing substantial stress from their interactions with the compensation process had higher levels of disability, anxiety and depression than claimants who reported relatively little or no such stress. The analyses adjusted for a variety of factors that may have influenced recovery trajectories.
An important aspect of the study’s findings, not explored in our original report, was that claimants with certain observable characteristics were at higher risk of experiencing compensation-related stress, and those characteristics appeared to moderate the relationship between compensation-related stress and recovery. Early identification of claimants who are at high risk of either or both of these outcomes would be advantageous for compensation schemes. Claimants who recover slowly consume vast resources. Claimants who are prone to stressful compensation-related experiences are troubling both because schemes have an interest in ensuring positive claims experiences and because of the established connection between compensation-related stress and poor long-term recovery.17 If it were possible to flag such ‘high risk’ subgroups of claimants at high risk of these outcomes early in the claims process, schemes could target specialised case management programmes at them.7 18 19
We re-examined the cohort of injury patients in an effort to simultaneously develop prognostic models of (1) vulnerability to stressful claims experiences and (2) long-term disability. Given the policy-oriented considerations that motivated this study, we sought to identify a parsimonious set of predictors that had the potential to be incorporated into an algorithm amenable to implementation or replication by interested compensation agencies.
Method
Background and setting
The Australian Injury Vulnerability Study (IVS) is a prospective cohort study of mental and physical health outcomes among a sample of patients hospitalised for injury in Australia. The IVS has been described in detail previously.20–22 Briefly, a cohort of 1590 people aged 16–70 years was recruited from four major trauma hospitals in three Australian states (Victoria, New South Wales, South Australia) between April 2004 and February 2006. Baseline data were collected prior to hospital discharge, and follow-up data were collected at 3, 12, 24 and 72 months after discharge.
This analysis focuses on the subsample of 332 IVS participants who made claims for compensation for their injuries to a transport accident scheme or workers’ compensation scheme. All three states from which cohort members were drawn operated both types of schemes. The general structure of these schemes is described in our previous study.17
We conducted our study in accordance with the Transparent Reporting of a multivariable prediction model for Individual Prognosis or Diagnosis guidelines for developing prediction model.23 24 Human research ethics committees at each of the participating hospitals and the University of Melbourne approved the study.
Patient and public involvement
Patients and members of the public were not directly involved in the development of the research questions, design of the study or recruitment.
Measures
Outcome variables
Participants’ disability was measured using the 12-item WHO Disability Assessment Schedule (WHODAS) II.25 We used the simple sum scoring method26 to create a scale ranging from 0 (no disability) to 48 (complete disability). Scores ≥10 indicate clinically significant disability.26
Claimants’ experience of compensation-related stress was assessed using the ‘Claims Experience Survey’, an instrument developed specifically for the compensation component of the IVS.17 (The development, content and pretesting of this instrument are described elsewhere.17) Six items in the Claims Experience Survey measured the extent to which participants found key elements of the claims experience stressful (eg, ‘Understanding what you needed to do for your claim’, ‘The amount of time the compensation organization took to deal with your claim’). Claimants were asked whether they found each of the elements stressful (yes or no) and those who responded positively indicated how stressful on a 5-point scale ranging from 1 (‘a little stressful’) to 5 (‘extremely stressful’). For each item, we distinguished between claimants who experienced ‘no or low stress’ (negative response to the stressor question or positive response followed by a scores of 1 or 2) and those with ‘high stress’ (positive response followed by a score of 3–5). To combine responses to these six questions into a single measure of compensation-related stress, we created a composite dichotomous variable in which claimants who reported high stress in relation to three or more elements were classified as having had a ‘highly stressful’ claims experience and the rest were classified as having experienced relatively low or no stress.
Predictor variables
The IVS collected a wide array of information on participants, at baseline and in the four follow-up time points (see online supplementary appendix). Because our focus in this analysis was identification of early-stage markers of compensation-related stress or disability, we restricted candidate predictors to measures collected at baseline or in the 3-month follow-up. Variables included in our final models are described below. Variables, including those considered but not selected, are described in more detail in the online supplementary appendix.
Supplementary file 1
Baseline measures
During the period of hospitalisation following the injury, IVS investigators collected information on each participant’s demographic characteristics, injury severity and psychiatric history. Demographic data included age, sex, education and marital status, as well as information on the patient’s preinjury employment status and weekly income. Characteristics of the injury included an indicator variable for admission to an intensive care unit (ICU), the Injury Severity Score (ISS)27 and whether the patient was discharged to an inpatient rehabilitation facility. Preinjury psychiatric history was assessed using the Mini International Neuropsychiatric Interview (version 5.5).28 This instrument assesses lifetime history of a major depressive episode, post-traumatic stress disorder (PTSD), social phobia, panic disorder, generalised anxiety disorder and substance use disorders. From these measures, we created an indicator variable representing lifetime history of a psychiatric disorder.
The IVS investigators also administered the trauma history inventory from the PTSD module of the Composite International Diagnostic Interview.29 This instrument screens for 11 traumatic life events, including combat, life-threatening injury, natural disaster, witnessing injury or death, rape, sexual molestation, physical assault, childhood neglect or abuse, being threatened with a weapon, great shock because of events occurring to others and other traumatic events. We combined participants’ responses to create a variable indicating number of prior traumatic events.
Three-month measures
In the first follow-up, IVS investigators gathered data on participants’ work status, PTSD symptom severity, depression symptom severity and disability status. PTSD symptom severity was assessed using the Clinician-Administered PTSD Scale.30 Scores on this structured clinical interview range from 0 (no PTSD symptom severity) to 136 (high PTSD symptom severity). The severity of symptoms of depression was assessed using the Hospital Anxiety and Depression Scale (HADS), which scores depression and anxiety, respectively, on scales ranging from 0 to 21 with higher scores indicating higher severity.31 32 As at baseline, disability was assessed using the WHODAS II.
Statistical analysis
Sample size calculations
We did not calculate formal sample sizes for this study because all available data were used to maximise the power and generalisability of results.
Model development
Our objective was to determine which combination of baseline and 3-month variables best predicted the two outcomes of interest: (1) compensation-related stress experienced during the course of the claims process; and (2) level of disability at 72 months. We used logistic regression to model compensation-related stress and linear regression to model disability. We considered non-linear associations between continuous variables and each outcome using fractional polynomials.33 We also explored potential interactions between predictors. All models were conducted on a complete case basis.
Our final models included only those variables that had significant associations (p<0.05) with the outcome. To create a risk scoring system, we assigned a specified number of points to each predictor (indexed directly to the size of the predictor’s coefficient in the model) and summed the points across predictors for each participant to produce an overall risk score (see the online supplementary appendix for further details). We use nomograms34 to present this information graphically.
Model validation and calibration
We used bootstrapping methods to cross-validate the models.35 Specifically, for each model, we sampled 200 observations with replacement and calculated measures of model discrimination. For the logistic regression model, discrimination was assessed using the area under the curve (AUC). For the linear regression model, discrimination was assessed using the R2 statistic. We calculated a mean value for each of these discrimination statistics across the bootstrap samples and deducted this value (referred to as ‘optimism’) from the relevant measure of model discrimination for the whole sample. This adjusted estimate, referred to as ‘discrimination adjusted for optimism’, addresses the risk of model overfitting.34 35 To address risks of overfitting bias, we assessed model calibration (how closely predicted scores reflected actual scores), again using bootstrapping approach with 200 resamples.
Accuracy statistics
Decisions regarding which levels on a risk scoring system should be chosen as trigger points for interventions inevitably involve trade-offs between sensitivity and specificity,36 as well as consideration of the cost, efficacy and intrusiveness of the intervention at hand. In other words, these decisions summon value judgements that may be informed—but not completely determined—by diagnostic statistics. With this reality in mind, we elected to present diagnostic statistics across a range of values for both risk scores.
Results
Characteristics of study sample
A total of 409 IVS participants who were interviewed 72 months after their injury lodged claims for compensation with transport accident schemes (257 claimants), workers’ compensation schemes (82 claimants), commercial insurers covering personal accident or income protection (41 claimants), crime victim compensation funds (21 claimants), public liability insurers (6 claimants) and unknown entities (2 claimants). This analysis focuses on the 332 claimants (81% of all interviewed claimants) who pursued transport accident or workers’ compensation claims and completed the Claims Experience Survey.
Descriptive statistics for the study sample are provided in table 1. Participants were predominately male (71%) and the vast majority working prior to their injury (94%). The mean ISS score was 12.1, indicating a moderate level of injury severity. At 72 months postinjury, 87% of participants’ claims for compensation had been resolved (excluding residual claims for health and medical costs, which are available as ongoing benefit in some schemes).
Characteristics of the sample, n=332
Model development
Compensation-related stress
The best fitting logistic regression model estimating participants’ level of compensation-related stress at 72 months consisted of five variables: ICU admission for treatment, being discharged to home (as opposed to an inpatient rehabilitation service), number of traumatic events prior to the injury, HADS depression score at 3 months and not working at 3 months (table 2, upper section). The model showed good discrimination. After adjustment for optimism, the AUC was 0.83 (95% CI 0.76 to 0.91), and the predicted probabilities of claimants’ compensation-related stress were well calibrated with the actual probabilities (see online supplementary appendix, figure A1: panel A).
Best fitting regression models predicting compensation-related stress and disability at 6 years
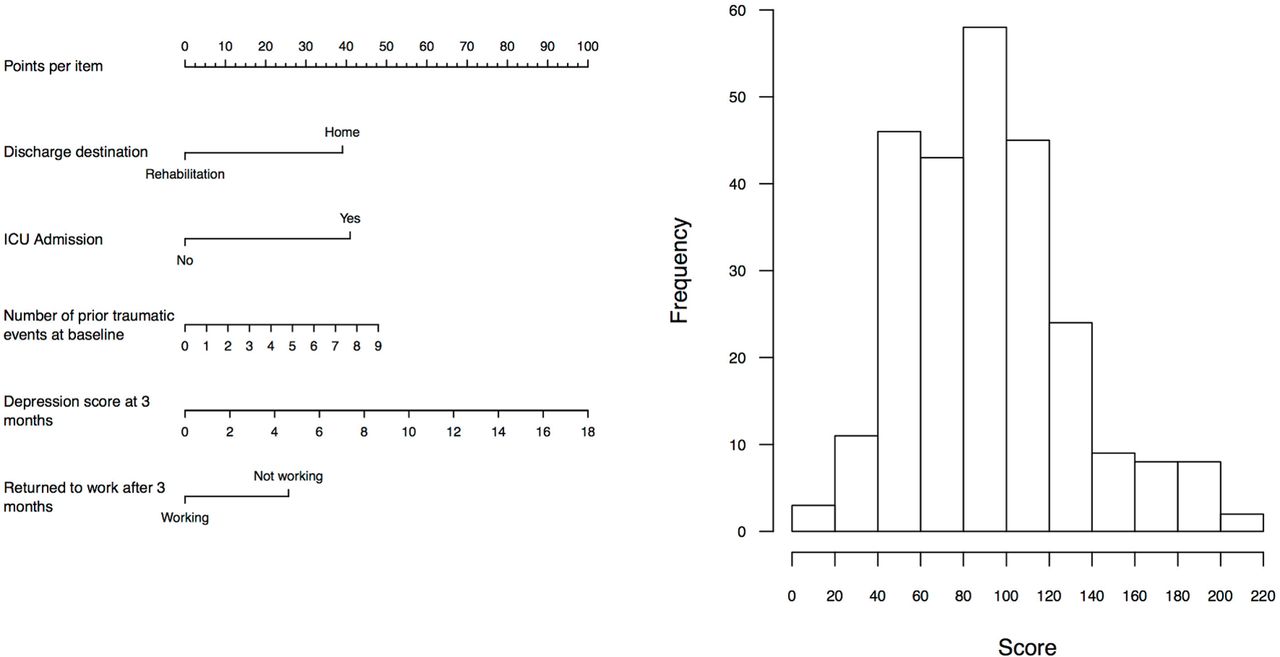
Figure 1A shows, on a common scale, the number of ‘points’ assigned to the five selected predictors in the model estimating odds of experiencing compensation-related stress. (Each predictor’s point count is indexed directly to the size of its coefficient in the multivariable model.) The sum of these points across all five predictors constitutes a participant’s ‘compensation-related stress risk score’. The range of possible scores runs from 0 to 220, with higher scores corresponding to greater risk of experiencing compensation-related stress during the course of the claims process. Figure 1B shows the distribution of the risk score, with scoring being approximately normally distributed with even numbers of claimants to the right and left of the mean.

(A) Points assigned per item and (B) distribution of compensation-related stress risk score. ICU, intensive care unit.
Disability
The best fitting linear regression model estimating participants’ level of disability at 72 months consisted of four independent variables: unemployed at time of injury, history of a psychiatric disorder, PTSD symptom severity at 3 months and disability level at 3 months (table 2, lower section). Notably, injury severity was considered but was not in the strongest set of predictors. After adjustment for optimism, the R2 was 0.37 (95% CI 0.27 to 0.47) and the model displayed good calibration (online supplementary appendix, figure A1: panel B).
Figure 2A shows the number of points assigned to the four predictors selected in the model predicting disability. The sum of these points across all four predictors constitutes a participant’s ‘disability risk score’. Disability risk scores range from 0 to 180, with higher scores indicating a higher predicted level of disability at 72 months. Figure 2B shows the distribution of risk score. The distribution is right skewed, with the majority of claimants having low scores and a small number of claimants having high scores.

(A) Points assigned per item and (B) distribution of disability risk score. PTSD, post-traumatic stress disorder.
Accuracy and diagnostic statistics
Table 3 reports the sensitivity, specificity, and positive and negative predictive values that apply at eight different levels of the compensation-related stress score and the disability risk score. Which thresholds are optimal for use in guiding interventions to prevent stress or disability among claimants? The answer to this question is not straightforward, as noted above, because of the trade-offs involved.
Sensitivity, specificity and positive predictive values of compensation-related stress and disability risk scores
For the compensation-related stress risk score, for example, the score’s sensitivity is extremely high (97%) at a score of 60 out of a possible 220 points, meaning virtually all claimants who experienced compensation-related stress are identified using a threshold of 60 or above. However, specificity is low (30%), meaning that the proportion of claimants correctly identified as not experiencing compensation-related stress is low. In other words, a threshold of 60 would produce few false negatives (3%) but many false positives (70%). That trade-off may be appropriate for some types of interventions (eg, those that are low cost and non-intrusive). By contrast, for an intervention in which both false negatives and false positives were problematic, a threshold of 100 may be more appropriate. It has reasonable sensitivity (74%) and specificity (75%), and 50% of the claimants who scored at or above this level could be expected to go on to experience compensation-related stress (positive predictive value).
For the disability risk score, the trade-offs are similar, although slightly more pronounced. For example, a threshold of 60 points has moderately high sensitivity (80%) and moderate specificity (69%) for detecting claimants who will have relatively high disability levels in the long term (WHODAS score ≥10), whereas a threshold of 80 substantially boosts specificity (86%), but at the expense of sensitivity (56%), and 62% of claimants who scored at or above this level could be expected to have serious disability 72 months after injury.
Combining predictors of compensation-related stress and disability
Compensation-related stress and long-term disability are both important outcomes for compensation agencies. Although the former predicts the latter, they are separate and only partially correlated measures (r=0.48, 95% CI 0.39 to 0.57). Thus, in addition to trade-offs between sensitivity and specificity, agencies interested in targeting claimants at risk of both outcomes will face trade-offs along an additional dimension.
Figure 3 shows the compensation-related stress risk scores for each claimant in our sample plotted against each claimant’s disability risk scores. The two panels present identical scatter plots that show a strong positive association between the two outcomes (r=0.64, 95% CI 0.54 to 0.71). The difference between panels A and B relates to the choice of risk score thresholds, which are depicted as dashed vertical and horizontal lines.

Risk of experiencing compensation-related stress and disability at (A) threshold of 100 (Compensation-related Stress Score) and 80 (Disability Risk Score) and (B) threshold of 60 (Compensation-related Stress Score) and 60 (Disability Risk Score). NE, north-east; NW, north-west; SE, south-east; SW, south-west.
In figure 3A, the dashed lines delineate scores of 100 (out of a possible 220 points) for the compensation-related stress and 80 (out of a possible 180 points) for the disability risk score. The thresholds create four distinct quadrants: (1) claimants who are likely to have heightened disability at 6 years and are also likely to experience compensation-related stress (north-east quadrant); (2) claimants who are likely to have heightened disability at 6 years but are not likely to experience compensation-related stress (south-east quadrant); (3) claimants who are unlikely to have heightened disability at 6 years but are likely to experience compensation-related stress (north-west quadrant); and (4) claimants who are unlikely to have heightened disability at 6 years or experience compensation-related stress (south-west quadrant).
For an agency that valued preventing both outcomes but had limited resources to invest in early interventions to prevent them, claimants in the north-east quadrant (17% of the sample) would naturally assume first priority, while claimants in the south-west quadrant (53% of the sample) would have lowest priority. How claimants in the north-west quadrant (21%) were weighed against those in south-east quadrant (9%) would depend on the agency’s preferences about the relative importance of these two outcomes.
Figure 3B shows a reconstitution of the quadrants that is the result of lowering the thresholds on both risk scores to 60. (As noted earlier, such lower thresholds might be preferred for an intervention where it is appropriate to trade of a degree of specificity to achieve higher sensitivity.) Other combinations of thresholds for the two outcomes will reconstitute the quadrants in a similar way.
Discussion
This study used data collected within the 3 months of serious road and work injuries to identify compensation claimants likely to experience compensation-related stress and/or disability at 72 months. We identified sets of predictors that were strongly and significantly associated with these outcomes. Scoring systems based on these predictors performed reasonably well on standard measures of discrimination and calibration. Like most predictive algorithms, however, their ability to accurately and completely flag at-risk individuals is highly dependent on the cut-off points selected, and there are trade-offs between rates of false positives and false negatives.
In a previous longitudinal analysis of the same sample, we found that claimants who experienced compensation-related stress were at increased risk of disability, depression and anxiety 6 years after their injury, and had poorer quality of life compared with those who did not report experiencing compensation-related stress. In another study, we found that, for some claimants, early symptoms of post-traumatic stress and depression contribute to an increased risk of experiencing compensation-related stress.37 The current study attempts to draw on these insights but take the additional step of demonstrating how predictive analytics may be harnessed to support the work of compensation schemes.
Claimants who have slow recovery and long-term disability—colloquially known in the casualty insurance industry as the ‘long tail’—are a perennial concern for injury compensation schemes. The stressfulness of the claiming process should be a concern too, both because the quality of the claimant’s experience in seeking compensation is a valuable endpoint in its own right and because of the emerging evidence that stressful claims experiences are an important risk factor for poor recovery.5 17 37 The scoring systems we developed to aid early identification of claimants at risk of these two outcomes could be implemented separately. But because the measures are both correlated and independently of interest, we expect that some schemes may see advantage in considering them together, in a manner similar to how other cousin measures are combined. We demonstrated a quadrant-based approach for interpreting the risk scores in tandem to identify claimants for intervention.
To the question of how sensitive and specific the risk scores are likely to be in identifying high-risk claimants, there is no simple answer. At lower scores sensitivity is high while specificity is low; at higher scores sensitivity is low while specificity is high. Thus, appropriate cut-points for determining target groups of claimants cannot be determined solely by reference to diagnostic statistics. A range of other factors also matter; the nature, intrusiveness and cost of the intervention are weighty considerations, as are the financial, technical and human resources available for implementation.
A screening tool based on predictive modelling will be of little value to claimants and schemes unless it can be linked to and used to guide effective action. We have been vague throughout about what, if any, specific interventions are available to bring to bear on claimants flagged as being at high risk of encountering compensation-related stress and/or poor recovery. A full consideration of possible interventions is beyond the scope of this study, but we note that several evidence-based interventions exist that may be effective in the at-risk population of interest.
For example, stepped care and collaborative care approaches have proved efficacious for injury patients.38 39 Early psychological interventions have been shown to be effective in treating post-traumatic stress and depression—conditions that predicted both outcomes in our analysis.40 41 A multifaceted approach to improving claims management practices (including enhanced communication) has been linked to slightly better outcomes among transport accident claimants.7 With respect to disability, intensive case management—including semistructured interviews to assess psychosocial needs and physical work characteristics, and workplace visits by case managers and occupation therapists—has shown promise as a cost-effective intervention for returning claimants to work.19 Of course, none of these interventions depend on the existence of a risk-based screening programme for their implementation. But an evidence-based screening programme may boost their attractiveness persuading schemes that they may be implemented cost-effectively.
Besides linkage with feasible and effective interventions, successful implementation of a risk-based screening programme requires organisational level commitment. An implementation plan should include an assessment of organisational readiness (eg, are necessary policies and procedures developed and in place), identification and engagement of internal and external stakeholders (eg, case managers who will actually assess claimants and compute risk scores), an assessment of what ongoing support will be required (eg, case manager training and supervision) and, ideally, a plan for monitoring and rigorously evaluating the performance of the screening programme.
Strengths and limitations
This study has a number of strengths. We did not rely on vignettes or hypothetical responses to gauge stressors; all participants had experienced a serious injury and experienced pursuit of compensation for their injury. The outcome measures of interest were collected prospectively over a long time frame. We also had reliable data on the nature and status of their compensation claims.
The study also has several limitations. First, the analysis is designed to identify predictors of claimant stress and disability, but it does not point directly to explanations for these outcomes. This is a reasonable approach when the goal is to identify a set of variables that reliably predict the outcome, but is less helpful for explaining causality. Relatedly, the approach is not designed to spotlight effective interventions, which specific risk factor interventions should target and whether the interventions will work. For instance, the fact that discharge to the home was identified as a strong predictor of compensation-related stress should not be interpreted as an indication that avoiding discharge to the home will help reduce compensation-related stress. Several of the predictors in our final models are clearly markers of risk, not causal factors. A different type of study would be needed to identify causal factors and inform the design of effective interventions.
Second, the IVS cohort was recruited in 2004–2006 and our results represent the experiences of the participants in the 6 years that followed. The schemes that interacted with the claimants we studied may have changed their operational processes since then in ways that reduce some sources of claimant stress. Third, because the IVS cohort was recruited from patients with injuries serious enough to warrant hospital admission, the findings may not be generalisable to less severely injured claimants.
Third, there may be unmeasured variables that predict either or both outcomes. One example is accident fault: claimants who were injured in a collision caused by the fault of another driver may have worse health outcomes than those claimants who caused the collision in which they were injured.42 Further research should consider the predictive value of such omitted and potentially important predictors.
Finally, although the sample had good follow-up at 3 months (79%–86% depending on the variable) those with high levels of depression or PTSD symptoms at baseline were more likely to drop out of the study at 3 months (PTSD symptoms p<0.001; depression p<0.01). This may have influenced the ability of these variables to predict 72-month outcomes.
Conclusions
Techniques for identifying at an early stage claimants who are at high risk of both compensation-related stress and slow recovery offer considerable promise—both for claimants and the compensation agencies that serve them. This approach has the potential to contribute to improved claimant outcomes in compensation and insurance settings by enabling compensation schemes, insurers and claims management personnel to direct resources at the claimants most in need of support.
References
Footnotes
Contributors MJS had full access to all of the data in the study and takes responsibility for the integrity of the data and the accuracy of the data analysis. Study concept and design: MJS, GG, DMS. Acquisition of data: MOD, GG, ACMF, DMS. Analysis and interpretation of the data: MJS, DMS. Drafting of the manuscript: MJS, DMS. Critical revision of the manuscript for important intellectual content: all authors. Statistical analysis: MJS. Obtaining funding: GG, MOD, DMS, ACMF.
Funding This work was supported by the Transport Accident Commission and WorkSafe Victoria via the Institute for Safety, Compensation and Recovery Research, Melbourne, Victoria, and by a National Health and Medical Research Council Program Grant (1073041).
Disclaimer The sponsors reviewed the manuscript but had no role in the design and conduct of the study; collection, management, analysis and interpretation of the data; preparation or approval of the manuscript; and decision to submit the manuscript for publication.
Competing interests None declared.
Patient consent Not required.
Ethics approval Human Ethics Sub Committee, The University of Melbourne.
Provenance and peer review Not commissioned; externally peer reviewed.
Data sharing statement No additional data available.