Article Text

Abstract
Objectives To describe the epidemiology and concordance of bone health in a population-based sample of Australian parent-child dyads at child age 11–12 years.
Design Population-based cross-sectional study (the Child Health CheckPoint) nested between waves 6 and 7 of the Longitudinal Study of Australian Children (LSAC).
Setting Assessment centres in seven cities around Australia, February 2015–March 2016.
Participants: of all participating CheckPoint families (n=1874), bone data were available for 1222 dyads (1271 children, 50% girls; 1250 parents, 86% mothers).
Outcome measures Peripheral quantitative CT (pQCT) of the non-dominant leg scanned at the 4% (distal) and 66% (mid-calf) tibial sites. Stratec XCT 2000 software generated estimates of bone density, geometry and polar stress-strain index.
Parent-child concordance were assessed using Pearson’s correlation coefficients and multivariable linear regression models. Percentiles were determined using survey weights. Survey weights and methods accounted for LSAC’s complex sampling, stratification and clustering within postcodes.
Results Concordances were greater for the geometric pQCT parameters (periosteal circumference 0.38, 95% CI 0.33 to 0.43; endosteal circumference 0.42, 95% CI 0.37 to 0.47; total cross-sectional area 0.37, 95% CI 0.32 to 0.42) than density (cortical density 0.25, 95% CI 0.19 to 0.30). Mother-child and father-child values were similar. Relationships attenuated only slightly on adjustment for age, sex and body mass index. Percentiles and concordance are presented for the whole sample and by sex.
Conclusions There is strong parent-child concordance in bone geometry and, to a lesser extent, density even before the period of peak adolescent bone deposition. This geometrical concordance suggests that future intergenerational bone studies could consider using pQCT rather than the more commonly used dual X-ray absorptiometry (DXA).
- bone health
- Peripheral Quantitative Computer Tomography (pqct)
- reference values
- children patterns
- epidemiologic studies
This is an open access article distributed in accordance with the Creative Commons Attribution Non Commercial (CC BY-NC 4.0) license, which permits others to distribute, remix, adapt, build upon this work non-commercially, and license their derivative works on different terms, provided the original work is properly cited, appropriate credit is given, any changes made indicated, and the use is non-commercial. See: http://creativecommons.org/licenses/by-nc/4.0/.
Statistics from Altmetric.com
- bone health
- Peripheral Quantitative Computer Tomography (pqct)
- reference values
- children patterns
- epidemiologic studies
Strengths and limitations of this study
Peripheral quantitative CT gives geometric parameters as well as volumetric bone density that is not affected by bone size, making comparison of bone parameters between different age groups more meaningful.
This study reports precise distributions for geometric skeletal parameters in children aged 11–12 years, which were previously lacking.
It is the largest population-based study to investigate parent-child concordance of bone density and geometry measurements.
Most of the participating parents were mothers, resulting in less precise descriptive and concordance estimates for fathers.
Introduction
Globally, more than half of adults over the age of 50 years are estimated to have osteoporosis or osteopenia,1 with high resulting economic and societal burden.1–3 However, skeletal health in later life is a product of two major factors—the peak bone mass established in childhood,4–6 and the subsequent rate of inevitable bone loss during mid-life.3 7 8 Thus, shifting the focus from older adults to identify poor bone health in childhood and mid-life could help optimise risk stratification before disease is overt.1 9
Implicit in understanding ‘poor’ bone health at these younger ages is knowledge of the epidemiology of ‘normal’ bone health at the population level. Bone health is usually reported as areal bone mineral density (BMD) measured by dual X-ray absorptiometry (DXA). In children, unfortunately, DXA is influenced by the cross-sectional size of the bone with BMD overestimated for larger bones.10 DXA is currently the only bone health measure used clinically in children, and despite having robust reference data, there is still a lack of clear understanding about the spread of data in otherwise healthy children, with no clear cut-off points to delineate healthy state from disease.11–14 Data for healthy mid-life adults are also scant, with most epidemiological studies limited to the elderly or groups with well-known risk factors such as postmenopausal women. Limited Australian studies suggest, however, that mid-life Australians have similar bone health to comparable populations with a prevalence of osteoporosis of 0.9%–2.9% in adults aged 40–44 years.15 16
Peripheral quantitative CT (pQCT) gives detailed information not only on bone density, but bone geometry, size and strength, which some suggest may better predict skeletal fragility than bone density alone.17–19 In addition, pQCT has minimal radiation, is quick and can be used at all ages.20–22 Unlike DXA, pQCT differentiates between cortical (outer shell) and trabecular (inner spongy) bone, which are affected differently by physiological life changes.10 A concerning issue with DXA is the ‘two-component limitation’ such that true BMD is invariably overestimated or under estimated as there are always more than two tissue components within an analysed area.23However, population-based and age-based reference data are needed to define osteoporosis using pQCT.24 The importance of robust reference data can be inferred from small existing reference populations such as a white American convenience sample of 416 children aged 5-18 years with tibial pQCT parameters, where older children had larger, thicker cortical bones than younger children within the same height interval.25 In adults, cross-sectional data from the Italian InCHIANTI ageing study of just over 1000 participants aged from their 20s to their 80s indicated a linear trend of decline in trabecular BMD, starting in early adulthood in both men (−0.94+0.11 mg/cm3 per year) and women (−1.23+0.09 mg/cm3 per year).23
Genetics may account for as much as 80% of an individual’s peak bone density, such that osteoporosis often clusters in families.26–30 Heritability and intergenerational concordance studies have mainly used DXA.26–29 For example, 291 Australian mother-child pairs (premenopausal and prepubertal, respectively) showed correlations of 0.12–0.40 for bone density using DXA.26 However, only a handful of small studies have explored heritability using tibial pQCT.31 In adults in eight Afro-Caribbean families, genetic effects accounted for 42% of the variation in cortical BMD at the mid-shaft and 69% of the variation in trabecular BMD at the distal tibia. In 55 Finish girl-mother-grandmother trios,32 bone mineral content differences between girl-mother pairs was less irregular than between girls and unrelated premenopausal women and woman-grandmother pairs. The authors suggested that this supported a stronger genetic influence in bone accrual than bone loss.
The Child Health CheckPoint, nested within Growing Up in Australia (also known as the Longitudinal Study of Australian Children (LSAC)), offered an opportunity to collect population-based pQCT data on the bone health of Australian parent-child dyads measured on the same day and using the same protocols. We aimed to (1) describe skeletal characteristics such as volumetric density, geometry and strength in children aged 11–12 years and their parents and (2) investigate parent-child concordance in these same measures.
Methods
Study design and participants
Details of the initial LSAC study design and recruitment are outlined elsewhere.33 34 Briefly, in 2004 LSAC recruited the nationally representative B cohort of 5107 infants (57.2% eligible) using a two-stage random sampling design with postcode as the primary sampling unit. Additional data collection waves occurred every 2 years thereafter. A total of 73.7% (n=3764) were retained to LSAC wave 6 in 2014, when 3513 families consented to their contact details being shared with the CheckPoint team. In 2015, these families were sent an information pack via post followed by an information and recruitment phone call. The CheckPoint’s detailed cross-sectional biophysical assessment, nested between LSAC waves 6 and 7 at child age 11–12 years, took place between February 2015 and March 2016; 1874 families participated. A more detailed description of the CheckPoint study design is available elsewhere.35 36
Consent
The attending parents/caregivers provided written informed consent for themselves and their children to participate in the study.
Procedures
pQCT scans, anthropometry and pubertal status were collected during each participant’s 3.5-hour visit to the CheckPoint assessment centre in one of seven large cities (mainly state capitals) around Australia. During this visit, each child and parent rotated sequentially through a number of 15 min assessment stations, including the ‘Bone Zone’ station comprising pQCT imaging of the leg, facial photography and receptive vocabulary.35 Parent-child dyads attended Bone Zone together, where first the parent and then the child underwent a pQCT scan. The pQCT machine was difficult to transport and required site-specific radiation licensing, so that the 518 CheckPoint families who attended regional centres or home visits were not scanned (figure 1). Participants were not scanned if they had any radiological procedure within the preceding 5 days, or if they refused. Six pregnant women chose not be scanned. Participants were included in these analyses if they provided at least one useable bone health metric (see below). Nine non-biological parents were also excluded from the concordance analyses.
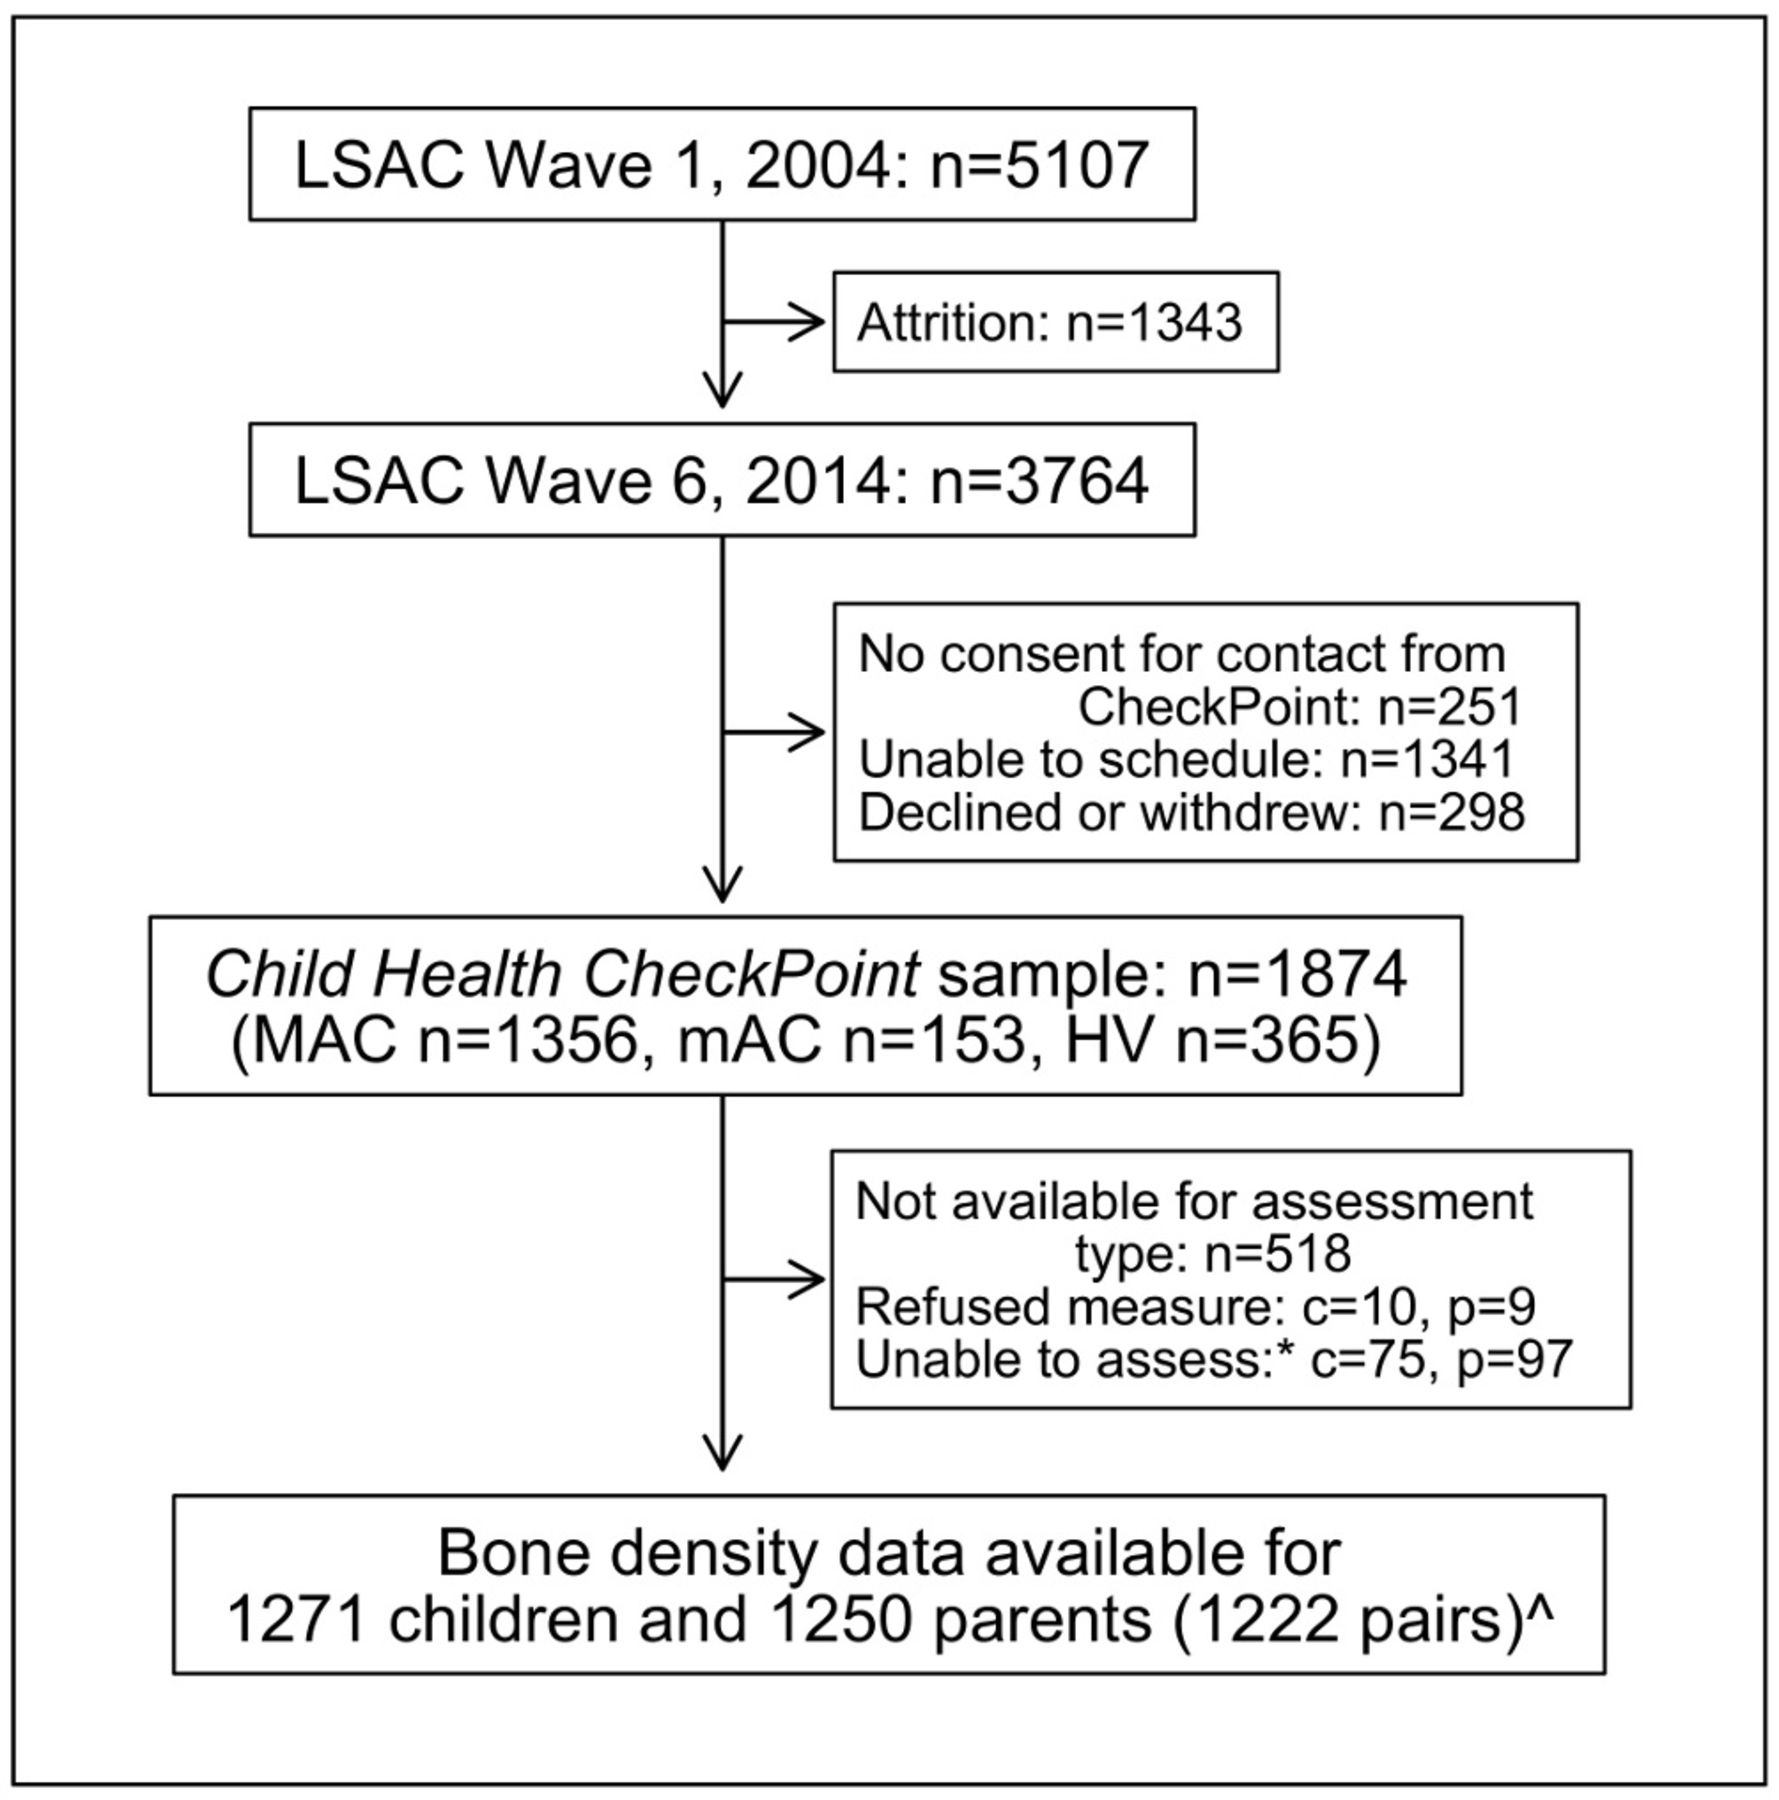
Participant flow chart. *Unable to assess due to equipment failure, poor quality data or time constraints. ^Data from nine non-biological child-parent pairs excluded from concordance analyses. c, number of children; HV, home visit assessment; LSAC, Longitudinal Study of Australian Children; MAC, main assessment centre; mAC, mini assessment centre; n, number of families; p, number of attending adults.
Skeletal assessment
One of three qualified research assistants holding Radiation Use licences conducted each pQCT scan using a single Stratec XCT 2000L pQCT scanner (Medizintechnik, Germany). Quality control was measured daily using a standard phantom (XCT2000L, 0.370 1/cm), and every 30 days using a cone phantom, and was always within the manufacturer’s nominal (mean, SD) range of 0.370±0.005. Each participant was allocated 7 min for one scout and two research scans of his/her non-dominant lower leg (tibia), classified as the leg preferentially used to kick a ball. The research assistant identified by palpation and marked with pen the superior edge of the medial malleolus and the medial edge of the tibial plateau.25 The length of the tibia was taken to be the distance between these two points as measured using a standard measuring tape. The seated participant then placed their leg, shoeless, through the gantry of the pQCT scanner and the research assistant secured their foot to the pQCT footrest.
A scout scan identified the distal epiphysial plate and allowed placement of a reference line at its proximal edge. The researcher then identified the 4% (ankle) and 66% (shin) sites of the tibia using this reference line in relation to the limb length. The 4% site corresponds to the distal shaft of the tibia, which contains mostly trabecular bone with a thin cortex; bone turnover in trabecular bone is higher than that of cortical bone.37 The 66% site corresponds to the tibial diaphysis, comprised mainly of cortical bone which is a major determinant of the intrinsic stiffness or elastic modulus of bone22 37; this site features in existing clinical reference ranges.25 One tomographic image was taken at each of these sites, at a scan speed of 20 mm/s, slice thickness of 2.4 mm and voxel size of 0.4 mm. Participants whose calf diameters were too large for the gantry (≥140 mm; 2 children and 94 parents) were not able to have a scan at the 66% site; both children and 89 parents proceeded only with a scan at the 4% site.
Image processing
Using the Stratec XCT 2000 software (V.6.20C), one of two trained research assistants manually contoured ‘regions of interest’ around each bone image at both the 4% and 66% site. The research assistants then used the MACRO analysis function to generate bone health measures with almost perfect inter-rater agreement (Intraclass correlation coefficient >0.99).
Bone health measures
Extracted measures were chosen to support comparisons with other published analyses25 and in collaboration with Stratec scientists and a Senior Scientist at The Children’s Hospital in Westmead, New South Wales, Australia. From the 4% site, trabecular BMD (mg/cm3) and total cross-sectional area (mm2) were calculated using the threshold 169.0 and peel and contour modes ‘1’ with a trabecular area of 45%.23 25 38 For the 66% site the peel and cortical modes were changed to ‘2’ and a density threshold of 710 g/cm3 was applied to separate the cortical bone from other tissues. Metrics from the 66% site were cortical BMD (mg/cm3), total cross-sectional area (mm2) and endosteal circumference, periosteal circumference and cortical thickness (all mm).25 39 We used the circular ring model to determine the circumference and thickness. BMD measures provide volumetric amounts of mineralised bone tissue at a site independent of bone size,40 while area, thickness and circumference are all geometric bone parameters. Finally, we derived the polar stress-strain index (SSI, mm) from geometry and density measures at the 66% site using a threshold of 480 mg/cm3.41 SSI represents the resistance of bone against torsional load, with some considering it a good summary predictor of bone strength.42
Scans were excluded from analyses if they contained excessive movement artefacts according to a linear scale which is similar to the one described by Blew et al. 43 Two percent (107) scans were excluded from some or all analyses based on the presence of motion or other image artefacts, resulting in lack of a clearly definable region of interest or poor image resolution.
Other sample characteristics
Bone health measures differ with age, body mass index (BMI) and sex, all of which could affect parent-child correlations. Briefly, age was calculated to nearest week using date of birth and date of assessment. Date of birth was either self-reported (parent) or imported from Medicare Australia’s database at the time of LSAC enrolment (children). Sex was self-reported by parents and imported from the Medicare Australia database for children. Height, to the nearest 0.1 cm, was measured using a portable rigid stadiometer (Invicta IP0955, Leicester, UK), without shoes or socks, in light clothing and in duplicate. A third measurement was taken if the difference of the first two measurements exceeded 0.5 cm; final height was the mean of all measurements made. Weight, to the nearest 0.1 kg, was measured with an InBody230 bioelectrical impedance analysis scale (Biospace, Seoul, South Korea). BMI was calculated as kg/m2. For children, an age-adjusted and sex-adjusted BMI z-score was also calculated using the US Centers for Disease Control growth reference charts.44 Pubertal status is important in bone development as during this time sex differences in bone mass emerge.45 Children self-reported pubertal development on an iPad questionnaire at the assessment centre using the Pubertal Development Scale,46 from which they were categorised into prepubertal, early pubertal, midpubertal, late pubertal and postpubertal stages. We considered any child who was in the early pubertal category or above as having started puberty.
In Australia, Socio-Economic Indexes for Areas provide standardised scores for socioeconomic position by geographic area (postcode of family domicile) compiled from 2011 Australian Census data. We used the Index of Relative Socioeconomic Disadvantage (Disadvantage Index), which numerically summarises the social and economic conditions of Australian neighbourhoods (national mean of 1000 and SD of 100, where higher values represent less disadvantage).47
Statistical analysis
All analyses were performed using Stata V.14.2 (StataCorp, College Station, Texas, USA). Continuous descriptive statistics were summarised using weighted means and SD; categorical variables were summarised by number and weighted percentage for children and adults separately. Summaries of the parental and child bone measures are reported using weighted means, SD and 95% CIs for children and adults separately, by sex and overall. A range of percentiles (5, 10, 25, 50, 75, 90 and 95) were determined for the data using survey weights. Survey weights were calculated taking into account the selection probability of each child, and were adjusted for non-response, loss to follow-up and benchmarked to population numbers in major (poststratification) categories of the population of children born in 2004. SEs were calculated taking into account the complex design and weights.48 More detail on the calculation of weights is provided elsewhere.49
Parent-child concordance was assessed by (1) Pearson’s correlation coefficients with 95% CIs and (2) linear regression with the child variable as the dependent variable and parent variable as the independent variable, adjusted for both parent and child age, height and sex. Additional Pearson’s correlation coefficients and linear regression models (adjusted for parent and child age and height and child sex) were also fitted for mothers and fathers separately. The Pearson’s correlation and linear regression analyses were repeated using weighted multilevel survey analyses; as these yielded similar results, unweighted results are presented.
Patient and public involvement
Because LSAC is a population-based longitudinal study, no patient groups were involved in its design or conduct. To our knowledge, the public was not involved in the study design, recruitment or conduct of the LSAC study or its CheckPoint module. Parents received a summary health report for their child and themselves at or soon after the assessment visit. They consented to take part knowing that they would not otherwise receive individual results about themselves or their child.
Results
Sample characteristics
One thousand eight hundred seventy-four families took part in CheckPoint with 1356 families attending a CheckPoint main assessment centre, 1271 children and 1250 parents had at least one bone metric included in the aim 1 descriptive analyses, and 1222 biological child/parent pairs were included in the aim 2 concordance analyses (figure 1). Table 1 shows sample characteristics of children and parents stratified by sex. The sex distribution was evenly represented in children (50.4% girls), but the parent sample largely comprised mothers (86.3%). Mean child age-specific and sex-specific BMI z-scores (0.37) were higher than Centers for Disease Control historical norms and participants on average were slightly more advantaged (Disadvantage Index mean score 1011, SD 61) than the national Australian population (mean 1000, SD 100).47 Pubertal status was missing for 108 children with bone measures, but of those who completed the questionnaire 87.4% of the boys and 95.4% of the girls had started puberty.
Sample characteristics of children and parents; values are weighted mean (SD), except where specified as (%)
Population epidemiology of skeletal characteristics
Summary statistics for parent and child pQCT values are displayed in table 2, and broken down for reference into 5th to 95th percentiles in table 3. As expected, the means of most pQCT variables were higher in parents (reflecting their larger size and more developed skeleton) than children. The exception to this was mean endosteal circumference, which was slightly larger in children (62.1 mm, SD 8.7) than parents (61.5 mm, SD 9.0). This likely reflects both children’s relatively larger medullary cavity and the predominance of mothers, whose mean endosteal circumference of 60.6 mm (SD 8.5) was distinctly smaller than that of fathers (67.5 mm, SD 9.8).42 50 51 The corresponding distribution graphs (figure 2) demonstrate approximately normal distribution in all measures for both children and adults.
Description of skeletal characteristics in Australian children and parents
Percentile values for bone geometry and strength

Density plots of adult and child peripheral quantitative CT parameters. Females (red), males (blue) and both sexes (thin dotted black line) plotted on the same graph for each outcome. X and Y scales common between child and parent.
Parent-child concordance
Table 4 presents concordance between parent and child bone measures. Pearson’s correlations were moderate for the geometric parameters such as periosteal circumference (0.38, 95% CI 0.33 to 0.43), endosteal circumference (0.42, 95% CI 0.37 to 0.47) and total cross-sectional area at the 66% site (0.37, 95% CI 0.32 to 0.42). Measures of bone density showed a weak concordance between parent and child, with correlations of 0.24 (95% CI 0.19 to 0.29) and 0.25 (95% CI 0.19 to 0.30) for trabecular and cortical BMD, respectively. Similarly, all linear regression results (adjusted for age, sex and height) showed a significant association between parents and children.
Parent-child concordance
Discussion
Principal findings
Our study provides normative values for tibial pQCT in a population-based national sample of Australian children aged 11–12 years and mid-life adults (their parents). Our results highlight that geometric bone characteristics have a stronger concordance within parent-child dyads than both trabecular and cortical bone density. Generally, stronger intergenerational concordance observed with geometric parameters suggests that pQCT may offer a potential advantage over DXA when comparing skeletal health between generations. This is particularly so given issues with DXA in assessing bone health in children due to the confounding effects of bone size.
Strengths and limitations
For pQCT to be used more widely, normative population-based reference ranges are needed.22 52 To our knowledge, this study provides the most robust pQCT normative data for children aged 11–12 years and mid-life adults to date. Measuring the tibia rather than radius lessens poor quality scans, as the leg is easier to keep still than the arm.43 This is also one of only a handful of studies to examine intergenerational concordance using pQCT. Unlike DXA, pQCT differentiates between many different skeletal parameters spanning density, size and thickness which may each be under distinct biological and genetic control.53 We believe that this gives a more complete picture of bone health, since both density and geometry contribute to breaking strength.54
Limitations include the smaller number (n=171) of fathers than mothers. Nonetheless, the male sample is still larger than other comparable studies covering this age and may still provide a useful normative adult reference until larger studies become available. Bone parameters could be influenced by pregnancy and lactation, with some studies suggesting an overall protective effect55; thus, findings might differ somewhat for women who are not parents. We primarily wanted to report variation in population-based parameters rather than examine causes of this variation, so did not adjust for a range of variables that are known to impact bone health, such as pubertal status,56 physical activity/ambulation status,57–59 vitamin D level,60 racial ancestry,61 62 hormonal status (menopause),6 63 medication history (such as long-term steroid use) and other medical conditions (eg, inflammatory bowel disease).64 However, many of these data and bioassays are/will become available along with genetic information, and could be the subject of future predictive papers in this same cohort. Physical activity and its effect on bone health in our study population has been reported elsewhere.65 Osborn et al reported a small association between moderate vigorous physical activity (MVPA) with each additional hour of MVPA associated with greater periosteal and endosteal circumference (standardised effect sizes 0.25, 95% CI 0.10 to 0.40 and 0.21, 95% CI 0.03 to 0.39, respectively) and bone strength (0.26, 95% CI 0.14 to 0.38).
Finally, perhaps the greatest limitation of using pQCT is that parameters are not yet standardised. Therefore, our results are only directly comparable to the small number of studies that used a similar protocol.22 52 One study showed how that pQCT could introduce systematic error when comparing cross-sectional geometry with bone histomorphometry using different parameter thresholds. For example, threshold differences have been shown to produce variations in total cross-sectional area and bone cortical area ranging between −1%–3.1% and 4.7%–6.5%, respectively.66 SSI is particularly sensitive to overestimations as it is a composite measure that includes cortical bone area.42 Acknowledging the possibility of systematic error between studies employing different pQCT thresholds is important. In addition, reporting exact parameters thresholds is essential to help minimise incorrect assumptions.
Significance and meaning for clinicians and policy makers
Our tibial pQCT parameters for children aged 11–12 years are comparable to the only published paediatric reference range at the tibial 4% and 66% sites. Moyer-Mileur et al recruited a convenience sample of 416 metropolitan children in Utah, USA, ranging in age from 5 to 18 years. Although the samples aged 11–12 years in both studies were similar with respect to mean height, weight and BMI z-score,39 the numbers in the study by Moyer-Mileur et al were small, particularly once stratified by height and gender.25 Chance could thus explain why our Australian boys aged 11–12 years showed a lower trabecular BMD than the American boys aged 11–12 years (195.1±23.1 mg/cm3 compared with 256.1±24.9 mg/cm3). Values for girls, and all other values for boys, were all similar in the Australian and American samples.
pQCT in adults has been problematic due to limited normative data and difficulties comparing studies due to differences in scan techniques and analyses. Categorical thresholds remain controversial and of debatable clinical utility for defining osteoporosis using pQCT. However, a recent Australian study by Jiang et al compared patients (both male and female) with osteoporosis and minimal trauma fractures with a reference group of young (age 19–26 years) healthy females in metropolitan Melbourne.24 This study produced a threshold level that equated to a diagnosis of osteoporosis based on standard definitions, as well as including patients with minimal trauma fractures. Highlighting the obstacles faced in this field, our results are difficult to compare as we used slightly different protocols (threshold for trabecular bone of 169 vs 280 mg/cm3). However, using the osteoporosis cut-off definition by Jiang et al (trabecular BMD 159.2, SD 28.7), it is concerning that the 10th percentile of the women in our study (table 3) fell into this range (accounting for SD).
A novel contribution is to report parent-child concordance across a wide range of geometric as well as density parameters. As we studied parent-child dyads, rather than twin or larger family groupings, we cannot draw formal conclusions regarding heritability, which is not directly commensurate with concordance. However, given that heritability of polygenic traits considers contributions from both parents, it is striking that our child-one parent concordance of 0.24 is almost exactly half the estimated heritability (h2) of 0.51 for offspring trabecular density in pQCT offspring study of African Caribbean adults by Wang et al.31 This suggests that parent-child concordance, at least for trabecular density, is fully expressed in childhood, that is, it precedes both peak bone deposition and subsequent bone loss. While our cortical bone density child-parent concordance of 0.25 appeared somewhat high in light of an estimated h2 value of 0.32 in adult-parent dyads in the study by Wang et al, both our cortical and trabecular density values are in keeping with heritability estimates of 50%–80% of BMD from DXA studies,26–30 which is already evident in prepubertal children.26 27 From the meta-analysis by Paternoster et al on genotyped single-nucleotide polymorphisms,53 it seems probable that different genes are at play at various ages and in different ethnicities on different bone parameters. This could explain why we saw concordance values as high as 0.42 and 0.38 for endosteal and periosteal circumference, respectively. It is clear that more pQCT studies are needed to further explore these relationships.
Unanswered questions and future research
Further intergenerational studies are needed to confirm that intergenerational concordance is greater for geometric than density parameters. Nonetheless, this finding highlights the possible advantages of using pQCT over DXA in intergenerational bone research. While preliminary studies have investigated relationships of pQCT parameters with fracture rates and osteoporosis, prospective studies are needed to define pQCT cut-offs defining ‘poor bone heath’ in both children and adults that would guide clinical interventions.9 14 52 Longitudinal data in population cohort studies will be invaluable in both adults and children to more clearly delineate the tracking of geometric parameters over time, and at what ages subsequent symptomatic disease (ie, fractures) can be most reliably predicted and effectively prevented.9 In addition, consensus is required in the field as to which analysis algorithms are best used so pQCT research can be compared more easily.
Conclusions
Our study provides robust population-based reference ranges for pQCT measurements at the 4% and 66% sites of the tibia in children aged 11–12 years and mid-life adults. The concordance between parent and child measurements reflect the known high genetic heritability of bone. The finding of increased concordance in geometric parameters of bone compared to density demonstrates the benefits of using pQCT in order to make meaningful comparisons between child and adult bone characteristics.
Acknowledgments
This paper uses unit record data from Growing Up in Australia, the Longitudinal Study of Australian Children. The study is conducted in partnership between the Department of Social Services (DSS), the Australian Institute of Family Studies (AIFS) and the Australian Bureau of Statistics (ABS). Research Electronic Data Capture (REDCap) electronic data capture tools were used in this study. More information about this software can be found at: www.project-redcap.org. The authors would like to thank the LSAC and CheckPoint study participants, staff and students for their contributions. Julie Briody provided invaluable technical assistance and support in the early phases of data collection.
References
Footnotes
Contributors JV, PJS, KLy and MW contributed to study conception, data collection and interpretation of results, drafted the initial manuscript, critically revised further drafts and approved the final manuscript as submitted. SAC, ACG and KLa contributed interpretation of results, performed the statistical analysis and critically revised further drafts and approved the final manuscript as submitted. NI and WO contributed to data collection and analysis and critically revised further drafts and approved the final manuscript as submitted. MW is the Principal Investigator of the Child Health CheckPoint and conceived this study.
Funding This work was supported by the National Health and Medical Research Council (NHMRC) of Australia (Project Grants 1041352, 1109355), The Royal Children’s Hospital Foundation (2014-241), the Murdoch Children’s Research Institute (MCRI), The University of Melbourne, the National Heart Foundation of Australia (100660) and Financial Markets Foundation for Children (2014-055, 2016-310). MW was supported by Cure Kids, New Zealand. The following authors were supported by the NHMRC: Senior Research Fellowship to MW (1046518) and Early Career Fellowship to KLy (1091124). KLy was supported by a National Heart Foundation of Australia Postdoctoral Fellowship (101239). The MCRI administered the research grants for the study and provided infrastructural support (IT and biospecimen management) to its staff and the study, but played no role in the conduct or analysis of the trial. DSS played a role in study design; however, no other funding bodies had a role in the study design and conduct; data collection, management, analysis and interpretation; preparation, review or approval of the manuscript and decision to submit the manuscript for publication. Research at the MCRI is supported by the Victorian Government’s Operational Infrastructure Support Program.
Disclaimer The findings and views reported in this paper are those of the author and should not be attributed to DSS, AIFS or the ABS.
Competing interests All authors have completed the ICMJE uniform disclosure form at http://www.icmje.org/coi_disclosure.pdf and declare financial support as described in the funding section. MW received support from Sandoz to present at a symposium outside the submitted work.
Ethics approval The CheckPoint data collection protocol was approved by The Royal Children’s Hospital (Melbourne, Australia) Human Research Ethics Committee (33225D) and The Australian Institute of Family Studies Ethics Committee (14-26).
Provenance and peer review Not commissioned; externally peer reviewed.
Data sharing statement The Longitudinal Study of Australian Children datasets and technical documents are available to researchers at no cost via a licence agreement. Data access requests are co-ordinated by the National Centre for Longitudinal Data. More information is available at https://dataverse.ada.edu.au/dataverse/lsac.
Patient consent for publication Not required.