Article Text

Abstract
Objectives To describe the epidemiology and parent–child concordance of objectively measured physical activity in a population-based sample of Australian parent–child dyads.
Design Cross-sectional study (Child Health CheckPoint) nested within the Longitudinal Study of Australian Children.
Setting Assessment centres in seven Australian cities and eight regional towns or home visits; February 2015–March 2016.
Participants Of all CheckPoint families (n=1874), 1261 children (50% girls) and 1358 parent (88% mothers) provided objectively measured activity data, comprising 1077 parent–child dyads.
Outcome measures Activity behaviour was assessed by GENEActiv accelerometer. Duration of moderate-to-vigorous physical activity (MVPA) and vigorous physical activity and sedentary behaviour (SB) were derived using Cobra custom software, along with MVPA/SB fragmentation and mean daily activity. Pearson’s correlation coefficients and linear regression estimated parent–child concordance. Survey weights and methods accounted for the complex sample design and clustering.
Results Although parents had average lower accelerometry counts than children (mean [SD] 209 [46] vs 284 [71] g.min), 93% of parents met MVPA daily duration guidelines on published cutpoints (mean [SD] 125 [63] min/day MVPA), compared with only 15% of children (mean 32 [27] min). Parents showed less daily SB duration (parents: 540 [101], children: 681 [69] minutes) and less fragmented accumulation of MVPA (parents: α=1.85, children: α=2.00). Parent–child correlation coefficients were 0.16 (95% CI 0.11 to 0.22) for MVPA duration, 0.10 (95% CI 0.04 to 0.16) for MVPA fragmentation, 0.16 (95% CI 0.11 to 0.22) for SB duration and 0.18 (95% CI 0.12 to 0.23) for SB fragmentation.
Conclusions Standardised cutpoints are needed for objective activity measures to inform activity guidelines across the lifecourse. This may reflect large amounts of time in non-shared environments (school and work).
- actigraphy
- physical activity
- reference values
- children
- inheritance patterns
- epidemiologic studies
This is an open access article distributed in accordance with the Creative Commons Attribution Non Commercial (CC BY-NC 4.0) license, which permits others to distribute, remix, adapt, build upon this work non-commercially, and license their derivative works on different terms, provided the original work is properly cited, appropriate credit is given, any changes made indicated, and the use is non-commercial. See: http://creativecommons.org/licenses/by-nc/4.0/.
Statistics from Altmetric.com
Strengths and limitations of this study
This study used valid, reliable, objective, free-living measures of Australian children and parent activity patterns. The sample is drawn from a nationally representative cohort.
We report for the first time parent–child concordance in objective activity duration and fragmentation.
Although the accelerometry measurements were objective, the multiple choices needed in processing the data could have impacted on the results, requiring caution in comparisons of absolute values with other studies.
Findings apply to a narrow child age range (11–12 years); parent–child concordance could evolve as children grow up.
Most adults were mothers, limiting conclusions for fathers and for adults who are not parents.
Introduction
Physical activity (PA) and sedentary behaviour (SB) have both been independently linked to a wide range of health outcomes in children1 2 and adults.3 4 Furthermore, some studies have suggested that, independent of duration, other characteristics of PA and/or SB impact on health. For this reason, there has recently been a growing interest in examining the patterns of accumulation of sedentary and physical activity times, the term ‘pattern’ encompassing notions such as sequencing, timing, consistency and fragmentation. Recent studies have shown that less fragmentation of sedentary time (more long bouts) is associated with obesity and health markers in adults, although analyses involving children have been less conclusive.5 6 Similarly, higher intensity,7 more continuous8 bouts of PA have been associated with better health outcomes and most PA guidelines contain recommendations regarding the distribution of PA.9 10 Finally, vigorous PA (VPA) has added benefits compared with overall moderate-to-vigorous physical activity (MVPA),1 and some PA guidelines10 11 provide recommendations on the amount of VPA in addition to MVPA recommendations.
Patterns of activity and sitting result from both genetic and environmental factors,12 so we would expect a degree of concordance between children’s activity patterns and those of their parents, arising from shared genes and shared environments. Shared environments include geographical, climatic and financial contexts and social factors such as parental modelling and direct parental involvement. Child-to-parent effects may also play a role. Genetic factors may relate to the heritability of personality traits associated with adherence to PA (conscientiousness, self-motivation and self-discipline), reward-associated hormonal responses to exercise (dopamine and endogenous opioids) or physiological characteristics such as aerobic fitness and strength that encourage participation in sport.
While a high parent–child concordance may be a marker of strong genetic or shared environmental determinants, a lower correlation may indicate greater importance for the non-shared environment—notably the school environment for children and the work environment for parents. School in particular may be a homogenising influence, since at school all children have very similar timings of daily activities. In terms of interventions, a high concordance would either suggest that interventions may be ineffective (if there is a large non-modifiable genetic component) or that the focus should be on the shared environment. A low concordance may be a marker of relatively high behavioural malleability, with an appropriate focus on the non-shared environment.
Advances in wearable technology have made it possible to objectively measure PA and SB, and a number of studies have quantified free-living activity in children12–14 and adults.14–16 Estimates of the proportion of variability in measured PA that can be ascribed to additive genetic effects range from 20% to 71%.12 17 The differences may be due to the age of the participants, the powerful effect of the shared school environment or to the use of questionnaire data.
To review current literature on parent–child concordance in PA and SB, we used a systematic search to synthesise data from 26 studies17–40 from 11 mainly European and North American countries. This yielded a total of 119 correlations between parental and child PA (figure 1). Correlations were classified according to: (1) the type of PA measured (sport, exercise, VPA, moderate PA [MPA], recreational PA, leisure-time PA were all classified as MVPA); estimates of overall energy expenditure were classified as total daily energy expenditure (TDEE); (2) the age of the child; (3) the sex of the parent; (4) the sex of the child; and (5) assessment methodology (questionnaires were classified as subjective; accelerometry, pedometry and direct observation as objective). Using a random effects approach, the overall weighted mean correlation for all PA outcomes was 0.18 (95% confidence level [CL] 0.15 to 0.21) (figure 1). Correlations did not differ by outcome (MVPA: r=0.18, TDEE: r=0.26), sex of parent (father: r=0.23, mother: r=0.18), sex of child (daughter: r=0.20, son: r=0.23) or assessment methodology (subjective: r=0.20, objective: r=0.17). Heterogeneity was high for all analyses (I2 >55). Only four studies19 21 22 37 from the UK, Finland and the USA, with a total of 24 correlations, looked at parent–child concordance in some measure of SB (sitting, TV or inactivity). The overall weighted mean correlation was 0.26 (0.17–0.35). Heterogeneity was high (I2=72).

Funnel plot of correlations between parent and child physical activity from 26 studies. Data derived from objective measures are shown with filled symbols; data derived form subjective measures with empty symbols. Circles indicate studies where the outcome was MVPA, and squares studies where the outcome was TDEE. MVPA, moderate to-vigorous physical activity; TDEE, total daily energy expenditure.
The sample sizes in most of the PA and SB studies were relatively modest (median n=192), and in only 7 of 26 studies were the activity patterns of both parent and child objectively measured. None of the studies was performed in Australia. Furthermore, these studies only addressed parent–child concordance in the duration of PA or SB, or total daily activity levels, with no data on fragmentation.
The aims of this study were to:
Report the mean values and distributions of PA and SB, and their fragmentation, in a large, population-based sample of Australian children aged 11–12 years and Australian midlife adults (their parents).
Quantify parent–child concordance in objectively measured PA and SB duration and fragmentation. In addition, report mother–child and father–child concordances separately in order to allow comparison with previous concordance studies.
Methods
Study design and participants
The initial study design and recruitment have been described in detail elsewhere.41 42 The Longitudinal Study of Australian Children (LSAC) commenced in 2004, recruiting a nationally representative cohort of 5107 infants through a two-stage cluster sample design,43 whereby 10% of all Australian postcodes were randomly selected, stratified by state and capital city/rest of state, and children born between March 2003 and February 2004 were then randomly selected from the Medicare database.44 45 A percentage of 73.7 (n=3764) of participants were retained to LSAC wave 6 in 2014.
At the start of wave 6, all contactable and consenting families were invited to consent to their contact details being shared with the Child Health CheckPoint team (n=3513). In 2015, consenting families were sent an information pack via post and received an information and recruitment phone call. The CheckPoint study was conducted from February 2015 to March 2016, between LSAC waves 6 and 7 (children’s age 11–12 years), and 1874 families participated. The overall aim of the CheckPoint study was to examine relationships between multiple environmental factors and multiple health outcomes; a more detailed description of the study design is provided elsewhere.46 47
Consent
The attending parent provided written informed consent for them and their child to participate in the study.
Patient and public involvement
No patient groups were involved in the design or conduct of LSAC, a population-based longitudinal study. To our knowledge, the public was not involved in the study design, recruitment or conduct of the LSAC study or its CheckPoint module. Parents received a summary health report for their child and themselves after the assessment visit. They consented to take part knowing that they would not otherwise receive individual results about themselves or their child.
Procedure
All measures were collected at a specialised 3.5-hour (seven capital cities and larger regional towns) or 2.5-hour (eight smaller regional centres) CheckPoint assessment centre visit. Three hundred and sixty-five families who could not attend a centre received a 1.5-hour home visit. At the end of the visit, a trained research assistant fitted a GENEActiv accelerometer (Activinsights Ltd, UK) on the non-dominant wrist of each child and parent and provided each with an activity card (see below). Participants were instructed to wear the device at all times for eight continuous days, starting the day of the visit, removing it only for prolonged water immersion (swimming and bath) or as prescribed by some contact sports rules (eg, netball). After 8 days, participants returned the device, together with the completed activity card using the prepaid postal envelope provided. For more information on data collection, refer to the physical activity section of the Child Health CheckPoint Data Issues Paper.48
PA measures
Activity cards: the activity cards were paper-based logs in a table format with fields for each day of the monitoring period to allow participants to write the following:
At what time they went to bed at night (‘bed time’).
At what time they woke up in the morning (‘get up time’).
If they took the device off, at what times it was removed and put back on, as well as the reason for removal.
A brief description of their day (eg, ‘school’, ‘travel’ and ‘unwell resting’…).
Once returned, activity cards were transcribed in electronic form by research assistants to be used in the processing of the accelerometer data (see below for details). Reliability testing of card transcription is described in online supplementary appendix 1.
Supplementary file 1
Accelerometers were configured through the manufacturer’s software (GENEActiv PC Software, Activinsights, UK) to record at 50 Hz for 14 days, starting at midnight following the CheckPoint visit. The 14-day recording duration was chosen to ensure enough valid days were recorded in case the participant could not wear the device for some days and the total monitoring duration had to be extended.
After the device was returned, the research team downloaded the raw acceleration data. The signal vector magnitude of the acceleration, minus gravity, was computed and summed over 60 s epochs:

where ax, ay and az are the three components of the acceleration signal and g the acceleration of gravity (9.81 m/s2). The 60 s epoch data was then imported into custom Matlab software for further processing. This software (Cobra, developed at the University of South Australia) provides a user-friendly graphical user interface for processing accelerometer data.
First, sleep was identified using the activity cards completed by the participants. Sleep times were corrected by visual inspection when necessary, that is, in case sleep times were not reported or when obvious discrepancies were observed between reported sleep and accelerometer trace. Following this, device removals (non-wear) were identified using the activity cards and excluded from analysis. Where the reason given for removal was ‘sport’, the removal period was replaced with a period of MVPA. This was done because: (1) most children were not allowed to wear the watch for some sport activities (eg, netball and swimming) and (2) these sport activities often made for a large part of daily MVPA, so ignoring them would potentially result in a large underestimation of daily MVPA. MVPA imputed in this way was not considered for the calculation of MVPA fragmentation (see below). Duration of VPA was also obtained for each participant.
A day was considered invalid and excluded from analysis if it included ≤10 hours wear during waking hours,14 or if it included ≥1000 min (16 hours 40 min) of sedentary time (reflecting a day of non-wear not captured by the self-report logs, typically after the end of the recording period). A participant was considered invalid and excluded from analysis if they provided <4 valid days of accelerometry data14 49 or if they had ≤200 min average sleep time.
Each 60 s epoch of waking wear time was then classified into one of four PA levels: sedentary, light, moderate or vigorous PA. Cutpoints for PA levels were defined according to Esliger et al 50 for parents and Phillips et al 51 for children and adjusted proportionally to account for the 50 Hz sampling frequency. The resulting cutpoints between sedentary and light, light and moderate and moderate and vigorous PA were 188, 403 and 1131 gravity units per minute (g.min) for adults, and 244, 788 and 2175 g.min for children, respectively.
Fragmentation of sedentary and MVPA time was characterised using the method described by Chastin and Granat.52 The measure of fragmentation (α) was the slope of the regression line of the relative frequency of a bout (of MVPA or SB) plotted against bout length on a log scale. For SB, α was calculated on a per-day basis. However, α for MVPA was calculated using all valid days combined for a given participant, because a good curve fit required more bouts of MVPA than were usually available in a single day. In the present study α was multiplied by −1 so that it is always positive. Higher values of α indicate greater fragmentation, that is, fewer long bouts—considered desirable for SB—and lower values of α less fragmentation and more prolonged bouts.
Other sample characteristics including potential confounders
Age and sex affect PA patterns, which in turn were expected to influence parent–child correlations. Sex and date of birth were exported from Medicare Australia’s database at the time of LSAC enrolment (for the child) or self-reported (parent). Age was rounded to nearest week by calculating the days between the participant’s date of birth and date of assessment.
Adjustment was also made for socioeconomic status because it is shared by parents and children and is correlated to PA and SB patterns. Socioeconomic status was determined from the postcode of the participant’s primary address using the Socio-Economic Indicators for Areas 2011 Index of Relative Social Disadvantage (Disadvantage Index), which factors in household education levels, income, employment status and disability. The population mean score for Australia is 1000 (SD 100), with higher scores representing greater advantage.
Statistical analysis
All accelerometry outcome variables were computed for each individual day, then averaged over days for each valid participant using a 5:2 weighting for work/school days versus weekend days. School holidays were counted as weekend days for children.
Objective PA variables were described for all children and adults using means and SD. Population summary statistics were estimated by applying survey weights and survey procedures that corrected for sampling, participation and non-response biases and took into account clustering in the sampling frame. SEs were calculated taking into account the complex design and weights. More detail on the calculation of weights is provided elsewhere.53
For each of the 1077 biological child–parent pairs, concordance between parents and children was assessed by: (1) Pearson’s correlation coefficients with 95% CIs; and (2) linear regression with the child variable as the dependent variable and the parent variable as the independent variable. Linear regression models were adjusted for parent and child age and sex (in models including both sexes) and socioeconomic Disadvantage Index. As there were only minimal differences between unweighted and weighted results, only the former are presented here.
Data were analysed using Stata V.14.2.
Results
Sample characteristics
Figure 2 shows that valid accelerometry data were obtained for 1261 children (50% female) and 1358 parents, allowing the analysis of 1077 child–parent pairs. Only biological child–parent pairs were included in the concordance analysis, resulting in the exclusion of 12 non-biological pairs. Table 1 shows the participant characteristics. Most parents were mothers (88%). Overall, participants were slightly more advantaged than the average Australian household, with a mean Disadvantage Index of about 0.1 SD above the Australian average and a narrower spread (SD 64) than the national SD of 100. Body mass index (BMI) for parents and children were comparable with general population values for adults and children of the same age.54
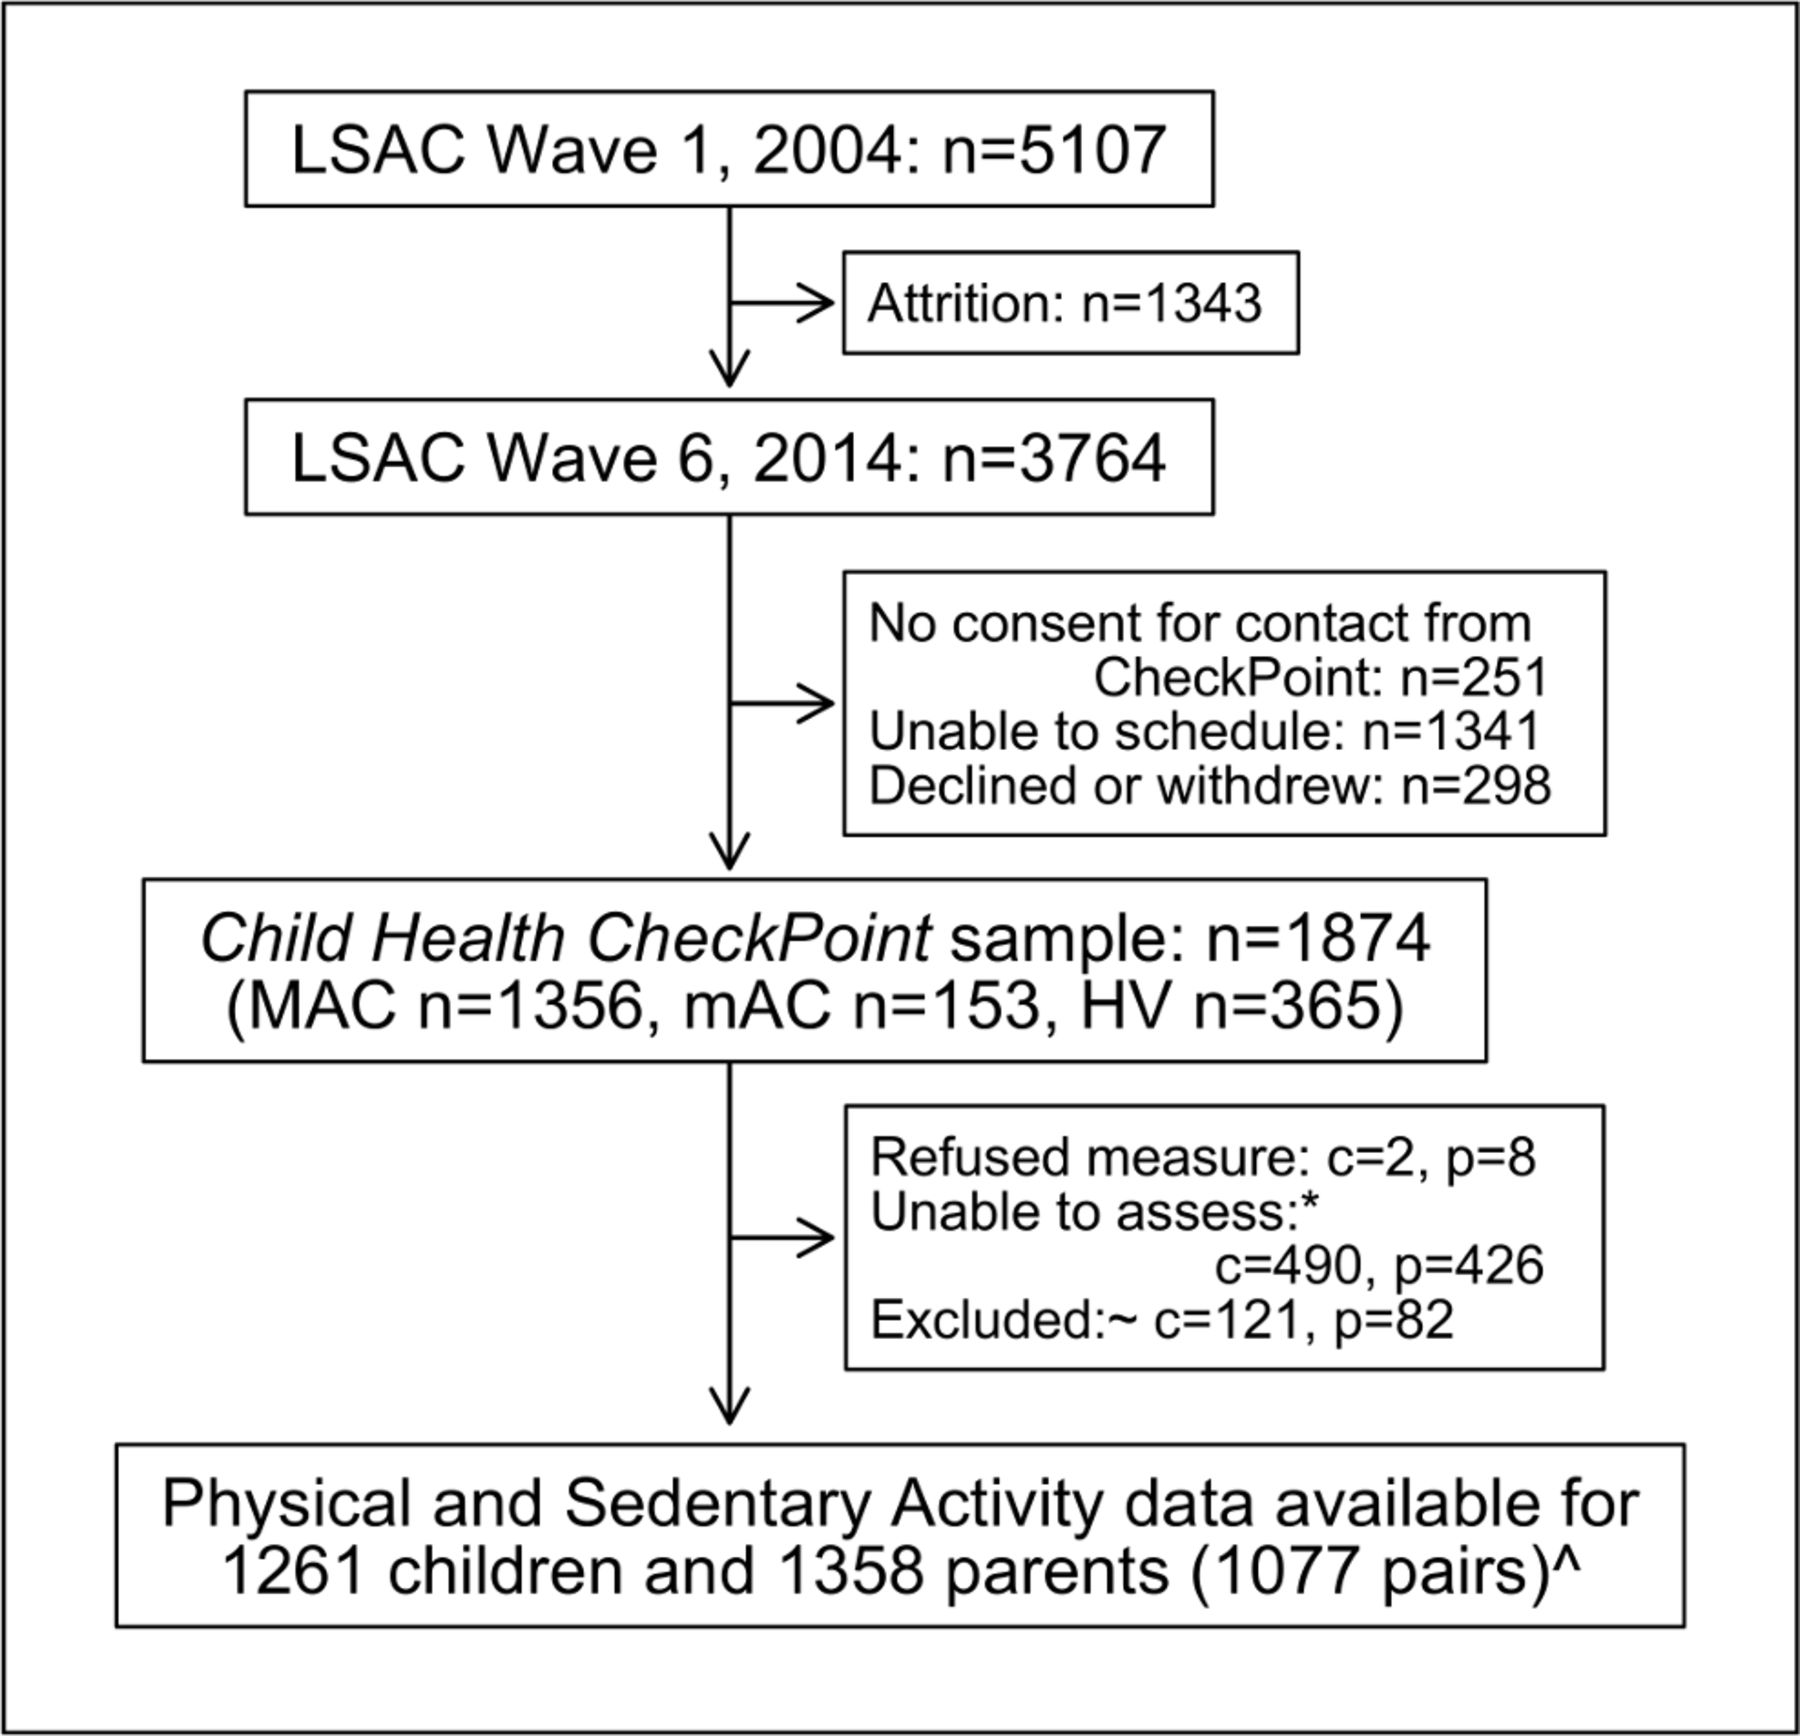
Recruitment and retention of participants for Child Health CheckPoint, including sample size for PA and SB. *Unable to assess due to equipment failure, poor quality data or time constraints. ~Participants excluded if valid days available did not meet the minimum criteria of at least 4 days of any type, ≤200 min sleep and ≤1000 min sedentary time. ^Data from 12 non-biological child–parent pairs excluded from concordance analysis. n, number of families; c, number of children; HV, home visit assessment; LSAC, Longitudinal Study of Australian Children; MAC, main assessment centre; mAC, mini assessment centre; p, number of attending adults; PA, physical activity; SB, sedentary behaviour .
Participant characteristics (weighted mean and SD)
PA characteristics
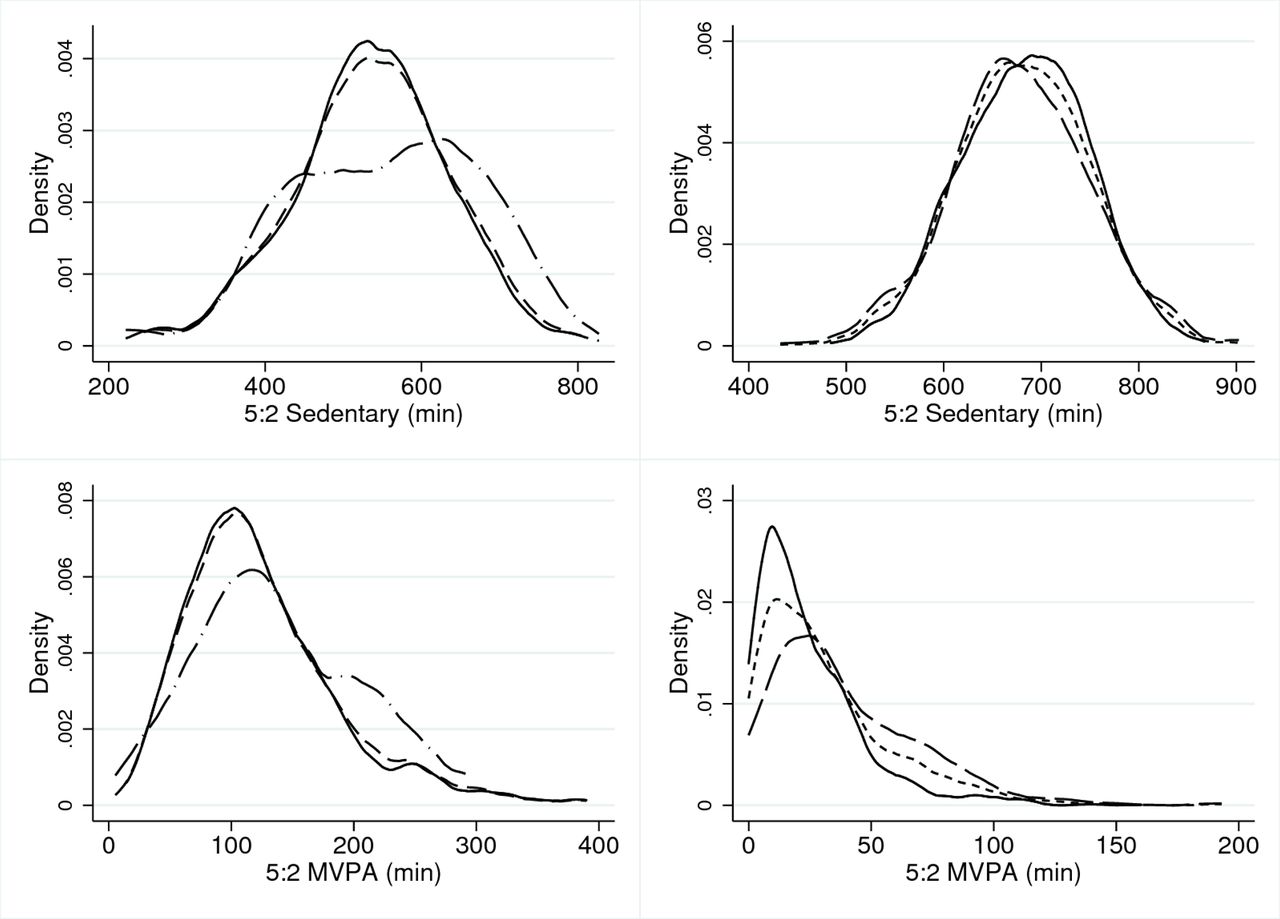
Table 2 presents the PA characteristics of all valid participants, including MVPA and SB duration and fragmentation, and VPA duration. Figure 3 shows the distributions of SB and MVPA duration for both parents and children. Parents had on average lower accelerometry counts than children (mean [SD] 209 [46] vs 284 [71] g.min). Overall, children accumulated an average of 32 min of MVPA per day, with boys having overall higher MVPA duration (40 min/day) than girls (24 min/day). Variability (SD of the duration) was large for both boys and girls, relative to the mean (SD 30 min and 22 min, respectively). Adults’ MVPA duration was 142 min and 122 min/day for mothers and fathers, respectively, and the variability (SD 69 and 62 min for fathers and mothers, respectively) was lower than in children relative to the mean. Fifteen per cent of children and 93% of parents met MVPA recommendations of 60 and 30 min/day respectively. However, it is important to note that children’s and parents’ MVPA and SB durations are not directly comparable, because different cutpoints are used. Overall, children exhibited a more fragmented pattern of accumulation of MVPA (higher α) than parents, with an overall average α of 2.00 for children and 1.85 for parents.

Density plots for average sedentary and MVPA time per day. Left-hand plots relate to parents, right-hand plots relate to children. Males/boys (dash-dotted line), females/girls (solid line) and both sexes combined (dotted line). MVPA, moderate-to-vigorous physical activity.
Distribution of sedentary behaviour and physical activity, weighted for day type
The sedentary time of boys and girls was averaging 679 min and 684 min, respectively. This was larger than parents, with 555 and 538 min for fathers and mothers, respectively. Parents also exhibited a more fragmented accumulation of SB (α=2.46) than children (α=2.13).
Child–parent concordance
Table 3 presents the correlation coefficient (CC) and regression coefficient (RC) estimates between the children and their parents, for each of the five PA metrics. Overall, there were small but significant correlations between children’s and parents’ PA behaviours. Between mothers and children, all five PA variables were significantly correlated. Correlations were weak for SB, VPA and MVPA duration, and SB fragmentation, and very weak for MVPA fragmentation (0.11). Between fathers and children, only VPA duration and SB fragmentation were significantly associated (r=0.24 and 0.22, respectively, both p<0.05); however, the sample size was smaller.
Parent–child concordance. The upper panel shows unadjusted values, and the lower panel values adjusted for parent and child age and sex, and Disadvantage Index.
Influence of MVPA imputation method
Thirty-four per cent of children and 10% of parents had any amount of reported sport-related non-wear. Replacing these non-wear periods with MVPA may have had an influence on the results. To investigate this, we also replaced these sport-related non-wear periods with a composition of 50% MVPA, 30% LPA and 20% sedentary time, as reported by Ridley et al in an observational study of children.55 Pearson’s correlation between children’s daily MVPA while using 100% MVPA replacement, and using the 50%/30%/20% MVPA/LPA/sedentary composition, was 0.96. Parent–child correlation for daily MVPA duration increased slightly from 0.16 (table 3) to 0.166.
Discussion
Principal findings
This study provides normative values for device-measured activity behaviour in a large sample of Australian midlife adults and children aged 11–12 years. Using the specific combination of device and analytical algorithms in this study, children accumulated on average 32 min of MVPA each day, of which 10 min were VPA. Using different cutpoints, adults accumulated 125 min/day of MVPA, but only 7 min/day of VPA. Children had higher levels of sedentary time (681 min/day) than adults (540 min/day). Children’s MVPA was more fragmented than that of their parents, while sedentary time was less fragmented. Concordance between children and parents for MVPA, VPA and sedentary time duration and fragmentation was weak to moderate, ranging between r=0.08 and r=0.32.
Strengths and limitations
The CheckPoint PA study is the largest accelerometry-based cross-generational study of activity in Australia. It is also the first to report concordance of PA and SBs between parents and children aged 11–12 years. This study reports valid, reliable, objective, free-living measures of child and parent PA patterns and their concordance from a large national sample. Data were collected simultaneously for parents and children using the same protocol. To our knowledge, this is the first study to report metrics for intensity and fragmentation of PA and SB.
Limitations include the relatively small number of fathers, reducing precision of their estimates. Only one parent was included for each child; this is nonetheless one of very few studies that present separate (but largely similar) mother–child and father–child concordance estimates. Second, the sample in this study, while drawn from a cohort which was designed to be nationally representative, was subject both to selective update and attrition. This might have affected both activity and the impacts of BMI on activity, and perhaps concordance values. Furthermore, the age range of the children was narrow (11–12 years).
Significance and meaning
Duration of PA and sedentary time
It is surprising that our results indicate parents accumulated more daily MVPA than children (table 2). Most studies find that children are more active than adults, both by self-report and using accelerometers.14 Moreover, doubly labelled water studies show that TDEE declines with age.56 In that regard, the differences in this study between children and adults almost certainly come from the fact that two separate sets of cutpoints were used. Although the cutpoints we used were developed specifically for children and adults, the MPA cutpoint for children (788 g.min) is almost double that of adults (403 g.min), resulting in a much lower MVPA estimate for children. The fact that daily average accelerations were 35% higher for children than parents (283 g.min and 210 g.min, respectively) confirms the fact that children in fact moved more than their parents, and children exhibiting lower daily MVPA is an artefact of the different cutpoints used. In other words, using children’s cutpoints to analyse parents’ MVPA would result in parents exhibiting less daily MVPA than children.
In spite of this, estimated MVPA and sedentary durations in the CheckPoint study were in line with findings from several previous studies. For instance, in adults, Rosenberger et al 57 reported MVPA durations of 100–220 min/day depending on the device used. Recently, Rowlands et al 58 reported average MVPA durations of 92 min/day for a small adult sample, using the GeneActiv. A recent study using the large (n=22 978) Biobank dataset reported 106 min/day MVPA in healthy adults.59 In children, Telford et al 60 reported averages of 43 and 31 min/day of MVPA for boys and girls aged 8–12 years, respectively. The International Study of Childhood Obesity, Lifestyle and Environment (ISCOLE) study used Actigraph GT3X+ accelerometers, finding that 10-year-old boys accumulated 75 min/day MVPA and girls 57 min/day.61
Of note, accelerometer-based estimates of children’s PA tend to show more variability between studies than adults’ PA. This may be due, in part, to the more sporadic nature of children’s PA. A study of 47 children aged 6–11 by Schaefer et al 62 showed that daily MVPA was 308 min/day when including all episodes of 1 s or more, but decreased 20-fold, to 14 min/day, when only including MVPA episodes of at least 60 s. Second, a study by Reilly et al showed that estimates of children’s MVPA varied from 28 min/day to 266 min/day depending on the set of cutpoints used.63
Overall, our results once again highlight the fact that accelerometry-based assessment of PA is highly dependent on a number of factors, including the accelerometer device itself58 but more importantly the choice of algorithms and processes used, such as sampling frequency, raw data filtering, epoch length and cutpoint values. At present, there is no consensus on the choice of processes.64 A recent review has identified wide discrepancies in processing parameters,49 with some of these choices having a large impact on results. This makes comparison between studies difficult. In this regard, accelerometry could be seen as better suited to assess relative change in PA, be it across populations, in longitudinal studies or in interventions, provided that protocols and data processing methods are consistent. Assessment of absolute values of PA appear more difficult since they are highly dependent on a number of factors. This also means it is challenging to use objectively measured PA to decide whether children and adults meet PA guidelines, which were themselves originally developed based on self-report, rather than accelerometry. While most PA guidelines10 11 63 65 recommend 60 min and 30 min per day for children adults, respectively, assessing guideline adherence using accelerometry is inherently limited. Using our combination of device and algorithms, only 15% of children meet these recommendations. A recent Australian survey showed that only 19% of children aged 5–17 years meet the PA guidelines.66 Our study indicates that Australian adults easily met the recommendations, which is at odds with self-report data.67
Fragmentation of PA and sedentary time
Parents presented fragmentation of sedentary time (2.46) in line with levels of healthy populations (2.27).52 Children’s sedentary fragmentation was overall lower than adults’, perhaps reflecting both long periods of sitting during school and sessions of unbroken screen time. Children spent 50% of their sedentary time in bouts of 43 min or more and parents in bouts of 26 min or more. In contrast, children exhibited a more fragmented accumulation of MVPA than adults, in line with observations that children’s PA tends to be sporadic.68 69 Our study is the first to use the alpha coefficient to quantify fragmentation of MVPA in adults, and the first to use it for both sedentary time and MVPA in children, so there is no available comparison point.
Concordance between children and parents
The correlation for MVPA duration (r=0.16) was consistent with our review of studies (r=0.15–0.21), most of which used self-report. The method chosen for imputing MVPA time during sport-related non-wear events only had little effect. The weakest correlation was for MVPA fragmentation (r=0.10) and the strongest for VPA duration (r=0.19). This suggests that genetic effects on objective MVPA and SB are relatively modest and that non-shared environments (principally work and school) may be the major determinant.
Implications for clinicians and policy makers
Children’s MVPA levels in this study were low (32 min/day), and sedentary time was high (681 min/day) and showed evidence or prolonged, unbroken sedentary periods. Australian children are not sufficiently active, and efforts should be made to increase participation. Regarding sedentary time, we found that children accumulate more than 11 hours/day of sedentary time. However, the guidelines generally provide recommendations regarding screen time only,10 11 65 whereas accelerometers do not distinguish screen time from the rest of sedentary time. A previous study of Australian children70 found that this high level of sedentary time represents mainly screen time (40%), sitting at school (25%), sedentary social occasions (12%), eating (10%) and passive transport (10%). While interventions can address each of these domains, there is mounting evidence that not all types of sedentary time are equally harmful, with television in particular being inculpated in unfavourable health outcomes. The composition of sedentary time may therefore be as important as the overall duration.
For adults, the vast majority meet the recommended MVPA. Regarding sedentary time, guidelines tend to only recommend that sedentary time should be broken up into bouts of 30 min or less when possible. In their study, Chastin et al 52 showed that a fragmentation index of 2.27 means that half the total sedentary time is accumulated in bouts of 17 min or shorter. Our results for adults (α=2.46) mean that the sedentary time for our adult sample is even more fragmented that this, indicating sufficient fragmentation of sedentary time. That said, the extent to which sedentary time must be broken down in order to avoid negative health effects is unknown.
Unanswered questions and future research
This study highlights the need to standardise methods for objective measures of use of time to enable pooling and comparison of results from different countries and study centres and across ages. Moreover, there is a need to enable better comparisons between objectively measured PA and guidelines based on subjective reports. One initiative might be to establish a repository of raw accelerometry data, along with harmonised key covariates, which can be reanalysed using common metrics. The International Children’s Accelerometry Database is moving towards this objective.71
While the cross-sectional nature of the study does not allow us to infer causation, the relatively weak concordance values suggest that genetic factors relating to PA and sedentary time are not strong and that parents only moderately influence their children’s PA and SBs (and/or vice versa). The latter is to be expected given that children spend a large part of their waking day at school. The relative contribution of genetic and environmental factors could be addressed by genetic studies using, for example, Mendelian randomisation.
Acknowledgments
This paper uses unit record data from Growing Up in Australia, the Longitudinal Study of Australian Children. The study is conducted in partnership between the Department of Social Services (DSS), the Australian Institute of Family Studies (AIFS) and the Australian Bureau of Statistics (ABS). Research Electronic Data Capture (REDCap) electronic data capture tools were used in this study. More information about this software can be found at: http://www.project-redcap.org. The authors would like to thank the LSAC and CheckPoint study participants, staff and students for their contributions.
References
Footnotes
Contributors FF, JM, MW and TO conceptualised the manuscript. FF led the writing; ACG, JM, MW and TO provided expert advice and critical review of this manuscript; ACG analysed the data. MW is the principal investigator of the Child Health CheckPoint, planned the analyses and provided critical review of this manuscript.
Funding This work was supported by the National Health and Medical Research Council (NHMRC) of Australia (Project Grants 1041352 and 1109355), The Royal Children’s Hospital Foundation (2014-241), the Murdoch Children’s Research Institute (MCRI), The University of Melbourne, the National Heart Foundation of Australia (100660) and Financial Markets Foundation for Children (2014-055 and 2016-310). MW was supported by Australian NHMRC Senior Research Fellowship 1046518 and Cure Kids New Zealand. The MCRI administered the research grants for the study and provided infrastructural support (IT and biospecimen management) to its staff and the study but played no role in the conduct or analysis of the trial. The Department of Social Services played a role in study design; however, no other funding bodies had a role in the study design and conduct; data collection, management, analysis and interpretation; preparation, review or approval of the manuscript; and decision to submit the manuscript for publication. Research at the MCRI is supported by the Victorian Government’s Operational Infrastructure Support Program.
Disclaimer The findings and views reported in this paper are those of the author and should not be attributed to DSS, AIFS or the ABS.
Competing interests All authors have completed the ICMJE uniform disclosure form at http://www.icmje.org/coi_disclosure.pdf and declare financial support as described in the funding section. MW received support from Sandoz to present at a symposium outside the submitted work.
Ethics approval The CheckPoint study protocol was approved by The Royal Children’s Hospital (Melbourne, Australia) Human Research Ethics Committee (33225D) and Australian Institute of Family Studies Ethics Committee (14–26).
Provenance and peer review Not commissioned; externally peer reviewed.
Data sharing statement The Longitudinal Study of Australian Children datasets and technical documents are available to researchers at no cost via a licence agreement. Data access requests are co-ordinated by the National Centre for Longitudinal Data. More information is available at https://dataverse.ada.edu.au/dataverse/lsac.
Patient consent for publication Not required.