Article Text

Abstract
Objective Limited research has assessed the association between patterns of body mass index (BMI) change across adulthood and mortality. We aimed to identify groups of individuals who followed specific group-based BMI trajectories across adulthood, using weight collected on three occasions and recalled data from early adulthood, and to examine associations with all-cause and cause-specific mortality.
Design Prospective cohort study.
Setting Melbourne, Australia.
Participants Adults (n=29 881) enrolled in the Melbourne Collaborative Cohort Study, who were aged from 40 to 70 years between 1990 and 1994, and had BMI data for at least three time points.
Outcome Deaths from any cause before 31 March 2017 and deaths from obesity-related cancers, cardiovascular diseases (CVDs) and other causes before 31 December 2013.
Results We identified six group-based BMI trajectories: lower-normal stable (TR1), higher-normal stable (TR2), normal to overweight (TR3), chronic borderline obesity (TR4), normal to class I obesity (TR5) and overweight to class II obesity (TR6). Generally, compared with maintaining lower-normal BMI throughout adulthood, the lowest mortality was experienced by participants who maintained higher-normal BMI (HR 0.90; 95% CI 0.84 to 0.97); obesity during midlife was associated with higher all-cause mortality even when BMI was normal in early adulthood (HR 1.09; 95% CI 0.98 to 1.21) and prolonged borderline obesity from early adulthood was also associated with elevated mortality (HR 1.16; 95% CI 1.01 to 1.33). These associations were stronger for never-smokers and for death due to obesity-related cancers. Being overweight in early adulthood and becoming class II obese was associated with higher CVD mortality relative to maintaining lower-normal BMI (HR 2.27; 95% CI 1.34 to 3.87).
Conclusion Our findings highlight the importance of weight management throughout adulthood to reduce mortality.
- public health
- epidemiology
- preventive medicine
This is an open access article distributed in accordance with the Creative Commons Attribution Non Commercial (CC BY-NC 4.0) license, which permits others to distribute, remix, adapt, build upon this work non-commercially, and license their derivative works on different terms, provided the original work is properly cited, appropriate credit is given, any changes made indicated, and the use is non-commercial. See: http://creativecommons.org/licenses/by-nc/4.0/.
Statistics from Altmetric.com
Strengths and limitations of this study
Multiple exposure assessments were used to derive trajectories in body mass index (BMI) across adulthood.
The analytic approach identified specific higher-risk BMI trajectories that would not have been identifiable using the conventional approach of grouping participants into categories of change.
We did not have information on weight between age 18 and 21 years and baseline, which limited us from identifying trajectories of how people gained weight between the two time points.
Introduction
Obesity is associated with increased risk of mortality,1–5 cardiovascular disease (CVD) and several cancers.6 7 Most of this evidence is based on anthropometric data collected at one time, typically in participants’ mid to late life at recruitment to a cohort. The importance of considering body mass as a time-varying exposure to account for changes over the lifespan has been highlighted.8 Some studies have assessed changes in body mass using predefined categories (eg, weight gain, weight stable, weight loss).9–14 This approach can introduce statistical bias by creating groups that reflect predominantly random variation and can fail to identify more complex patterns of change.15 One study used pictograms to assess body shape throughout life to create body shape trajectories.16 Stable lean body shape from age 5 to 50 years had the lowest mortality.16 Two studies using body mass index (BMI) found the lowest mortality for individuals consistently overweight during their mid to late life; the highest mortality was for obese individuals who gained weight17 and for thin individuals who lost weight.18 As these studies only used data from mid-adulthood onwards, they could not assess the effects of long-term obesity versus short-term obesity and its potential impact on mortality.
In this study, we used data from the Melbourne Collaborative Cohort Study (MCCS). We have previously reported on mortality in relation to baseline BMI and change in BMI over approximately 12 years.12 19 Here, we aimed to identify groups of individuals who followed specific BMI trajectories across adulthood, using weight collected on three occasions and recalled data from early adulthood, and to examine associations with all-cause and cause-specific mortality.
Methods
Study population
The MCCS is a prospective cohort study of 41 513 residents of Melbourne Australia with a mean age of 55 years at recruitment (99% aged between 40 and 69 years) from 1990 to 1994 (baseline). Southern European migrants were deliberately recruited to widen the range of social and lifestyle exposures. At baseline, data were obtained by physical measurements, a self-administered food frequency questionnaire20 and an interviewer-administered questionnaire on demographics, lifestyle and medical conditions. Further waves of data collection occurred from 1995 to 1998 (88% responded by mail or phone) and 2003–2007 (68% attended a study centre). Details about the cohort have previously been described.21
Participant and public involvement
Participants had no involvement in the design of the study. Results are disseminated to participants in annual newsletters.21
BMI assessment
Weight was recorded for four times (age 18–21 years, years 1990–1994, 1995–1998 and 2003–2007). At baseline, weight was measured following standard protocols22 and participants reported their weight at age 18–21 years. Weight was self-reported in 1995–1998 and measured in 2003–2007. To adjust for measurement error arising from using self-reported weight in 1995–1998, a correction was applied to data based on sex-specific and age-specific comparison of self-reported and measured weight in the Australian National Nutrition Survey.23 24 Recalled weight at age 18–21 years was not adjusted, because the correction formula might not be applicable to recalled weight. Height was measured at baseline. BMI was calculated as weight (kg) divided by square of height (m2).
Ascertainment of deaths
Deaths were ascertained through record linkage to the Victorian Registry of Births, Deaths and Marriages, and the National Death Index at the Australian Institute of Health and Welfare. Underlying cause of death was defined according to the International Classification of Diseases codes versions (ICD-10). When the cause was unknown, it was classified as ‘other’. Obesity-related cancer deaths were defined as those for which the International Agency for Research on Cancer classified the evidence for causality as sufficient: oesophagus adenocarcinoma, gastric cardia, colon and rectum, liver, gallbladder, pancreas, postmenopausal breast, corpus uteri, ovary, renal cell, meningioma, thyroid, multiple myeloma; or as limited: male breast cancer, fatal prostate cancer, diffuse large B-cell lymphoma.6
Participants selected for this analysis
We excluded participants if they were aged <40 or >70 years at baseline, were underweight (BMI <18.5 kg/m2) at baseline, were diagnosed with cancer before their last BMI measurement, had missing data for any confounding variables, had extreme BMI values at any time (BMI <15 kg/m2 or >45 kg/m2) or if they had BMI for fewer than three times to allow estimation of potentially non-linear trajectories. These exclusions left 29 881 participants (online supplementary figure 1).
Supplemental material
Statistical analysis
BMI trajectories
We used a semiparametric group-based trajectory model15 25 to identify latent homogeneity in participants’ BMI trajectories from early (age 18–21 years) to late adulthood. The model is an application of finite mixture modelling which assumes the population is composed of a mixture of groups following homogenous developmental courses.15 Longitudinal BMI data were fitted as a mixture of several latent trajectories in a censored normal model (allowing for the lower and upper BMI limits) with a polynomial function of age.25 We used the Bayesian information criterion (BIC) and the log Bayes factor to select optimal shapes and number of trajectory groups through a two-stage approach.15 First, the number of groups was determined assuming all trajectory groups were quadratic functions of age. Second, the preferred order of the polynomial (ie, linear or quadratic) for each trajectory was determined. Participants were assigned to the group for which their posterior predicted probability calculated from the final model was highest. The adequacy of the final model was evaluated using recommended diagnostic measures: average posterior probability of assignment for each group of 0.7 or higher; odds of correct classification of 5.0 or higher; the proportion of a sample assigned to a certain group close to the proportion estimated from the model and a reasonably narrow confidence interval (CI) around each trajectory.15
Association of BMI trajectories with mortality
Cox regression with age as the time scale26 was used to estimate HRs and 95% CIs for mortality for each trajectory group. Follow-up began at the date of last BMI assessment and ended at date of death, date when mortality data were complete (31 March 2017 for all-cause mortality and 31 December 2013 for cause-specific mortality), whichever came first. Models included birth cohort (<1930, 1930–1939, 1940–1949, ≥1950), height (continuous in cm), sex (male, female), country of birth (Australia/New Zealand/Northern Europe, Southern Europe), an area-based measure of socioeconomic position (Socioeconomic Indexes For Areas (SEIFA)) derived from the Australian Census27 (quintiles), highest level of education attained (primary school or lower, some high or technical school, completed high or technical school, completed tertiary education), smoking status at last BMI assessment (never, former, current) and these baseline covariates: alcohol drinking status (lifetime abstainer, former, current lower (1–39 g/day for male; 1–19 g/day for female), current higher (≥40 g/day for male; ≥20 g/day for female)), physical activity score (0, >0 and <4, ≥4 and <6, ≥6; computed from frequency of walking, vigorous and less vigorous exercise over the last 6 months28) and Mediterranean Diet Score (MDS; 0–3, 4–6, 7–9; detailed calculation is described elsewhere29).
Graphical checks based on log–log plots of survival and tests based on Schoenfeld residuals were used to examine the proportional hazards assumption. We stratified the Cox models on covariates that did not satisfy the proportional hazards assumption and fitted interactions between attained age and BMI trajectory for each trajectory that did not meet the assumption. The analyses were repeated after restriction to never smokers at last BMI assessment, because adjustment for smoking status may not be sufficient to control for confounding by smoking.5 30 31
We tested interactions between BMI trajectories and these factors using likelihood ratio tests: sex (male, female), country of birth (Australian/New Zealand/northern Europe, southern Europe), alcohol consumption (lifetime abstainer, former, current lower, current higher), history of diabetes (yes, no), history of heart diseases (yes, no), follow-up duration (<5 years, 5 to <10 years, ≥10 years) and baseline age (<60 years, ≥60 years).
We repeated the analysis excluding (1) the first 2 years of follow-up and (2) non-respondents for the 2003–2007 data collection. Finally, we compared the fit of the models with BMI trajectories and models with last BMI assessment to assess whether trajectory models had better fit than models using the conventional approach based on one BMI assessment. Last BMI measurements were categorised into six groups: underweight (BMI <18.5 kg/m2), lower normal (BMI ≥18.5 kg/m2 and <23 kg/m2), higher normal (BMI ≥23 kg/m2 and <25 kg/m2), overweight (BMI ≥25 kg/m2 and <30 kg/m2), class I obesity (BMI ≥30 kg/m2 and <35 kg/m2) and class II obesity (BMI ≥35 kg/m2).
Most participants excluded due to insufficient BMI records had baseline and recalled weight at age 18–21 years, but no BMI data in 1995–1998 and 2003–2007. To see whether selection of participants into the analysis was related to both BMI and death, we compared mean BMI (at age 18–21 years and at baseline) of participants who had three or more records with those who had fewer than three records; we also used unadjusted logistic regression to estimate the odds ratio (OR) of death for these two groups.
Statistical analyses were performed using Stata V.14.2. (Stata Corp., CollegeStation, Texas, USA).
Results
The analyses included 29 881 participants (17 475 never-smokers at the latest BMI assessment) (online supplementary figure 1). Six trajectories (TR) of BMI were identified and named according to their shapes in relation to the WHO classification of BMI32 (figure 1). Almost all participants (94%) had normal BMI at age 18–21 years (TR1, TR2, TR3 and TR5). Two-thirds had an increase in BMI to higher normal (TR2) or overweight (TR3) later in life. A smaller proportion maintained a lower-normal BMI (TR1, 19%) throughout adulthood. Few participants (13%) became obese in midlife (TR5 and TR6) or were consistently borderline obese (TR4; 3%). Model adequacy diagnostics are presented in the online supplementary table 1.
Supplemental material
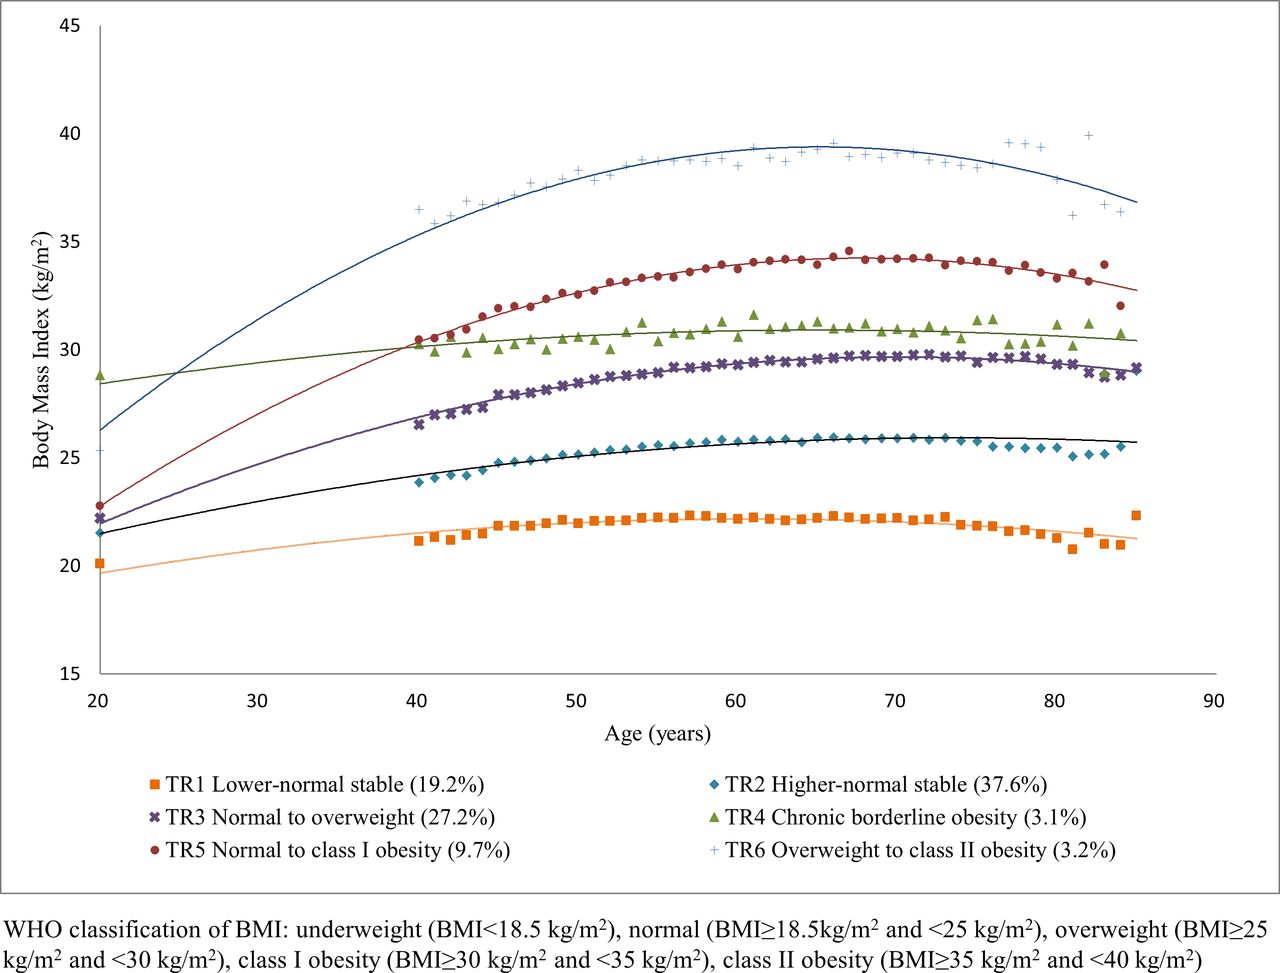
Body mass index (BMI) trajectories in the Melbourne Collaborative Cohort Study.
The proportion of participants in the highest SEIFA quintile (ie, most advantaged) and with the highest education decreased across TR1–TR6 (table 1). Compared with other trajectory groups, participants in the lower-normal stable trajectory (TR1) tended to follow a more Mediterranean diet, be more physically active and to drink alcohol. MDS, physical activity level and proportion of current alcohol drinkers gradually decreased across TR1–TR6. A higher proportion of people in the borderline obesity trajectory (TR4) had prevalent heart disease and diabetes at baseline.
Characteristics of participants by BMI trajectory groups in the Melbourne Collaborative Cohort Study
The table 2 presents HR between trajectories and mortality using stable lower-normal BMI trajectory (TR1) as the reference. All-cause mortality was slightly lower for the stable higher-normal BMI trajectory (TR2: HR 0.90, 95% CI 0.84 to 0.97); trajectories of chronic borderline obesity (TR4) and normal to class I obesity (TR5) had higher all-cause mortality (HR 1.16, 95% CI 1.01 to 1.33, and HR 1.09,95% CI 0.98 to 1.21, respectively). As the most obese trajectory (TR6) showed evidence of non-proportional hazards, we fitted an interaction between this trajectory and attained age and presented HRs for age 74, 80 and 85 (25th, 50th and 75th percentiles of age at death). For this trajectory, the HR was greater at younger attained age than at older attained age (from HR 1.31,95% CI 1.11 to 1.54 for age 74 years to HR 1.10, 95% CI 0.88 to 1.38 for age 85 years). In never-smokers, while the proportional hazards assumption was not violated, the same pattern (ie, weaker HRs with increasing age) was seen for TR6. The associations between obesity across adulthood (TR4, TR5 and TR6) and all-cause mortality were stronger than for the whole cohort (HR 1.25,95% CI 1.02 to 1.53, HR 1.19, 95% CI 1.03 to 1.37, and HR 1.42, 95% CI 1.13 to 1.78 for age 74 years to HR 1.16, 95% CI 0.88 to 1.54 for age 85 years, respectively).
HRs for all-cause mortality according to BMI trajectory groups in the Melbourne Collaborative Cohort Study, overall and in never-smokers
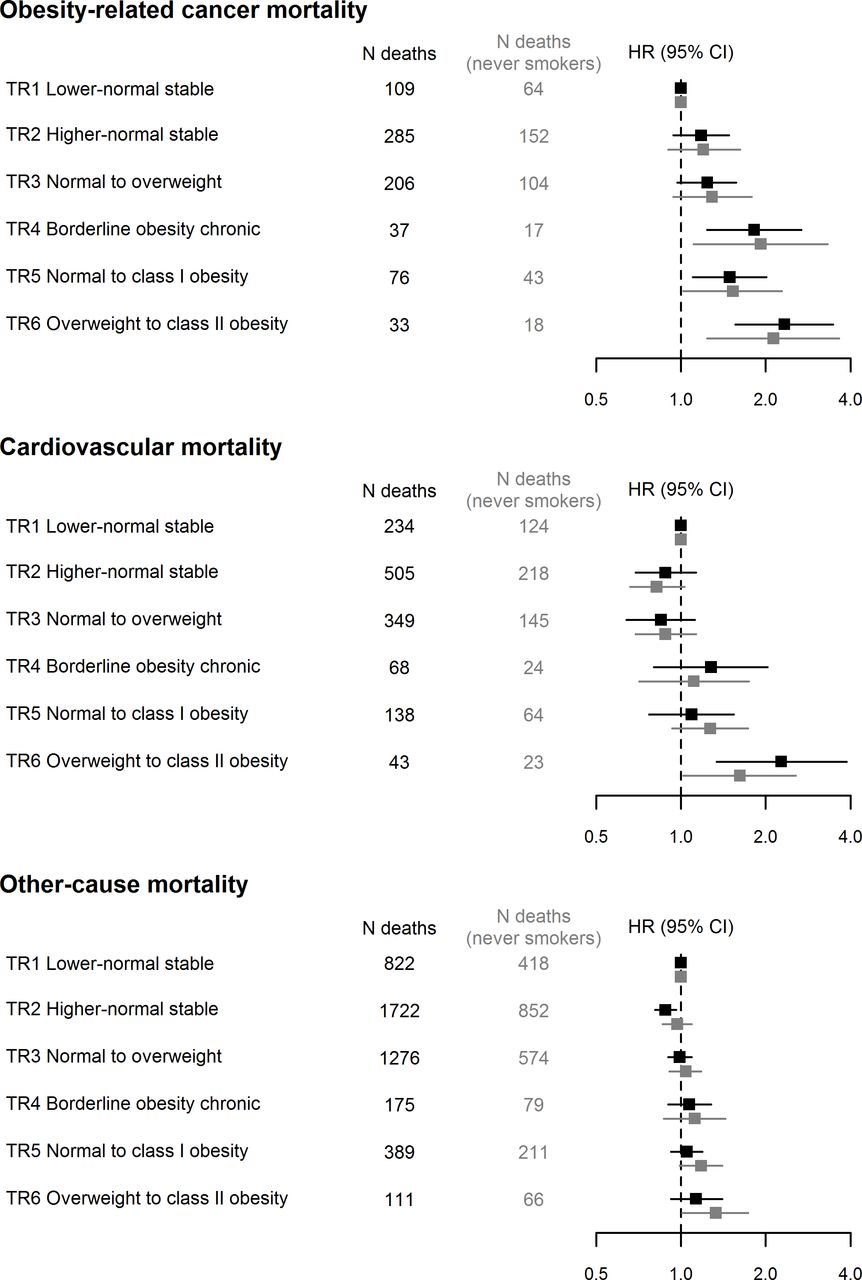
Being obese across adulthood (TR4, TR5 and TR6) showed stronger associations with mortality from obesity-related cancers than with all-cause mortality. Chronic borderline obesity (TR4) was associated with higher risk of death, especially from obesity-related cancers (HR 1.82, 95% CI 1.24 to 2.68 for all participants and HR 1.92, 95% CI 1.11 to 3.32 for never-smokers). The overweight to class II obesity trajectory (TR6) had increased risk of CVD mortality (HR 2.27, 95% CI 1.34 to 3.87 for the whole cohort; HR 1.62, 95% CI 1.02 to 2.56 for never-smokers). In general, BMI trajectories had weak associations with other-cause mortality (figure 2 and online supplementary table 2).

Forest plots of HRs for cause-specific mortality according to body mass index (BMI) trajectory groups in the Melbourne Collaborative Cohort Study, overall and in never-smokers.
For the analyses of all-cause mortality, there was no evidence of interaction between BMI trajectory and sex (p=0.2), country of birth (p=0.3), alcohol consumption (p=0.7), history of diabetes (p=0.2), history of heart diseases (p=0.3), follow-up duration (p=0.1) or baseline age (p=0.2). HRs were similar after excluding the first 2 years of follow-up (results not shown). After excluding participants who had no 2003–2007 data, HRs for cause-specific mortality were generally similar (online supplementary table 3), but with wider CIs; the most obese trajectory (TR6) interacted with attained age overall and in never-smokers for all-cause mortality (table 3).
HRs for all-cause mortality according to BMI trajectory groups in the Melbourne Collaborative Cohort Study, overall and in never-smokers, excluding participants who did not attend 2003–2007 data collection
Models including BMI trajectories fitted slightly better than those with last-measured BMI according to the Akaike information criterion and Bayesian information criterion (online supplementary table 4).
Participants with fewer than three BMI records had higher mean BMI at age 18–21 years (22.4 kg/m2 and 21.9 kg/m2, respectively; p<0.0001) and at baseline (28.3 kg/m2 and 26.7 kg/m2, respectively; p<0.0001) than those who had at least three records. They also had higher odds of all-cause mortality (OR 2.06, 95% CI 1.93 to 2.21).
Discussion
Most participants had normal BMI at the age of 18–21 years. We identified six BMI trajectories. Most participants maintained a higher-normal BMI throughout adulthood or gained weight from higher-normal to become overweight. Only a small proportion of people developed class II obesity in mid to late life. Generally, the lowest mortality was experienced by participants who maintained higher-normal BMI throughout adulthood. Participants who were obese across the midlife had elevated all-cause mortality, even if they had normal BMI at younger age as did those who had prolonged exposure to borderline obesity. These associations were stronger for never-smokers and for obesity-related cancer deaths. Being overweight in early adulthood and becoming class II obese was associated with higher CVD mortality.
The key strength of our study is availability of weight at multiple times, which was used to derive trajectories in BMI across adulthood. This approach allowed us to categorise BMI over time into homogeneous groups and to identify a specific higher-risk group (ie, prolonged borderline obesity trajectory) that would not have been identifiable using the conventional approach of grouping participants into categories of change.
Several limitations should be noted. For some trajectories, there were few cause-specific deaths, with corresponding wide CIs. Recalled weight at age 18–21 years may be subject to measurement error. However, previous studies have generally found moderate to strong correlation between measured weight in young adulthood and recalled weight for the same age 32–56 years later.33 34 We did not have information on potential confounders at age 18–21. We also had no information on weight between age 18–21 years and baseline (20–50 years later), which limited us from identifying trajectories of how people gained weight after age 18–21 years and before entering the study in midlife. Participants excluded due to insufficient BMI records had higher BMI at age 18–21 and baseline. Having insufficient BMI records was also associated with higher odds of dying. Therefore, we may have underestimated the effect of obese trajectories on all-cause mortality.
Participants were mostly born before 1950. Few people (2%) had BMI of 30 or higher at age 18–21 years. Hence, we were not able to estimate the effect of sustained obesity from young adulthood. The prevalence of overweight in Australia has increased in cohorts born since 1960; the mean BMI has been higher for each successive birth cohort at any given age.35 The prevalence of childhood overweight and obesity has also increased globally.36–38 In Australia, the proportion of obese individuals at age 18–21 years was almost double in people born in 1994–1997 (15.2%) compared with their counterparts born 20 years earlier (8%).39 The projected increase of obesity prevalence in young adults40 also suggests that potential higher-risk trajectories of chronic and severe obesity may emerge. Therefore, it is expected that more people in future generations will have higher BMI for longer durations. Conventional analytic approaches using a single BMI assessment or an a priori categorisation of body size changes could overlook these potential high-risk groups. Trajectories models may help differentiate people who have been obese long term from those who become obese later in life.
Some studies have reported lower all-cause mortality in overweight individuals than for normal weight individuals.2 5 However, we did not observe lower risk of death in participants who were overweight in midlife (TR3). The US Health and Retirement Study (HRS) modelled BMI trajectories from 51 to 77 years for adults aged 51–61 years at baseline and found that people with sustained overweight had the lowest all-cause mortality.17 The National Survey of the Japanese Elderly identified no obesity in trajectories in an Japanese population aged 60 years and older, with only 5% ‘overweight stable’ individuals.18 The lowest risk of death was observed for participants with sustained overweight overall, but not in non-current smokers.18 However, these two studies only used BMI data in mid to late life. A study of health professionals in the USA using earlier life (age 5–50 years) body shape pictograms found that people remaining lean had the lowest mortality; people who experienced a marked increase from lean to heavy had a higher risk; whereas people who had been heavy since childhood were at highest risk.16 However, many participants in the study were not obese according to their BMI, even when they were classified as ‘heavy’ based on pictogram. Possible measurement errors in body shape data (ie, combining recalled somatotypes with BMI-predicted somatotypes) may have affected their trajectory shapes. Nevertheless, their results showed that larger body shapes from childhood are likely to persist into adulthood, that being consistently heavy is associated with increased risk of death from all-cause, CVD and cancer, and the increased risk was stronger for never-smokers.16 Another study of 70 000 men showed that both ‘normal to obese’ and ‘overweight to obese’ adulthood BMI trajectories were associated with higher mortality from fatal prostate cancer compared with stable normal BMI trajectory.41
In our study, participants who had long-term borderline obesity also had increased risk of death compared with lower-normal BMI trajectory. Long-term obesity gives longer exposure to proinflammatory adipocytokines released by adipose tissue, which can lead to pathophysiological alterations such as dyslipidaemia, hypertension, fibrinolysis, inflammation, insulin resistance and immune system alterations.7 42 43 Obesity also increases bioavailable estrogens (via aromatisation, the conversion of adrenal androgens to estrone, in adipose tissue),44 45 a contributing factor to breast and gynaecological cancers. Long-term obesity may also be associated with partial exhaustion of the beta cell and insulinopenia which might cause depressed glucose oxidation and impaired glucose tolerance.46 Longer duration of obesity is associated with several adverse health consequences that could contribute to increased mortality, including unfavourable biomarker profiles as indicated by higher C-peptide and lower insulin-like growth factor-binding protein 1 concentrations,47 type 2 diabetes,48 49 cancer41 50–52 and CVD.53
A systematic review of studies using baseline BMI showed that all-cause mortality was higher for older people who had a BMI <23.0 kg/m2.54 In older populations such as the National Survey of the Japanese Elderly, most people followed trajectories with a gradual decline in BMI over time.18 Relative to the ‘mid-normal decreasing’ group, all-cause mortality was higher in the ‘low-normal decreasing’ group (HR 1.17; 95% CI 1.02 to 1.33) and lower in the ‘high-normal decreasing’ group (HR 0.82; 95% CI 0.72 to 0.93). This suggests that for older people experiencing weight loss, a higher initial BMI may be protective. In our study, the estimated effect of being overweight in early adulthood and gaining weight in midlife (TR6) declined with age. This is consistent with the results of a study investigating weight change with different initial BMI levels in relation to all-cause mortality in older Americans.11 The authors found that compared with having a stable weight, even a small weight loss in the elderly was associated with increased mortality in normal weight, overweight and even mildly obese individuals.11 This association was stronger when initial BMI was lower.11 Similarly, in a previous analysis of weight change and mortality using the MCCS, weight loss from 1990 to 1994 to 2003–2007 (ie, in later adulthood) was associated with higher risk of death.12 Weight loss in older people can be an indicator of undesirable health conditions such as sarcopenia,55 or a more severe disease state.56 Individuals with higher body weight may tolerate weight loss better than individuals with a normal body weight because of higher metabolic reserves and body fat.56 Measures of body composition and fat distribution are needed to capture more adequately the relationship of adiposity and lean mass to health risks in older populations.57
Conclusion
Midlife obesity was associated with higher mortality even when BMI was normal in early adulthood. This highlights the importance of weight management throughout adulthood. Prolonged borderline obesity was also associated with elevated risk of death from all-causes and obesity-related cancers relative to maintaining lower-normal BMI across adulthood. Since chronic obesity will likely be a major health issue for future generations, policies and prevention programmes are needed to target obesity starting early in life.
Acknowledgments
YY is supported by a Melbourne Research Scholarship from the University of Melbourne. BL is supported by a fellowship from the National Breast Cancer Foundation (ECF-15-012). Cohort recruitment of the MCCS was funded by Cancer Council Victoria (http://www.cancervic.org.au/) and VicHealth (http://www.vichealth.vic.gov.au/). The MCCS was further supported by grants 209057, 251553 and 504711 from the Australian National Health and Medical Research Council (NHMRC) (http://www.nhmrc.gov.au/) and ongoing follow-up and data management has been funded by Cancer Council Victoria since 1995.
References
Footnotes
Contributors YY, PAD, BL, AH and DRE conceived and planned the project. YY performed the statistical analyses and drafted the manuscript with support from PAD, BL, AH and DRE. AK, RMI, RM and GGG provided critical feedback and helped shape the research, analysis and the final manuscript. GGG conceived the overall study. All authors approved the final manuscript.
Funding YY is supported by a Melbourne Research Scholarship from the University of Melbourne. BML is supported by a fellowship from the National Breast Cancer Foundation (ECF-15-012).
Competing interests None declared.
Patient consent for publication Not required.
Ethics approval The research protocol was approved by Cancer Council Victoria’s Human Research Ethics Committee.
Provenance and peer review Not commissioned; externally peer reviewed.
Data availability statement All data relevant to the study are included in the article or uploaded as supplementary information.