Article Text

Abstract
Objectives Develop simple and valid models for predicting mortality and need for intensive care unit (ICU) admission in patients who present at the emergency department (ED) with suspected COVID-19.
Design Retrospective.
Setting Secondary care in four large Dutch hospitals.
Participants Patients who presented at the ED and were admitted to hospital with suspected COVID-19. We used 5831 first-wave patients who presented between March and August 2020 for model development and 3252 second-wave patients who presented between September and December 2020 for model validation.
Outcome measures We developed separate logistic regression models for in-hospital death and for need for ICU admission, both within 28 days after hospital admission. Based on prior literature, we considered quickly and objectively obtainable patient characteristics, vital parameters and blood test values as predictors. We assessed model performance by the area under the receiver operating characteristic curve (AUC) and by calibration plots.
Results Of 5831 first-wave patients, 629 (10.8%) died within 28 days after admission. ICU admission was fully recorded for 2633 first-wave patients in 2 hospitals, with 214 (8.1%) ICU admissions within 28 days. A simple model—COVID outcome prediction in the emergency department (COPE)—with age, respiratory rate, C reactive protein, lactate dehydrogenase, albumin and urea captured most of the ability to predict death. COPE was well calibrated and showed good discrimination for mortality in second-wave patients (AUC in four hospitals: 0.82 (95% CI 0.78 to 0.86); 0.82 (95% CI 0.74 to 0.90); 0.79 (95% CI 0.70 to 0.88); 0.83 (95% CI 0.79 to 0.86)). COPE was also able to identify patients at high risk of needing ICU admission in second-wave patients (AUC in two hospitals: 0.84 (95% CI 0.78 to 0.90); 0.81 (95% CI 0.66 to 0.95)).
Conclusions COPE is a simple tool that is well able to predict mortality and need for ICU admission in patients who present to the ED with suspected COVID-19 and may help patients and doctors in decision making.
- COVID-19
- public health
- accident & emergency medicine
- epidemiology
Data availability statement
Data are available on reasonable request. The data that support the findings of this study are available on request from the corresponding author. The data are not publicly available due to data transfer agreements with each of the contributing hospitals.
This is an open access article distributed in accordance with the Creative Commons Attribution Non Commercial (CC BY-NC 4.0) license, which permits others to distribute, remix, adapt, build upon this work non-commercially, and license their derivative works on different terms, provided the original work is properly cited, appropriate credit is given, any changes made indicated, and the use is non-commercial. See: http://creativecommons.org/licenses/by-nc/4.0/.
Statistics from Altmetric.com
Strengths and limitations of this study
We used a large representative sample of patients who presented at the emergency department with suspected COVID-19 and were admitted to hospital in the first wave of the pandemic (n=5831) to develop a tool for predicting death and need for intensive care unit (ICU) admission (‘COVID outcome prediction in the emergency Department’ (COPE)).
COPE is based on quickly and objectively obtainable predictors, in contrast with previously proposed models.
COPE discriminated well and was well-calibrated in temporal and geographical validation in second wave patients of the pandemic (n=3235).
For patients above the age of 70, the need for ICU admission probably differed from observed decisions on ICU admission and required extrapolation of the age effect.
External validation of COPE in hospitals that were not present in the development data is required.
Background
The COVID-19 pandemic is putting extraordinary pressure on emergency departments (EDs), clinical wards and intensive care units (ICUs). Clinical prediction models for COVID-19 outcomes have the potential to support decision making about hospital admission. Existing models that predict mortality for non-trauma patients presenting to the ED are unlikely to be well calibrated and optimally discriminating for patients with COVID-19.1 Most currently available models specifically developed for patients with COVID-19 that were assessed with the prediction model risk of bias assessment tool contain a high risk of bias.2–4 The most common reasons were non-representative selection of control patients, exclusion of patients in whom the event of interest was not observed by the end of the study, high risk of model overfitting and vague reporting. Additionally, the description of the study population or intended use of the models was often missing, and calibration of the model predictions was rarely assessed.
The recently proposed 4C Mortality Score is probably at low risk of bias, but was derived from a selected population of patients admitted to UK hospitals who were seriously ill (mortality rate of 32.2%). Predictors included the number of comorbidities and the Glasgow Coma Scale, items that are not easily and unambiguously obtained for patients with suspected COVID-19 at EDs everywhere.5 6 Similarly, the promising risk scores Veterans Health Administration COVID-19 (VACO) and COVID-GRAM—predicting 30-day mortality in positively tested patients and critical illness in hospitalised patients, respectively—require knowledge on pre-existing comorbidities.7 8 The COVID-GRAM model also requires chest radiography results.
We aimed to develop and validate a simple and valid model for predicting mortality and the need for ICU in all patients who are suspected to have COVID-19 when presenting at the ED. To facilitate implementation in clinical practice, we only included quickly and objectively obtainable patient characteristics, vital parameters and blood test values.
Methods
Population
Nineteen large Dutch hospitals were requested to supply anonymised retrospective data on the cohorts of patients with COVID-19 who were admitted to their hospital. Of those hospitals, Catharina Hospital Eindhoven, Zuyderland Medical Center Heerlen, Isala Clinics Zwolle, Erasmus University Medical Center Rotterdam and Antonius Hospital Sneek supplied these data. The data from Antonius Hospital Sneek were not used in the analyses, because of large proportions of missing predictor values.
For model development, we used the data of patients who presented at the ED and were admitted to the hospital with suspected COVID-19 in the first wave of the pandemic, that is, from March up to and including August 2020. Patients being transferred to other hospitals were excluded since information on outcomes was missing. For model validation, we used data of patients who presented at the ED and were admitted to the hospital with suspected COVID-19 in the second wave of the pandemic, that is, from September up to and including December 2020. Potential multiple hospital admissions of the same patient were considered as independent hospital admissions.
Outcomes
The outcomes of interest were: (1) in-hospital death or transfer to a hospice within 28 days after hospital admission and (2) admission to ICU within 28 days after hospital admission.
Predictors
Based on prior literature, we included patient characteristics (sex, age, body mass index), vital parameters (oxygen saturation, systolic blood pressure, heart rate (HR), respiratory rate (RR), body temperature) and blood test values (C reactive protein (CRP), lactic dehydrogenase (LDH), D-Dimer, leucocytes, lymphocytes, monocytes, neutrophils, eosinophils, Mean Corpuscular Volume (MCV), albumin, bicarbonate, sodium, creatinine, urea), all measured at ED admission, as potential predictors.2 Furthermore, we included the month of admission to capture potential changes in outcomes over time. In case of multiple measurements for the same patient, we used the first measurement after presentation at the ED. We used multivariate imputation by chained equations (R-packages mice) for multiple imputation of missing predictor values.9 10 Multiple imputation in the validation data was undertaken separately from multiple imputation in the development data to ensure fully independent model validation.
Model development
Logistic regression was used to analyse associations between predictors and outcomes. We decided on including non-linear transformations of potential predictors on the basis of a full model with a restricted cubic spline (three knots; two regression coefficients) for each continuous predictor.11 12 Based on Wald statistics, we selected the most promising predictors into a parsimonious model for easy use in clinical practice. To prevent overfitting, we used bootstrap validation—including the same variable selection strategy to mimic our modelling strategy—to estimate a uniform shrinkage factor.12 The regression coefficients of the final model were multiplied by this shrinkage factor, and the model intercept was adjusted to ensure overall calibration of the model. We used the R-package rms (Regression Modelling Strategies) for regression analyses.9 13
Model validation
Model performance was assessed with temporal validation in second wave patients, in each of the four separate hospitals. We assessed discriminative ability with the area under the receiver operating characteristic curve (AUC) and calibration with calibration plots of five equally sized groups of predicted risk, calibration intercepts and calibration slopes. The model-based concordance (mbc) was used to understand the impact of potential differences in casemix heterogeneity between the development and validation data on discriminative ability.14
Patient and public involvement
Patients were not directly involved in the design of this study. The outcome of interest and the potential predictors were selected up front by a group of hospital physicians caring for patients with COVID-19 (ED, internal medicine, pulmonary medicine, ICU). Since we retrospectively collected data, patients were not burdened by our study. In future research, we will convene multistakeholder panels of approximately 12 members including patients with COVID-19, relatives, hospitals physicians caring for patients with COVID-19, palliative care physicians and ethicists, with the aim to develop a full understanding of how the models may best support patients and clinicians in making critical patient-centred decisions.
Results
Population and outcomes
The database contained 5912 patients who presented at the ED from March up to and including August 2020 and who were admitted to the hospital with a suspicion of COVID-19. Of those patients 81 (1.4%) were excluded because of a transfer to other hospitals (outcome not recorded). The development data included 5831 patients of whom 629 (10.8%) died, 5070 (86.9%) were discharged within 28 days after hospital admission, and 132 (2.3%) were still in hospital at 28 days after admission. Patients who died—in comparison with patients who were discharged—tended to be more often male (64% vs 56%), at older age (median 78 vs 69), with higher RR (median 23 vs 19) and HR (median 93 vs 90), lower oxygen saturation (median 94.1 vs 96.0), higher blood levels of CRP (median 91 vs 43), LDH (median 338 vs 237), creatinine (median 102 vs 82) and urea (median 9.6 vs 6.2) and lower blood levels of lymphocytes (median 0.80 vs 1.10) and albumin (median 36 vs 40) (table 1). Similar patterns were seen in 3252 patients who were admitted to hospital in the second wave of the pandemic from September up to and including December 2020, of whom 326 (10.0%) died, 2854 (87.8%) were discharged within 28 days after admission, and 72 (2.2%) were still in hospital at 28 days after admission.
Baseline characteristics of development and validation patient cohorts median (‘M’) and quartile range (‘Q1’=first quartile; ‘Q3’=third quartile) are presented for all continuous variables
Admission to ICU was fully recorded—including ICU admissions at a later time point than the initial hospital admission—for 2633 patients in 2 hospitals (214 ICU admissions within 28 days (8.1%)) in the first wave of the pandemic. Patients who were admitted to the ICU—in comparison with patients who were discharged or died without being admitted to the ICU—tended to be more often male (68% vs 57%), with higher RR (median 23 vs 19) and HR (median 91 vs 88), lower oxygen saturation (median 95.0 vs 95.8), higher blood levels of CRP (median 88 vs 47), LDH (median 318 vs 234), creatinine (median 93 vs 84) and urea (median 7.1 vs 6.6) and lower blood levels of albumin (median 38 vs 40) (table 2). In contrast with patients who died, patients who were admitted to the ICU were not older than patients who were discharged (median 68 vs 71), probably due to decisions not to admit frail patients to the ICU. Patterns were similar in 1466 patients (86 ICU admissions within 28 days (5.9%)) who were admitted to these 2 hospitals in the second wave of the pandemic.
Baseline characteristics of development and validation patient cohorts of two hospitals with a full record of ICU admissions median (‘M’) and quartile range (‘Q1’=first quartile; ‘Q3’=third quartile) are presented for all continuous variables
Prediction of death
Patients who were admitted in the first month of the pandemic in the Netherlands, that is, in March 2020, were at substantially increased risk of death (table 3: multivariable OR 1.99; 95% CI 1.61 to 2.47). All models included this correction factor for the first month, to avoid overestimation of risk after the first month of the pandemic. Consequently, to avoid overestimation of the discriminative ability, we limited validation of models in the development data to patients who were admitted from April 2020 onward.
Univariable and multivariable associations between predictors and death within 28 days OR with 95% CIs for separate variables (columns ‘univariable’), for a model with all available predictors (columns ‘full model’) and for a model with only the six strongest predictors (columns ‘selected model’)
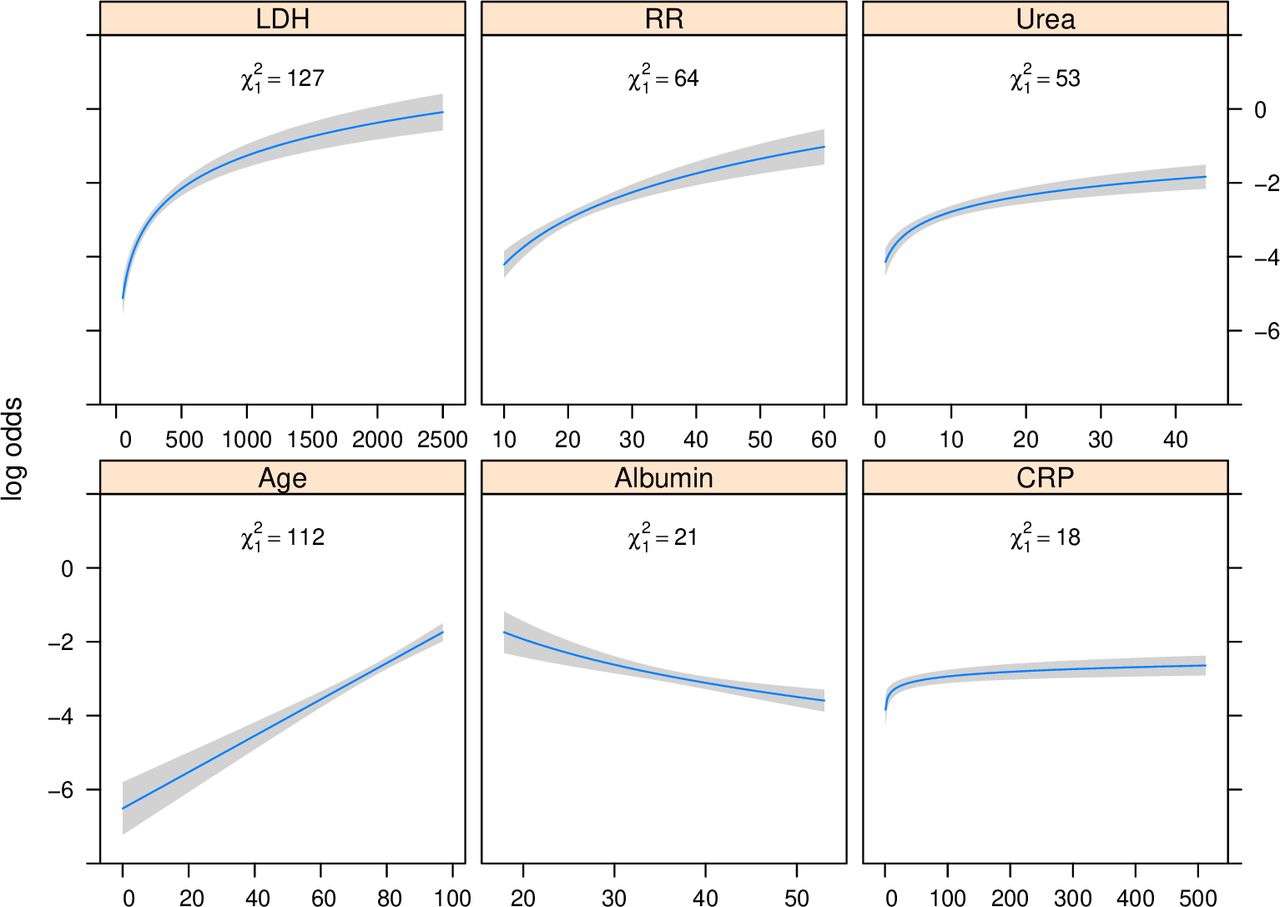
D-dimer concentration in the blood, measured to detect thrombosis, was not analysed in the regression analysis, because 64% and 76% were missing in the development and validation data, respectively (table 1). Based on a full model with restricted cubic splines of all potential variables, we decided to transform all biomarkers and RR with the natural logarithm, while keeping all other predictor effects linear. Some strong univariable associations with death—for example of logarithmically transformed lymphocytes and creatinine (table 3; Wald statistics 48 and 133, respectively)—were very weak in multivariable analysis (table 3; Wald statistics 0 and 4, respectively). The predictive ability of the resulting full multivariable regression model was mainly driven by age, LDH, urea, RR, CRP, Albumin, oxygen saturation and bicarbonate (ORs and Wald statistics in table 3). A simple model—named COVID outcome prediction in the emergency department (COPE)—with linear age and logarithmic transforms of RR, CRP, LDH, albumin and urea captured most of the ability to predict death within 28 days (table 3; figure 1). Based on internal bootstrap validation, we applied a shrinkage factor of 0.93 to the regression coefficients.

Multivariable effects of continuous predictors of death within 28 days predictions of the logarithm of the odds by continuous predictor levels, with other predictor levels set to the median. Wald statistics are listed within each plot to express variable importance (higher is better). CRP, C reactive protein; LDH, lactic dehydrogenase; RR, respiratory rate.
COPE showed good discrimination for predicting death in 4498 patients who were admitted from April up to and including August 2020 in the first wave (online supplemental figure 1); AUC in 4 hospitals 0.85 (95% CI 0.81 to 0.88)); 0.81 (95% CI 0.71 to 0.91); 0.86 (95% CI 0.82 to 0.90); 0.85 (95% CI 0.81 to 0.88)) and, more importantly, in the validation sample of 3235 patients who were admitted in the second wave from September up to and including December 2020 (figure 2; AUC in four hospitals: 0.82 (95% CI 0.78 to 0.86); 0.82 (95% CI 0.74 to 0.90); 0.79 (95% CI 0.70 to 0.88); 0.83 (95% CI 0.79 to 0.86)). The decrease in AUC over time was partly driven by less case mix heterogeneity—expressed by a lower model-based AUC (mbc)—of second wave patients (figure 2; mbc in four hospitals: 0.81; 0.82; 0.81; 0.82) as compared with first wave patients (online supplemental figure 1); mbc in four hospitals 0.82; 0.85, 0.83, 0.84). COPE was well calibrated in second wave patients of each of the four hospitals, both on average—expressed by hospital-specific calibration intercepts: 0.08 (95% CI −0.15 to 0.30); −0.17 (95% CI −0.65 to 0.30); −0.01 (95% CI −0.40 to 0.39); −0.12 (95% CI −0.30 to 0.07)—and by predicted risk levels—expressed by hospital-specific calibration slopes: 1.09 (95% CI 0.86 to 1.31); 0.90 (95% CI 0.49 to 1.32); 0.91 (95% CI 0.57 to 1.25); 0.97 (95% CI 0.79 to 1.14) (figure 2).
Supplemental material

Temporal validation: Performance of COPE for predicting death in second wave patients calibration plots of patients who were admitted since September 2020 in four separate Dutch hospitals. n is number of patients; a=calibration intercept (0 is perfect); b=calibration slope (1 is perfect); c=AUC (0.5 is useless; 1 is perfect); mbc=model-based AUC. AUC, area under the curve; COPE, COVID-19 outcome prediction in the emergency department.
When stratifying second wave patients according to a mortality risk threshold equal to the event rate (10%), COPE assigned high risk to 246/326 patients who actually died (76% sensitivity, ie, 24% false negatives) and low risk to 2086/2926 patients who actually survived (71% specificity, ie, 29% false positives). With a 5% risk threshold, the sensitivity increased to 93% while the specificity decreased to 49%. Based on a 20% risk threshold, the sensitivity decreased to 49% while the specificity increased to 89%.
Prediction of need for ICU admission
The probability of being admitted to the ICU was decreasing with age after the age of 70 (OR of age ≥80 vs 70–79: 0.17 (95% CI 0.10 to 0.30)), likely reflecting the decision not to admit older patients to the ICU. When adjusting for this decreasing age effect after the age of 70—by including a linear spline with a knot at age 70 in the regression model (online supplemental figure 2)—the strongest predictors of death were also predictive of ICU admission within 28 days, but associations were generally weaker for the latter (table 4 vs table 3). In patients below the age of 70, admitted from April up to and including August 2020, a model with the linear predictor of death calibrated to ICU admission had similar discriminative ability to a model that refitted all the predictor effects (AUC 0.71 for both models). For robustness, we implemented the calibrated model, also adjusted for a linearly decreasing age effect after the age of 70, and not the refitted model (calibration slope 0.60; 95% CI 0.49 to 0.70) into COPE for predicting ICU admission. To predict the need for ICU admission of future patients over the age of 70 COPE ignores the decreasing age effect after the age of 70, since the observed ICU admission rate is probably an inaccurate estimate of the medical need for ICU admission. By fitting a linearly decreasing age effect in patients over the age of 70 which is not applied when predicting for future patients, predictions of ICU admission after the age of 70 are based on an extrapolation of the observed age effect on ICU admission in patients below the age of 70. Due to the weaker predictor effects, the discriminative ability of COPE was more moderate for predicting ICU admission than for predicting death (online supplemental figure 3); AUC in two hospitals: 0.66 (95% CI 0.58 to 0.74); 0.79 (95% CI 0.69 to 0.88)). Although COPE significantly overestimated ICU admission in second wave patients (figure 3; calibration intercept in two hospitals: −0.41 (95% CI −0.77 to −0.05); −0.72 (95% CI −1.34 to −0.11)), it was better able to identify the patients at high risk of needing ICU admission, as expressed by higher discriminative ability (figure 3; AUC in two hospitals: 0.84 (95% CI 0.78 to 0.90); 0.81 (95% CI 0.66 to 0.95)) and substantially stronger predictor effects (calibration slope in two hospitals: 1.55 (95% CI 1.03 to 2.06); 1.53 (95% CI 0.60 to 2.46)).

Temporal validation: performance of COPE for predicting ICU admission in second wave patients calibration plots of patients who were admitted since September 2020 in two separate Dutch hospitals. n is number of patients; a=calibration intercept (0 is perfect); b=calibration slope (1 is perfect); c=AUC (0.5 is useless; 1 is perfect); mbc=model-based AUC. AUC, area under the curve; COPE, COVID-19 outcome prediction in the emergency department; ICU, intensive care unit.
Multivariable associations between predictors and ICU admission within 28 days OR with 95% CIs for separate variables (columns ‘univariable’) and for a model with the six strongest predictors of death, corrected for a decreasing probability of ICU admission after the age of 70 (columns ‘multivariable’)
Model presentation
The resulting COPE models for predicting death as well as need for ICU admission within 28 days after hospital admission (formulas in table 5) are implemented as a publicly accessible web-based application (https://mdmerasmusmc.shinyapps.io/COPE/) and as independent mobile apps (‘COPE Decision Support’). For optimal transparency, the web and mobile applications include a detailed description of the derivation of COPE (online supplemental file 1), descriptions of the data that were used for development and validation of COPE, and calibration plots of temporal validation in the separate hospitals.
COPE definition
According to the Transparent Reporting of a multivariable prediction model for Individual Prognosis Or Diagnosis checklist (online supplemental table 1), all relevant items are covered in this manuscript, except for the availability of data sets.15 16 The data that support the findings of this study are available on request from the corresponding author. The data are not publicly available due to data transfer agreements with each of the contributing hospitals.
Discussion
We developed COPE for prediction of in-hospital death and need for intensive care when patients with suspected COVID-19 present at the ED. Developed using patient data from the first wave of the pandemic, based on six quickly and objectively obtainable predictors when entering the ED—age, RR, LDH, CRP, albumin and urea—COPE discriminated well and was well calibrated in patients admitted to hospitals in the second wave of the pandemic, both for predicting in-hospital death and for ICU admission.
The clinical presentation of COVID-19 is broad and varies from asymptomatic to critical disease. Some patients who initially have mild symptoms progress to severe disease within 1 week.17 In the ED physicians need to identify high-risk patients—that is, those at high risk of deterioration and/or death—requiring treatment in the ICU, intermediate-risk patients requiring admission to the clinical ward, and low-risk patients who can potentially be sent home. Since COPE is based on data that are routinely measured, or at least readily available in the ED, it can act as a tool to support such decisions. Hospitalised patients who are at high risk for mortality or need for ICU admission should be more intensively watched, and when a high load of high-risk patients occurs in the ED, this should be taken into account in the ICU capacity planning. COPE does not explicitly define treatment decisions based on risk thresholds, such as: send the patient home when the mortality risk is below a risk threshold of x%, or: admit the patient to the ICU over a mortality risk threshold of y%. These currently unavailable risk thresholds, and hence the resulting treatment decisions, depend on a trade-off between benefits and harms (including costs) of hospital or ICU admission.18 Further research is necessary to better understand the benefits and harms of hospital admission and of ICU admission, for individual patients with COVID-19.19 Furthermore, treatment decisions may depend on the availability of resources. The decision to admit a patient to the hospital, or even to the ICU, may depend on the availability of hospital beds and ICU beds. Likewise, the decision to send a low-risk patient home may depend on the availability of relatives who are willing to care for the patient at home. Although it is currently not possible to define explicit risk-based treatment decisions for patients with COVID-19, the risk predictions provided by COPE can be factored in by doctors, patients and relatives, when making decisions about hospital or ICU admission.
We requested 19 large Dutch hospitals to supply anonymised retrospective data on the cohorts of patients with COVID-19 who were admitted to their hospital. This request for data was sent out very early in the pandemic and was greeted with enthusiasm. Probably due to the enormous pressure on healthcare at that time, four hospitals supplied useable data for the analysis. The contributing hospitals were well spread over the Netherlands, with one in the west, two in the south and one in the east of the country and are a mix of academic and large teaching hospitals. we believe they are representative for healthcare in the Netherlands. Although the consistently good performance of COPE across the hospitals may support its generalisability to other countries, geographical validation would be additionally reassuring, since the epidemic, and clinical practice—for example, access to ICU or other enhanced care—for this novel disease, may have substantial intercountry variability.
COPE was developed based on 5831 patients of whom 629 died within 28 days. This effective sample size of 629 events was ample to start the development process with a full model of 45 regression coefficients (14 events per variable), that is, one binary predictor (sex) and 22 continuous predictors with 2 regression coefficients—due to using non-linear terms—each.20 To prevent too extreme predictions of COPE in new data, we applied a shrinkage factor to its regression coefficients, based on a bootstrap procedure with backward selection starting from the full model.12
Our explicit aim was to develop a score based on quickly and objectively obtainable predictors at presentation at the ED. Consequently, pre-existing comorbidities, the level of consciousness measured by the Glasgow Coma Scale, and chest radiography results—although predictive for outcomes of patients with COVID-19 in other studies—were not considered here.5 7 8 Some predictors were promising in univariable analysis, such as lymphocytes and creatinine, but had negligible effects in multivariable analysis, because of strong correlations with other, more important predictors. Other predictors, such as oxygen saturation and bicarbonate, were significantly associated with death in multivariable analysis, but were not selected into the final model, since our explicit aim was to develop a simple model and the incremental value of these predictors was minimal. To achieve this aim, we only selected the strongest predictors—age, RR, LDH, CRP, albumin and urea—resulting in a parsimonious but well-performing model.
We aimed to predict outcomes for all patients who present to the ED with suspected COVID-19, regardless of actual hospital admission. Our data were limited to patients who presented at the ED and were admitted to hospital, because their outcomes were captured in the retrospective hospital database, while outcomes of patients who were sent home were not captured in the retrospective hospital database. Nevertheless, over 90% of the patients who presented to the ED with suspected COVID-19 were admitted to hospital and it is reasonable to assume that our predictions can be extrapolated to the less than 10% of patients who were sent home. Of note, the discriminative ability of our model is probably better in all patients presenting to the ED, due to a more heterogeneous casemix: patients who were sent home are likely to have more favourable predictor levels and more favourable outcomes than patients who are admitted.14
Besides mortality, we aimed to predict the need for ICU admission. A limitation of our study is that the need for ICU admission differs from the observed decisions on ICU admission, and is inherently difficult to model, because recorded ICU admissions express historical decisions at national, regional, hospital or even intensivist level. As a robust solution, we exploited the strong correlation between need for intensive care and death, by calibrating our model for predicting death to the observed ICU admissions, adjusting for a linear decrease with age after the age of 70. Hence, we assumed a linear relationship between (the logarithm of the odds of) death and need for ICU admission, and that all patients below the age of 70 needing intensive care were actually admitted to the ICU, that is, the need for ICU admission is well estimated by the observed decisions on ICU admission for patients below the age of 70. The latter is reasonable given the sufficiency of ICU beds for Dutch patients throughout the pandemic. The discriminative ability of this recalibration approach was very similar to that of a model that refitted all associations between COPE predictors and ICU admission. With temporal validation in two separate hospitals, we showed that COPE discriminated very well between patients at low and high risk of ICU admission and that the predicted probability of ICU admission was well calibrated for the 20% highest-risk patients (highest-risk quintiles in figure 3). Nevertheless, recalibration of COPE for predicting need for ICU admission to local circumstances may be necessary.
The absence of external validation in our study—measuring the predictive performance of COPE in hospitals that were not present in the development data—may be considered a limitation of this study.21 However, the combination of temporal validation—in second wave patients—and geographical validation—in separate hospitals—is a strength of this study.22 Although COPE already performed very well when validated across time and space, future research should focus on analyses of potential time trends not captured by the predictors—for example, changes in mortality due to: improvements in treating patients with COVID-19; mutations of COVID-19; changes in patient casemix or critical care capacity fluctuations23—potential changes in predictor effects in time (interactions between predictors and time), and the impact of potential differences in patient case mix and differences in clinical care in countries other than the Netherlands (international validation). These casemix and clinical care differences should primarily affect calibration, requiring an update of the model intercept, but not discrimination. The emergence of new COVID-19 variants with potentially different mortality risk may especially require frequent analyses of the need for model updating.24
In conclusion, COPE, a simple tool based on six quickly and objectively obtainable predictors in the ED, is well able to predict mortality and need for ICU admission for patients who present to the ED with suspected COVID-19. COPE may support patients and doctors in decision making.
Data availability statement
Data are available on reasonable request. The data that support the findings of this study are available on request from the corresponding author. The data are not publicly available due to data transfer agreements with each of the contributing hospitals.
Ethics statements
Patient consent for publication
Ethics approval
The Daily Board of the Medical Ethics Committee Erasmus MC of Rotterdam, The Netherlands, has approved the research proposal (MEC-2020–0297).
Acknowledgments
We thank Noreen van der Linden and the Dutch Network of Acute Care (LNAZ) for support with collecting the data.
References
Supplementary materials
Supplementary Data
This web only file has been produced by the BMJ Publishing Group from an electronic file supplied by the author(s) and has not been edited for content.
Footnotes
Twitter @Tufts_PACE
Contributors DvK, HL, JA, RJCGV, HRHdG, RLvB-V, JRM, AV, EvN, DK and SCES conceived and designed the study. JA, RJCGV, DTJJK, MJAK, TD, RS, SW, K-SA and BT were responsible for collecting the data. DvK analysed the data and wrote the first draft of the paper. AR implemented the models into a web application. All authors contributed to writing the paper and approved the final version. The corresponding author attests that all listed authors meet authorship criteria and that no others meeting the criteria have been omitted. The corresponding author has the right to grant on behalf of all authors and does grant on behalf of all authors, a worldwide licence to the publishers and its licensees in perpetuity, in all forms, formats and media (whether known now or created in the future), to (1) publish, reproduce, distribute, display and store the Contribution, (2) translate the contribution into other languages, create adaptations, reprints, include within collections and create summaries, extracts and/or, abstracts of the Contribution, (3) create any other derivative work(s) based on the contribution, (4) to exploit all subsidiary rights in the contribution, (5) the inclusion of electronic links from the Contribution to third party material where-ever it may be located; and, (6) licence any third party to do any or all of the above.'
Funding This work was supported by ZonMw (project number 10430 01 201 0019: Clinical prediction models for COVID-19: development, international validation and use) and the Patient-Centred Outcomes Research Institute (PCORI grant number ME-1606–35555: How Well Do Clinical Prediction Models (CPMs) Validate? A Large-Scale Evaluation of Cardiovascular Clinical Prediction Models).
Disclaimer The funders had no role in study design, data collection and analysis, decision to publish, or preparation of the manuscript. All authors are independent from funders and had full access to all of the data (including statistical reports and tables) in the study and can take responsibility for the integrity of the data and the accuracy of the data analysis.
Competing interests None declared.
Provenance and peer review Not commissioned; externally peer reviewed.
Supplemental material This content has been supplied by the author(s). It has not been vetted by BMJ Publishing Group Limited (BMJ) and may not have been peer-reviewed. Any opinions or recommendations discussed are solely those of the author(s) and are not endorsed by BMJ. BMJ disclaims all liability and responsibility arising from any reliance placed on the content. Where the content includes any translated material, BMJ does not warrant the accuracy and reliability of the translations (including but not limited to local regulations, clinical guidelines, terminology, drug names and drug dosages), and is not responsible for any error and/or omissions arising from translation and adaptation or otherwise.