Article Text

Abstract
Background High body mass index (BMI) is the second leading contributor to Australia’s burden of disease and is particularly prevalent among Aboriginal peoples. This paper aims to provide insight into factors relating to obesity among Aboriginal adults and Aboriginal–non-Aboriginal differences.
Methods Cross-sectional analysis of data from the 45 and Up Study, comparing obesity (BMI ≥30 kg/m2) prevalence and risk factors among 1515 Aboriginal and 213 301 non-Aboriginal adults in New South Wales. Age–sex-adjusted prevalence ratios (PRs) for obesity by sociodemographic factors, health behaviours and health status were estimated (multivariable log-binomial regression) for Aboriginal and non-Aboriginal participants separately. We quantified the extent to which key factors (physical activity, screen time, education, remoteness, area-level disadvantage) accounted for any excess Aboriginal obesity prevalence.
Results Obesity prevalence was 39% among Aboriginal and 22% among non-Aboriginal participants (PR=1.65, 95% CI 1.55 to 1.76). Risk factors for obesity were generally similar for Aboriginal and non-Aboriginal participants and included individual-level and area-level disadvantage, physical inactivity, and poor physical and mental health, with steeper gradients observed among non-Aboriginal participants for some factors (Pinteraction <0.05). Many risk factors were more common among Aboriginal versus non-Aboriginal participants; key factors accounted for >40% of the excess Aboriginal obesity prevalence.
Conclusion A substantial proportion of the excess obesity prevalence among Aboriginal versus non-Aboriginal participants was explained by physical activity, screen time, education, remoteness and area-level disadvantage. Socioeconomic and health behaviour factors are potential targets for promoting healthy BMI, but these must be considered within the context of upstream social and cultural factors. Adults with health needs and disability require particular attention.
- obesity
- epidemiology
- health Inequalities
This is an Open Access article distributed in accordance with the Creative Commons Attribution Non Commercial (CC BY-NC 4.0) license, which permits others to distribute, remix, adapt, build upon this work non-commercially, and license their derivative works on different terms, provided the original work is properly cited and the use is non-commercial. See: http://creativecommons.org/licenses/by-nc/4.0/
Statistics from Altmetric.com
Introduction
High body mass index (BMI) is the second leading contributor to the total burden of the disease in Australia, including through its association with diabetes, chronic kidney disease, coronary heart disease, stroke and cancer.1 These health conditions and associated disability can be both a cause and consequence of high BMI.
Obesity is particularly common among Aboriginal and Torres Strait Islander adults (40% among adults ≥18 years, based on measured height and weight2) and is associated with a substantial burden of disease.3 This obesity prevalence is significantly higher than the 27% observed among non-Indigenous Australian adults (age-adjusted obesity prevalence ratio (PR) of 1.5).2 4 Obesity prevalence is elevated among Indigenous compared with non-Indigenous adults in other countries including Canada, New Zealand and the USA (prevalence difference: 15%–20%, PR=1.6–2.05); this is at least partially attributable to lasting impacts of colonisation.6 7 For example, in Australia, colonisation disrupted the traditional lifestyles and cultures of Aboriginal and Torres Strait Islander peoples; this has had lasting negative repercussions on well-being, including through continuing socioeconomic disadvantage and reduced access to services, infrastructure and food security, disconnection from culture and land, and intergenerational trauma.7–9
While the available large-scale evidence specific to Aboriginal and Torres Strait Islander adults indicates that obesity prevalence is significantly higher among women versus men and among older (35–44, 45–54 and ≥55 years) versus younger (18–24 and 25–34 years) adults, and does not vary significantly by remoteness,2 the existing evidence base is insufficient to identify specific factors underlying the excess obesity prevalence among Aboriginal and Torres Strait Islander adults compared with non-Indigenous Australian adults. As a result, there is insufficient evidence to guide programme and policy development to promote healthy BMI for this population.
The excess obesity prevalence may reflect a combination of factors, including differences in the prevalence of ‘known’ obesity risk factors between the two populations, differences between the two populations in the associations between factors and obesity and/or the presence of obesity risk factors unique to the Aboriginal and Torres Strait Islander population; to our knowledge, no previous research has attempted to investigate this. This paper aims to provide insight into the factors relating to obesity in Aboriginali adults and Aboriginal–non-Aboriginal differences, using data from a large-scale study of adults living in New South Wales (NSW), Australia. It aims to quantify and compare associations between obesity and ‘known’ risk factors (sociodemographic factors, health behaviours, health status) among Aboriginal and non-Aboriginal adults; and to quantify the extent to which key factors (physical activity, screen time, education, remoteness, area-level disadvantage) account for any excess obesity prevalence in the Aboriginal population.
Methods
Setting
Around 649 000 Aboriginal and Torres Strait Islander people live in Australia, representing 2.8% of the total Australian population.10 NSW is the state/territory with the largest Aboriginal and Torres Strait Islander population. Among the Aboriginal population of NSW, 85.5% live in urban areas and 28.4% of adults aged 25–64 years have completed education at the level of Year 12 or equivalent, similar to the distribution in the total Aboriginal and Torres Strait Islander population (respective figures of 79.0% and 29.6%).10
Study population
The Sax Institute’s 45 and Up Study is a large-scale cohort study of men and women aged 45 years and older living in NSW. Adults were randomly sampled from the general population using the Department of Human Services (previously Medicare Australia) enrolment database, with oversampling in rural areas and of individuals aged ≥80 years. Recruitment occurred from 2006 to 2008, with an 18% response rate. To join the study, participants completed a postal questionnaire and provided written consent for five yearly health questionnaires and linkage to routinely collected health data. The study design has been described in detail elsewhere.11
The 2010 data release includes data on 266 821 participants, representing 10% of the NSW population aged 45 years and older. Individuals were excluded from our analyses if they had missing data on Aboriginal status (n=4742) or age (n=11); BMI missing, <15 or >50 kg/m2 (n=19 716)12; or a history of cancer other than melanoma and non-melanoma skin cancer (n=27 536).
Data
Remoteness and area-level disadvantage were derived from participants’ postcodes at recruitment; other variables were derived from baseline questionnaire responses.
Aboriginal status
Participants self-identified as being of Aboriginal and/or Torres Strait Islander origin (or neither) on the baseline questionnaire.13
Outcome
BMI, calculated from self-reported height and weight, was categorised as underweight (<18.5 kg/m2), normal weight (18.5–24.99 kg/m2), overweight (25.0–29.99 kg/m2) or obese (≥30 kg/m2); obesity was used as the outcome in the estimation of PRs.
Exposure variables
Sociodemographic variables included sex, age, annual household income before tax, highest educational qualification and employment status. Remoteness was categorised as major city, regional area or remote area, based on the postcode’s mean Accessibility Remoteness Index of Australia Plus score.14 Area-level disadvantage was measured using the 2006 Socio-Economic Index for Areas (SEIFA) Index of Relative Socio-Economic Disadvantage,15 collapsed into study population tertiles.
Health behaviour variables included smoking status; average daily fruit and vegetable consumption; alcohol consumption; average number of weekly sessions of physical activity longer than 10 min, weighted by activity vigorousness16; and daily screen time and standing time.
Health status variables included prior serious illness (self-reported doctor diagnosis of heart disease, stroke or diabetes); self-rated health; psychological distress, based on participants’ Kessler Psychological Distress (K-10) score; functional limitation, based on the physical functioning subscale of the Medical Outcomes Score17; disability (self-reported need for assistance with daily tasks because of long-term illness or disability); and carer status.
See online supplementary supporting information file 1 for details.
Supplementary file 1
Statistical methods
We compared obesity prevalence among Aboriginal versus non-Aboriginal participants by estimating the PR and 95% CI, adjusted for age and sex, using multivariable log-binomial models. We estimated age-adjusted and sex-adjusted PRs for obesity across categories of exposure variables within the Aboriginal and non-Aboriginal participants separately; a category was included for missing data on each exposure variable, but these results are not presented. We tested for trend across categories of ordinal variables by re-running models with variables as continuous variables (excluding participants with missing data on the exposure of interest). To test if associations between factors and obesity were different for Aboriginal and non-Aboriginal participants, we repeated each model in the full sample with and without an interaction term (Aboriginal status × exposure); we identified significant multiplicative statistical interactions using the likelihood ratio test.
We estimated the contribution of key factors to the excess obesity prevalence among Aboriginal (vs non-Aboriginal) participants. We examined changes in the Aboriginal–non-Aboriginal obesity PR between the base model (adjusted for age and sex only) and models additionally adjusted for (1) health behaviours (physical activity, screen time); (2) socioeconomic factors (education, remoteness, area-level disadvantage) and (3) health behaviours and socioeconomic factors together. Change in PR between models was calculated as: 100x(PRbase–PRadjusted)/(PRbase–1).18
Sensitivity analyses
We repeated analyses excluding underweight participants (n=2591) because these participants might be over-represented in poor health behaviour or health status categories within the non-obese reference group. We conducted additional analyses excluding participants with disability or functional limitation, given the potential link between functional limitation and ability to be physically active.
Results
Sample characteristics
The final sample included 1515 Aboriginal and 213 301 non-Aboriginal participants, with median age 55.2 and 60.1 years, respectively. In general, a higher proportion of Aboriginal, compared with non-Aboriginal, participants were smokers and of lower socioeconomic position (including low education, low income, area-level disadvantage) and poorer health status (including psychological distress, functional limitation, disability, self-rated health). A similar proportion of Aboriginal and non-Aboriginal participants had low physical activity, high screen time and high alcohol consumption. Table 1 presents these characteristics overall and by BMI category.
Characteristics of Aboriginal and non-Aboriginal participants in the 45 and Up Study by body mass index (BMI) category
Among Aboriginal participants, 1.7% were underweight, 23.4% normal weight, 36.4% overweight and 38.4% obese; corresponding figures for non-Aboriginal participants were 1.2%, 36.9%, 39.6% and 22.3%. The BMI distribution was shifted towards higher BMI in the Aboriginal versus non-Aboriginal sample (figure 1A). The proportion obese was generally higher for Aboriginal versus non-Aboriginal men and women at most age groups (figure 1B), with an overall age-adjusted and sex-adjusted obesity PR of 1.65 (95% CI 1.55 to 1.76).
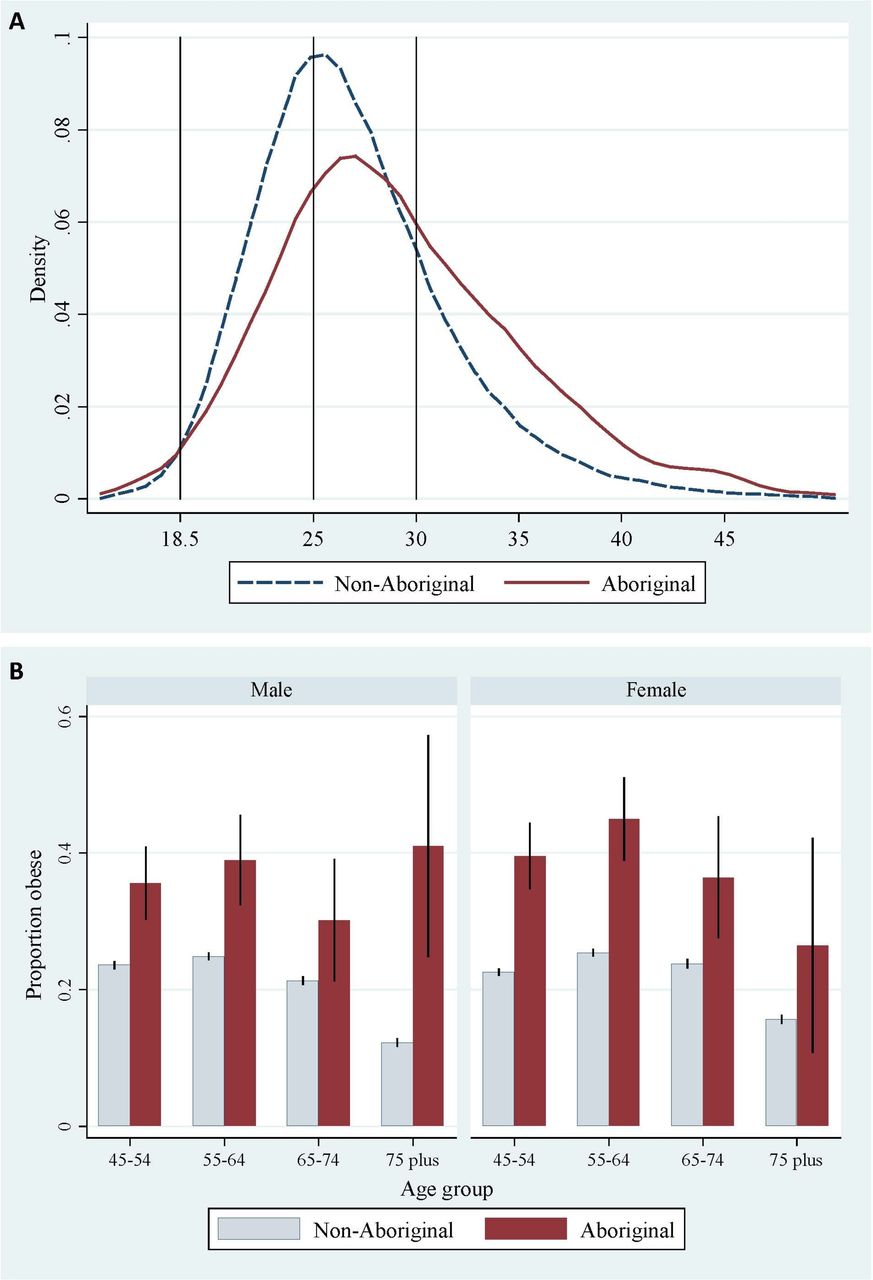
(A) Distribution of body mass index among 45 and Up study participants by Aboriginal status and (B) proportion (and 95% CI) obese by age group, sex and Aboriginal status.
Association between sociodemographic factors and obesity
Associations between sociodemographic factors and obesity were generally similar for Aboriginal and non-Aboriginal participants (figure 2). Obesity prevalence was lower for persons aged ≥65 versus 45–65 years, and higher for women versus men and for those living in regional and remote versus urban settings, but these associations were only statistically significant in the non-Aboriginal sample. For both groups, obesity was significantly less common among those in paid work versus not (PR=0.87, 95% CI 0.75 to 0.99 and PR=0.79, 95%CI 0.78 to 0.81), and there was a significant trend of decreasing obesity prevalence with increasing education, income and area-level advantage.

Obesity prevalence and prevalence ratios among Aboriginal and non-Aboriginal participants according to sociodemographic factors. Total n=1515 Aboriginal participants and 213 301 non-Aboriginal participants across all models; a category for missing data was included for each exposure variable but these results are not presented. Prevalence ratios are adjusted for age (in 5-year increments up to age <80 and ≥80 years) and sex, where appropriate. Horizontal lines represent 95% CIs around point estimates; the CIs in the non-Aboriginal sample are very narrow and are thus obscured by the marker for the point estimate. *Significant trend across categories among Aboriginal participants (only tested for ordinal variables). † Significant trend across categories among non-Aboriginal participants (only tested for ordinal variables). SEIFA, Socio-Economic Index for Areas.
Although the relationship between education and obesity was in the same direction for Aboriginal and non-Aboriginal participants, the gradient in obesity PR was steeper in the non-Aboriginal sample (P value for interaction <0.01). However, the absolute difference in obesity prevalence (unadjusted) across education categories was of similar magnitude for Aboriginal and non-Aboriginal participants.
Association between health behaviours and obesity
Among both Aboriginal and non-Aboriginal participants, obesity prevalence significantly decreased with increasing physical activity and standing time, and with decreasing screen time (figure 3). Across these exposures, membership in the most versus least active category was associated with an obesity PR of 0.79–0.83 and 0.57–0.79, and a 6.8%–9.2% and 4.3%–11.9% lower obesity prevalence (unadjusted) in absolute terms, for Aboriginal and non-Aboriginal adults. The gradient in the relationship of physical activity and screen time to obesity was steeper for non-Aboriginal compared with Aboriginal participants (P value for interaction <0.01 and =0.04).

Obesity prevalence and prevalence ratios among Aboriginal and non-Aboriginal participants according to health behaviour factors. Total n=1515 Aboriginal participants and 213 301 non-Aboriginal participants across all models; a category for missing data was included for each exposure variable but these results are not presented. Prevalence ratios are adjusted for age (in 5-year increments up to age <80 and ≥80 years) and sex, where appropriate. Horizontal lines represent 95% CIs around point estimates; the CIs in the non-Aboriginal sample are very narrow and are thus obscured by the marker for the point estimate. *Significant trend across categories among Aboriginal participants (only tested for ordinal variables). † Significant trend across categories among non-Aboriginal participants (only tested for ordinal variables).
Among Aboriginal participants, there was not a significant relationship between fruit or vegetable consumption and obesity. Compared with never-smokers, Aboriginal (PR=1.16, 95%CI 1.01 to 1.33) and non-Aboriginal (PR=1.23, 95%CI 1.21 to 1.25) ex-smokers were significantly more likely to be obese, and Aboriginal current smokers were significantly less likely to be obese (PR=0.78, 95% CI 0.64 to 0.95). There was a significant interaction for smoking status (P value for interaction=0.03). For both Aboriginal and non-Aboriginal adults, obesity prevalence decreased significantly with increasing alcohol consumption.
Association between health status factors and obesity
Obesity was significantly more common among Aboriginal and non-Aboriginal participants with disability (PR=1.38, 95% CI 1.18 to 1.63 and PR=1.81, 95%CI 1.76 to 1.86) and prior serious illness (PR=1.81, 95%CI 1.59 to 2.05 and PR=1.74, 95% CI 1.71 to 1.77), and there was a significant trend towards increasing obesity prevalence with increasing levels of psychological distress and functional limitation and decreasing levels of self-rated health (figure 4). Membership in the poorest versus best health status category was associated with up to a twofold and threefold increase in age-adjusted and sex-adjusted obesity prevalence, and up to an 26.8% and 22.4% absolute increase in unadjusted obesity prevalence for Aboriginal and non-Aboriginal participants, respectively.

Obesity prevalence and prevalence ratios among Aboriginal and non-Aboriginal participants according to health status factors. Total n=1515 Aboriginal participants and 213 301 non-Aboriginal participants across all models; a category for missing data was included for each exposure variable but these results are not presented. Prevalence ratios are adjusted for age ((in 5-year increments up to age <80 and ≥80 years) and sex, where appropriate. Horizontal lines represent 95% CIs around point estimates; the CIs in the non-Aboriginal sample are very narrow and are thus obscured by the marker for the point estimate. *Significant trend across categories among Aboriginal participants (only tested for ordinal variables). † Significant trend across categories among non-Aboriginal participants (only tested for ordinal variables).
The direction of relationships was the same for Aboriginal and non-Aboriginal participants across all exposures, and absolute differences in unadjusted obesity prevalence were similar in magnitude; however, the PR gradients were stronger (P value for interaction <0.05) for psychological distress, functional limitation, disability and self-rated health among non-Aboriginal participants.
Explanatory contribution of key factors to the excess obesity prevalence among Aboriginal versus non-Aboriginal participants
We examined the contribution of key factors to the excess obesity prevalence among Aboriginal compared with non-Aboriginal participants in the full sample (n=214 816). When key health behaviours were added to the base model, the PR was reduced from 1.65 (95% CI 1.55 to 1.76) to 1.56 (95% CI 1.46 to 1.66; 14.1% reduction from base model), and when key socioeconomic factors were added to the base model, the PR was reduced to 1.43 (95% CI 1.34 to 1.52; 33.9% reduction). After adjustment for both health behaviours and socioeconomic factors, the point estimate for PR was reduced from 1.65 to 1.36 (95% CI 1.28 to 1.44; 45.0% reduction).
Sensitivity analyses
Across all variable domains, the exclusion of underweight participants did not materially change results (all PR changes<10%; data not shown). After excluding participants with disability or functional limitation, the relationship of BMI to physical activity, screen time and standing time within the Aboriginal and non-Aboriginal samples did not materially change, and the P values for interactions for physical activity and screen time were no longer significant (0.08, 0.26); the P value for interaction for standing time remained non-significant (0.75) (see online supplementary supporting information file 2, figure S1).
Discussion
Obesity prevalence was nearly 70% higher among Aboriginal compared with non-Aboriginal Australian adults in our study (PR=1.65, 95% CI 1.55 to 1.76). This is consistent with national data from 2011 to 2013 (PR=1.6 for adults aged ≥18 years2), and with the excess obesity prevalence observed among Indigenous compared with non-Indigenous adults in countries including Canada, New Zealand and the USA (PR=1.6–2.0).5 Relationships between obesity and sociodemographic, health behaviour and health status factors were generally similar for Aboriginal and non-Aboriginal participants. However, the prevalence of most risk factors was higher among Aboriginal versus non-Aboriginal participants. A substantial proportion (>40%) of the excess obesity prevalence among Aboriginal people was explained by ‘known’ proximal risk factors: physical activity, screen time, education, remoteness and area-level disadvantage. It is likely that poor health and well-being, as well as factors not measured in this study (such as racism, food security, disconnection from culture and land), contribute to the remaining excess burden of obesity in this population.7
For both Aboriginal and non-Aboriginal participants, obesity was significantly less common among those experiencing advantage at the individual (education, income, employment) and area level. To our knowledge, this is the first large-scale evidence on the association between these factors and obesity among Aboriginal adults. Obesity prevalence among Aboriginal adults did not vary significantly by remoteness, consistent with national estimates from 2012 to 3013.2
Obesity prevalence was significantly lower among Aboriginal and non-Aboriginal adults with higher levels of physical activity, standing time and alcohol intake, and lower levels of screen time; to our knowledge, this is the first large-scale evidence on these relationships specific to the Aboriginal adult population. While we identified a significant difference between Aboriginal and non-Aboriginal adults in the relationship of physical activity and screen time to obesity in the full sample (significant P value for interaction), these interactions were no longer significant when the sample was restricted to those who had the ability to be physically active (ie, those without functional limitation). This demonstrates the importance of considering obesity risk and preventive factors within the context of people’s capabilities.
For both Aboriginal and non-Aboriginal adults in our sample, obesity prevalence was significantly lower among those with higher levels of alcohol intake. Evidence from other populations on the relationship between alcohol consumption and BMI is mixed, potentially attributable to differential impacts on BMI by alcohol type or to confounding by factors such as smoking, health status or changes in alcohol intake over time.19Compared with never-smokers, obesity prevalence was higher among both Aboriginal and non-Aboriginal ex-smokers, and lower among Aboriginal (but not non-Aboriginal) current smokers. These associations have been observed in data from cross-sectional and cohort studies of other populations, and may be attributable to factors including the impacts of nicotine on energy intake and expenditure20–22; however, the association between smoking and changes in bodyweight is complex and difficult to disentangle from potential confounders including diet, physical activity, health status and weight concerns.20 These findings of cross-sectional association should not be interpreted as evidence that alcohol consumption or smoking prevents obesity20 22; further, there is also evidence (including among Aboriginal Australians23) that heavy smoking is associated with increased central fat accumulation, independent of BMI, which is associated with increased chronic disease risk.20 24 25 Regardless, there is potential benefit in integrating weight management support into alcohol and smoking cessation programmes to mitigate concerns about weight gain associated with cessation.
Data were not available to examine caloric intake, but we examined the association between obesity and indicators of fruit and vegetable intake. We did not observe a significant association between obesity and fruit or vegetable intake among Aboriginal participants. Evidence on cross-sectional associations between weight status and fruit and vegetable intake is mixed; variation in the relationship may be partially explained by an inability to adjust for total energy intake, differences in the categorisation of fruit and vegetable intake and the accuracy of measures, differences in the types of foods and preparation method, and differences in adjustment strategy.26 27
Obesity prevalence was significantly lower among Aboriginal and non-Aboriginal adults in better physical health and mental health; we observed the strongest associations between obesity and these measures. For example, obesity prevalence was around twofold for Aboriginal participants and threefold for non-Aboriginal participants with poor/fair versus excellent/very good self-rated health, and with disability versus no disability. No sociodemographic or health risk factor variables were associated with an obesity PR of this magnitude. The strong associations between obesity and health status factors may reflect the fact that many of these relationships are bidirectional and reinforcing in nature. Illness and disability both contribute to and are consequences of obesity. Physical impairment that reduces physical activity is known to increase BMI. At the same time, high BMI itself, and consequences such as diabetes mellitus and cardiovascular disease, can further impair physical functioning. Given these bidirectional and reinforcing relationships, calculating the burden of obesity attributable to poor health status is difficult, but it is likely to have a contribution in this direction.
There were generally similar (and often strong) relationships between factors and obesity for Aboriginal and non-Aboriginal participants. However, the majority of obesity risk factors were more commonly observed in the Aboriginal versus non-Aboriginal sample. It is well established that Aboriginal people experience a higher burden of these factors, particularly disadvantage, illness and disability, stemming at least in part from inequalities in upstream determinants and Australia’s history of colonisation.8 9 28 Overall, 45.0% of the excess prevalence of obesity in the Aboriginal versus non-Aboriginal sample was explained by a select set of indicators of socioeconomic position and health behaviours. This is a substantial proportion, particularly when allowing a reasonable margin of error for the measurement of each included factor and considering limited number of factors included; we did not adjust for measures of health status given the potential for reverse causality.
For some variables, obesity PR was attenuated in the Aboriginal versus non-Aboriginal group. However, in many of these cases, absolute difference in obesity prevalence (unadjusted) across exposure categories was similar, or even greater, in the Aboriginal versus non-Aboriginal group. For example, among Aboriginal participants, obesity prevalence was 51.9% among those with moderate/severe limitation versus 29.5% among those with no functional limitation (absolute difference: 22.4%); respective prevalences were 35.9% and 13.5% (absolute difference: 22.4%) among non-Aboriginal participants. Despite equivalent absolute prevalence difference, the relative difference in obesity prevalence was significantly larger for the non-Aboriginal (PR=3.32, 95% CI 3.24 to 3.40) versus Aboriginal group (PR=1.80, 95% CI 1.50 to 2.16). This is largely due to the lower base prevalence in the non-Aboriginal sample. This may explain the observed differences between Aboriginal and non-Aboriginal participants in the relationships of obesity to education, functional limitation, disability and self-rated health. This highlights the importance of considering differences in both relative and absolute prevalence.
Strengths and limitations
The 45 and Up study includes data on a wide range of sociodemographic factors, health behaviours and health-related factors from a large sample of middle-aged and older Aboriginal and non-Aboriginal participants from NSW, Australia. To our knowledge, this study is the first internationally to examine and directly compare the relationship between obesity and a range of factors among Indigenous and non-Indigenous persons within the same large-scale dataset. The 45 and Up Study is not intended to be representative of the general population, and the absolute estimates of obesity prevalence in this study may not be representative of that in the general population. However, PRs based on internal comparisons, such as those reported here, have been shown to be generalisable and remain valid in non-representative studies.29 30 The use of cross-sectional data precludes demonstration of causality or disentanglement of bidirectional relationships.
Reliance on self-reported data, in particular BMI, is a potential limitation. However, a validation study among 45 and Up Study participants demonstrated that, while reported BMI was slightly underestimated, it was on average within 1 kg/m2 of measured values.31 Research from other populations indicates that the extent of biases in self-reported BMI vary by factors including age, sex, ethnicity, education and income.32 33 In both the Aboriginal and non-Aboriginal sample, BMI may be underestimated and obese participants may be misclassified as non-obese. If BMI is underestimated across all levels of BMI, our results may be biased towards the null. If the extent of underestimation of BMI is larger for Aboriginal compared with non-Aboriginal participants in our study, the extent of bias towards the null may be greater for this group. However, if underestimation increases with increasing BMI (for both groups), the effect on associations will be limited, but if any, it will bias towards the null. Hence, our results are suitably conservative. Further, the observed obesity prevalence estimates are consistent with previous estimates based on self-reported height and weight among Aboriginal and Torres Strait Islander adults and adults in the general Australian population,34 35 and the observed estimates of relative risk of obesity for Aboriginal compared with non-Aboriginal adults in our study are consistent with national data from 2011 to 2013 (PR=1.6 for adults aged ≥18 years), which were based on measured height and weight.2 Other self-reported measures (eg, K-10)36 have been validated for use in this study. There is no gold standard method for identification as Aboriginal and/or Torres Strait Islander37; use of self-reported individual data on identification is a strength of the study given the lack of reliable data on Aboriginal status within administrative data. Any error in identification would tend to dilute towards null relationships; our findings may therefore underestimate true effects.37
BMI is limited as an individual-level measure of adiposity38; however, it is a valuable population-level indicator,39 and its use was pragmatic for this study, given the absence of other measures. Previous research has indicated that Aboriginal and Torres Strait Islander, compared with non-Indigenous, Australians may have different distribution and higher content of body fat for a given BMI.40 41 Therefore, high BMI may have an even stronger association with disease among Aboriginal and Torres Strait Islander Australians.
We were limited to examining exposures measured in the 45 and Up Study and unable to examine factors relating to culture, spirituality or social connectedness, which may be important contributors to weight status.7 Further, we were unable to explore broader family-level or community-level factors, which are critical to holistic (rather than strictly biomedical) understandings of well-being.7
Conclusion
The relationships between obesity and selected socioeconomic factors, health behaviours and health status were generally similar for Aboriginal and non-Aboriginal adults in our study. The prevalence of many obesity risk factors was higher in the Aboriginal compared with non-Aboriginal sample, and a set of key socioeconomic factors and health behaviours explained >40% of the excess obesity prevalence among Aboriginal compared with non-Aboriginal participants. Potential targets for promoting healthy BMI include socioeconomic and health behaviour factors, but these need to be considered within the context of health status and other upstream social and cultural factors.7
Particular attention is needed to address obesity in those with multiple health needs and disability. A very high percentage of Aboriginal and Torres Strait Islander adults experience functional limitation or poor health, and it is necessary to support obesity prevention and mitigation efforts for people at this level of risk. The relationship between physical health and obesity is likely to be bidirectional, with obesity being both a result and cause of disability and morbidity. Obesity prevention and management must take into account functional impairment and illness, especially for Aboriginal and Torres Strait Islander adults. Critically, efforts to promote healthy weight need to be designed in partnership with Aboriginal and Torres Strait Islander peoples, and ensure programmes and policies are culturally appropriate and relatable.7
What is already known on this subject
High body mass index (BMI) is the second leading contributor to Australia’s burden of disease and is particularly prevalent among Indigenous peoples. The factors underlying this excess prevalence are unknown.
What this study adds
To our knowledge, this study is the first internationally to examine and directly compare the relationship between obesity and a wide range of factors among Indigenous and non-Indigenous adults within the same dataset.
Factors related to obesity were generally similar for Aboriginal and non-Aboriginal participants, but many risk factors were more common among Aboriginal participants; selected factors accounted for >40% of the excess Aboriginal obesity prevalence.
Potential targets for promoting healthy BMI include socioeconomic and health behaviour factors, but these need to be considered within the context of upstream social and cultural factors, particularly for Aboriginal adults. Adults with health needs and disability require particular attention.
Acknowledgments
This research was conducted using data collected through the 45 and Up Study (www.saxinstitute.org.au). The 45 and Up Study is managed by the Sax Institute in collaboration with major partner Cancer Council NSW; and partners: the National Heart Foundation of Australia (NSW Division); NSW Ministry of Health; NSW Government Family & Community Services – Ageing, Carers and the Disability Council NSW; and the Australian Red Cross Blood Service. The authors thank the many thousands of people participating in the 45 and Up Study. They also thank members of the Aboriginal Reference Group for Cardiovascular Health for providing insight into the manuscript and the Human Research Ethics Committee of the Aboriginal Health and Medical Research Council of New South Wales for reviewing and approving the manuscript.
References
Footnotes
↵i In this paper, the term Aboriginal, rather than Aboriginal and Torres Strait Islander, is used with respect to study participants as Aboriginal persons comprise the vast majority (95.9%, n=207 256/216 176) of the Indigenous population of NSW and are the original inhabitants of the area.10
Contributors EB, RK, SJE, VW, HB and BL conceived the study. KAT conducted the analysis and drafted the manuscript. GJ provided statistical advice. All authors provided critical input into each version of the manuscript and approved the final version.
Funding This work was supported by the National Health and Medical Research Council of Australia and Heart Foundation of Australia Partnership Project (reference: 1092674).
Competing interests EB and BL are supported by the National Health and Medical Research Council of Australia (reference: 1042717, 1069477). KT is supported by the Lowitja Institute (reference: 1344).
Patient consent Detail has been removed from this case description/these case descriptions to ensure anonymity. The editors and reviewers have seen the detailed information available and are satisfied that the information backs up the case the authors are making.
Ethics approval The 45 and Up study is conducted with ethics approval from the Human Research Ethics Committees of the University of New South Wales (reference: 10186). Research presented here was conducted with additional approval from the Aboriginal Health and Medical Research Council of New South Wales (reference: 1006/14).
Provenance and peer review Not commissioned; externally peer reviewed.
Data sharing statement Access to the 45 and Up Study dataset is available to researchers according to conditions and procedures described here: https://www.saxinstitute.org.au/our-work/45-up-study/for-researchers/