Article Text

Abstract
Background Lymphocyte activating 3 (LAG3, LAG-3, CD223) is a promising target for immune checkpoint inhibition in clear cell renal cell carcinoma (KIRC). The aim of this study was to investigate the epigenetic regulation of LAG3 in KIRC by methylation.
Methods We correlated quantitative LAG3 methylation levels with transcriptional activity, immune cell infiltration, and overall survival in a cohort of n=533 patients with KIRC and n=160 normal adjacent tissue (NAT) samples obtained from The Cancer Genome Atlas (TCGA). Furthermore, we analyzed LAG3 methylation in peripheral blood mononuclear cells (PBMCs) and KIRC cell lines. We validated correlations between LAG3 expression, immune cell infiltrates, survival, and methylation in an independent KIRC cohort (University Hospital Bonn (UHB) cohort, n=118) by means of immunohistochemistry and quantitative methylation-specific PCR.
Results We found differential methylation profiles among PBMCs, NAT, KIRC cell lines, and KIRC tumor tissue. Methylation strongly correlated with LAG3 mRNA expression in KIRCs (TCGA cohort) and KIRC cell lines. In the UHB cohort, methylation correlated with LAG3-positive immune cells and tumor-intrinsic LAG3 protein expression. Furthermore, LAG3 methylation strongly correlated with signatures of distinct immune cell infiltrates, an interferon-y signature (TCGA cohort), and immunohistochemically quantified CD45+, CD8+, and CD4+ immune cell infiltrates (UHB cohort). LAG3 mRNA expression (TCGA cohort), methylation (both cohorts), and tumor cell-intrinsic protein expression (UHB cohort) was significantly associated with overall survival.
Conclusion Our data suggest an epigenetic regulation of LAG3 expression in tumor and immune cells via DNA methylation. LAG3 expression and methylation is associated with a subset of KIRCs showing a distinct clinical course and immunogenicity. Our study provides rationale for further testing LAG3 DNA methylation as a predictive biomarker for response to LAG3 immune checkpoint inhibitors.
- tumor biomarkers
- kidney neoplasms
- immunotherapy
- biomarkers, tumor
This is an open access article distributed in accordance with the Creative Commons Attribution Non Commercial (CC BY-NC 4.0) license, which permits others to distribute, remix, adapt, build upon this work non-commercially, and license their derivative works on different terms, provided the original work is properly cited, appropriate credit is given, any changes made indicated, and the use is non-commercial. See http://creativecommons.org/licenses/by-nc/4.0/.
Statistics from Altmetric.com
Background
Clear cell renal cell carcinoma (KIRC) represents 80% of kidney malignancies and is among the most common malignancies worldwide.1 Although overall 5-year survival rates are approximately 75%, treatment of advanced and metastatic KIRC remains a challenge due to limited therapy options. For years, resistance to chemotherapy and radiation has been a major issue rendering surgical cytoreductive procedure the only effective therapy for advanced and metastatic KIRC. Development and clinical implementation of novel systemic therapies, such as multitarget tyrosine kinase inhibitors, has improved the long-term survival of advanced stage KIRC and recently brought into question the therapy regime with cytoreductive surgical therapy.2 The development of immune checkpoint inhibitors targeting the cytotoxic T-lymphocyte associated protein 4 (CTLA-4) or the programmed cell death 1 (PD-1) receptor/PD-1 ligand 1 (PD-L1)-axis have led to improved clinical outcomes in advanced and metastatic disease stages across various malignancies such as melanoma or non-small cell lung cancer.3 4 Recent studies have also demonstrated efficacy in targeting PD-1/PD-L1 and CTLA-4 in patients with metastatic KIRC.5 6 Despite the great success of immunotherapies targeting the PD-1/PD-L1 axis, many patients do not respond or ultimately develop resistance under treatment. As a result, other inhibitory receptors are being investigated as alternative immune therapy targets.7 One of these potential targets is the immune checkpoint lymphocyte activating 3 (LAG3, LAG-3, CD223).8 9
The regulation of LAG3 in KIRC on an epigenetic level, however, is largely unknown and might involve DNA methylation. DNA methylation is an important epigenetic mechanism involved in many fundamental biological processes, that is, differentiation (including T cell differentiation), X chromosome inactivation, and imprinting. Methylation of the gene promoter region is frequently associated with transcriptional silencing while gene body methylation is often a hallmark of transcriptionally active genes.10 11 Elucidation of the epigenetics of immune-checkpoint receptor genes might help in understanding mechanisms of response and resistance to the respective inhibitors, ultimately paving the way for the development of predictive biomarkers.
Methylation has been shown to regulate expression of PD-1 and PD-L1 in various malignancies.12–16 We therefore hypothesized that LAG3 expression might also be regulated epigenetically via DNA methylation. Understanding the epigenetic regulation of LAG3 expression is of major interest, as it could be useful for the stratification of patients who may benefit from immunotherapeutic LAG3 inhibition.
Material and methods
The results shown here are partly based on data generated by The Cancer Genome Atlas Research Network (TCGA, http://cancergenome.nih.gov/). The KIRC TCGA cohort comprises in total n=741 samples consisting of n=533 tumor samples and n=208 normal adjacent tissues (NAT). For the majority of the KIRC cohort, clinical follow-up and overall survival (OS) data were available (n=534, mean follow-up period 3.68 years, range 0–12.4 years). The mean age at initial diagnosis was 61.1 (range 26–90). For validation, a second cohort comprising n=118 formalin-fixed and paraffin-embedded KIRC tumors from patients treated at the University Hospital Bonn was included (UHB cohort). The mean follow-up period was 4.6 years (range 0–14.1 years), and the mean age at initial diagnosis was 62.7 (range 28–84).
Methylation analysis
Methylation data of the TCGA KIRC cohort were generated using the Infinium HumanMethylation450 BeadChip (Illumina, San Diego, California, USA) and were downloaded from the UCSC Xena browser (http://xena.ucsc.edu, KIRC n=318, NAT n=160). Beta values, approximately considered per cent methylation, for 16 CpG sites targeted by Infinium HumanMethylation450 BeadChip beads within LAG3 were analyzed (figure 1).
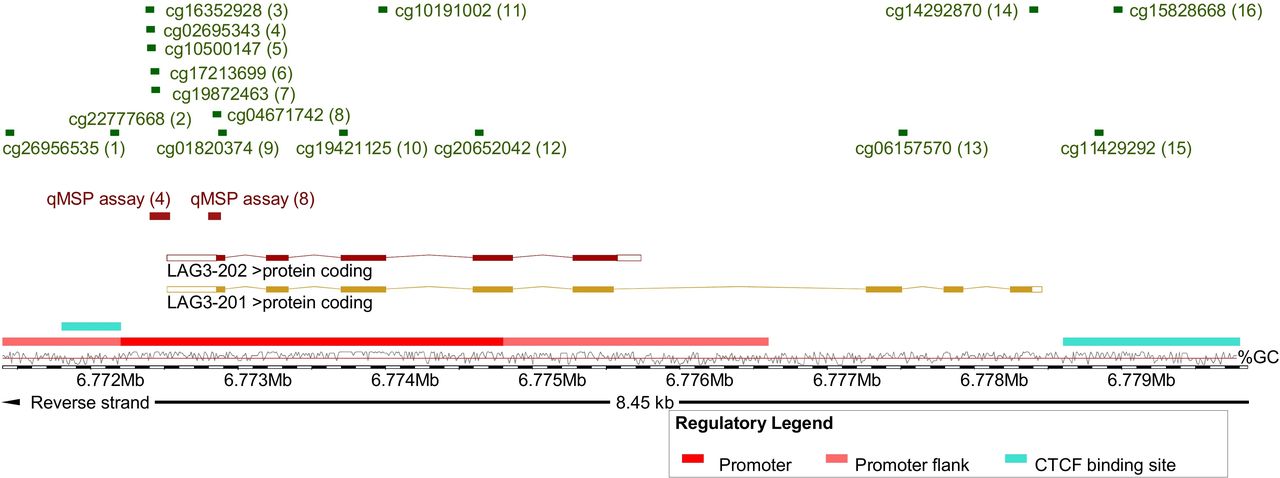
Overview of analyzed methylation sites and genomic organization of LAG3. Shown is chromosome 12, position 6 771 404–6 779 853, including the LAG3 gene, its transcripts and regulatory elements (promoter, promoter flank, and CCCTC-binding factor (CTCF) binding site), and the investigated loci. The LAG3 methylation target sites of the HumanMethylation450 BeadChip beads (1-16) and qMSP assays (4 and 8) are based on Genome Reference Consortium Human Build 38 patch release 13 (GRCh38.p13). The illustration (modified) was exported from www.ensemble.org (release 98).50 Beads are numbered as follows: cg26956535 (1), cg22777668 (2), cg16352928 (3), cg02695343 (4), cg10500147 (5), cg17213699 (6), cg19872463 (7), cg04671742 (8), cg01820374 (9), cg19421125 (10), cg10191002 (11), cg20652042 (12), cg06157570 (13), cg14292870 (14), cg11429292 (15), and cg15828668 (16). LAG3, lymphocyte activating 3; qMSP, quantitative methylation-specific PCR.
Infinium HumanMethylation450 BeadChip DNA methylation data of peripheral blood mononuclear cells (PBMCs, n=25) and human KIRC cell lines (n=12) were downloaded from NCBI (National Center for Biotechnology Information) Gene Expression Omnibus (GEO, http://www.ncbi.nlm.nih.gov/geo/, GSE82221, GSE89649).17–20
Methylation analysis of the UHB cohort was performed using bisulfite-specific quantitative real-time PCR employing methylation-unspecific primers and probe pairs specifically and competitively binding methylated and unmethylated template DNA, respectively. This quantitative methylation-specific PCR (qMSP) is described in detail by Lehmann and Kreipe.21 Tumor tissue was annotated and macrodissected from tissue sections mounted on glass slides and subsequently lysed and bisulfite converted using the innuCONVERT Bisulfite All-In-One Kit (Analytik Jena, Jena, Germany) according to the manufacturer’s protocol. We developed two qMSP assays (qMSP assays 4 and 8) that target CpG sites as probed by Illumina HumanMethylation450 BeadChip beads 4 and 8, respectively (figure 1). Uncalibrated methylation levels, approximately considered per cent methylation, were computed using cycle threshold (CT) values obtained from the probes specifically binding to methylated (CTmethylated) and unmethylated (CTunmethylated) DNA, respectively (methylation [%]=100%/(1+2CTmethylated–CTunmethylated). We performed 20 µL triplicate PCR reactions using buffer composition as previously described22 containing 20 ng bisulfite converted DNA (quantified via UV-VIS spectrophotometry) and 0.2 µM each probe and 0.2 µM each primer (qMSP assay 4 forward primer: aaccccctcaaactttccacta, reverse primer: gttttgttggtttttgggtttttatttt, probemethylated: 6-FAM-tagggtttacggtttcgtttcgt-BHQ-1, probeunmethylated: HEX-gtattttagggtttatggttttgttttgta-BHQ-1; qMSP assay 8 forward primer: ctttccttttctaacctcctttta, reverse primer: gtaagtttaggaattgagttttttatatt, probemethylated: 6-FAM-tggtttgggtagcgttgagttt-BHQ-1, probeunmethylated: HEX-atggtttgggtagtgttgagttttt-BHQ-1). qMSP was carried out using a 7900HT Fast Real-Time PCR system (Applied Biosystems, Waltham, Massachusetts, USA) with the following temperature profile: 10 min at 95°C and 40 cycles with 15 s at 95°C, 2 s at 62°C, and 60 s at 58°C (qMSP assay 4) or 53°C (qMSP assay 8).
mRNA expression data
TCGA transcriptome sequencing data (RNA-Seq v2) were downloaded from the UCSC Xena browser (http://xena.ucsc.edu) (KIRC n=533, NAT n=72). Log2 transformed RNA sequencing data generated by IlluminaHiSeq (Illumina) were used for bioinformatical analysis. Transcriptome data of GSE82221 was generated by HumanHT-12 v4.0 Gene Expression BeadChip (Illumina), GSE89649 by Human Transcriptome Array 2.0 (transcript (gene) version) (Affymetrix, Santa Clara, California, USA).
Mutation status
The mutation status of VHL, PBRM1, SETD2, BAP1, and KDM5C in the KIRC TCGA cohort as determined via whole-exome sequencing was downloaded from the cBioportal website (http://www.cbioportal.org).23 24
Immune cell infiltration
Quantitative RNA-Seq signatures of infiltrating B cells, dendritic cells, neutrophils, macrophages, CD4+, and CD8+ T cells in the KIRC TCGA cohort were obtained from Li et al.25 We further used CD8A, CD8B, and CD4 mRNA expression data from the TCGA cohort as surrogate for the infiltration by the respective T cell subsets. In the UHB cohort, infiltrates of CD45+ leukocytes, CD4+, and CD8+ T cells were quantified via immunohistochemistry (IHC) as described below.
Immunohistochemistry
Immunohistochemical staining of CD45, CD8, and CD4 was performed as previously described using the following monoclonal antibodies and dilutions:26 anti-CD45 clones 2B11+PD7/26 (#M070101, Dako/Agilent Technologies, Santa Clara, California, USA), 1:100; anti-CD8 clone C8/144B (#M710301, Dako/Agilent Technologies), 1:50; anti-CD4 clone SP35, #503–3354 (Zytomed Systems GmbH, Berlin, Germany), 1:20. CD45+, CD8+, and CD4+ immune cell infiltrates were evaluated as percentage of positive cells from all cells in the tumor.
For LAG3 IHC antigen retrieval was performed in pH 6 Target Retrieval Solution (#S169984-2, Dako/Agilent Technologies) for 10 min at 100°C. After blocking, the 5 µm sections were incubated with the primary monoclonal LAG3 antibody (clone IHC103, #IHC103-1, GenomeMe Lab, Richmond, Canada) at 4°C overnight and washed with 550 mM TBS. Visualization was performed employing the Dako REAL Detection System Alkaline Phosphatase/RED (Dako/Agilent Technologies, #K5005). Staining was contrasted with Mayer’s Hemalum solution (Merck Millipore, Billerica, MA, USA, #HX73030749). Absence or presence of LAG+ immune cells and quantitative (H-score) tumor cell-intrinsic LAG3 expression was evaluated by an experienced pathologist (MT).
Statistics
Statistical analyses were performed using Microsoft Excel, GraphPad PRISM and SPSS V.25.0. Spearman’s ρ correlation coefficients were calculated. Depending on the distribution group, comparisons were done using parametric two-sided student’s t-test or nonparametric Mann-Whitney U test. Survival analyses of dichotomized variables were performed by Kaplan-Meier and continuous log2-transformed variables were used for Cox proportional hazards analyses. P values refer to logrank and Wald tests, respectively. Two-sided p<0.05 were considered as statistically significant.
Results
The genomic organization of LAG3 is depicted in figure 1. The LAG3 gene encodes for two protein coding transcripts sharing the same transcription start site. Transcript LAG3-202 represents a truncated version of the full-length transcript LAG3-201 lacking the last three exons. An extended promoter and its flanks are predicted in the region of the transcription start site. Binding sites of the transcriptional repressor CTCF (CCCTC-binding factor) are predicted within the promoter and downstream from LAG3. In total, we investigated 16 CpG sites probed by beads from the Infinium HumanMethylation450 BeadChip. CpG sites 1–12 are located in the promoter and promoter flank region, CpG site 2 is found in the promoter-embedded CTCF binding site, beads 13 and 14 target CpG sites within the gene body downstream from LAG3-202 and CpGs 15 and 16 are situated in the downstream CTCF binding site. We further developed qMSP assays that target promoter CpG sites 4 and 8. In total, we analyzed a cohort comprised of n=318 patients with KIRC and n=24 NAT obtained from TCGA, a cohort of n=118 KIRCs from the University Hospital Bonn (UHB cohort), isolated PBMCs (n=25), and human KIRC cell lines (n=12) with regard to LAG3 gene methylation and expression.
LAG3 is broadly hypomethylated in KIRC versus NAT
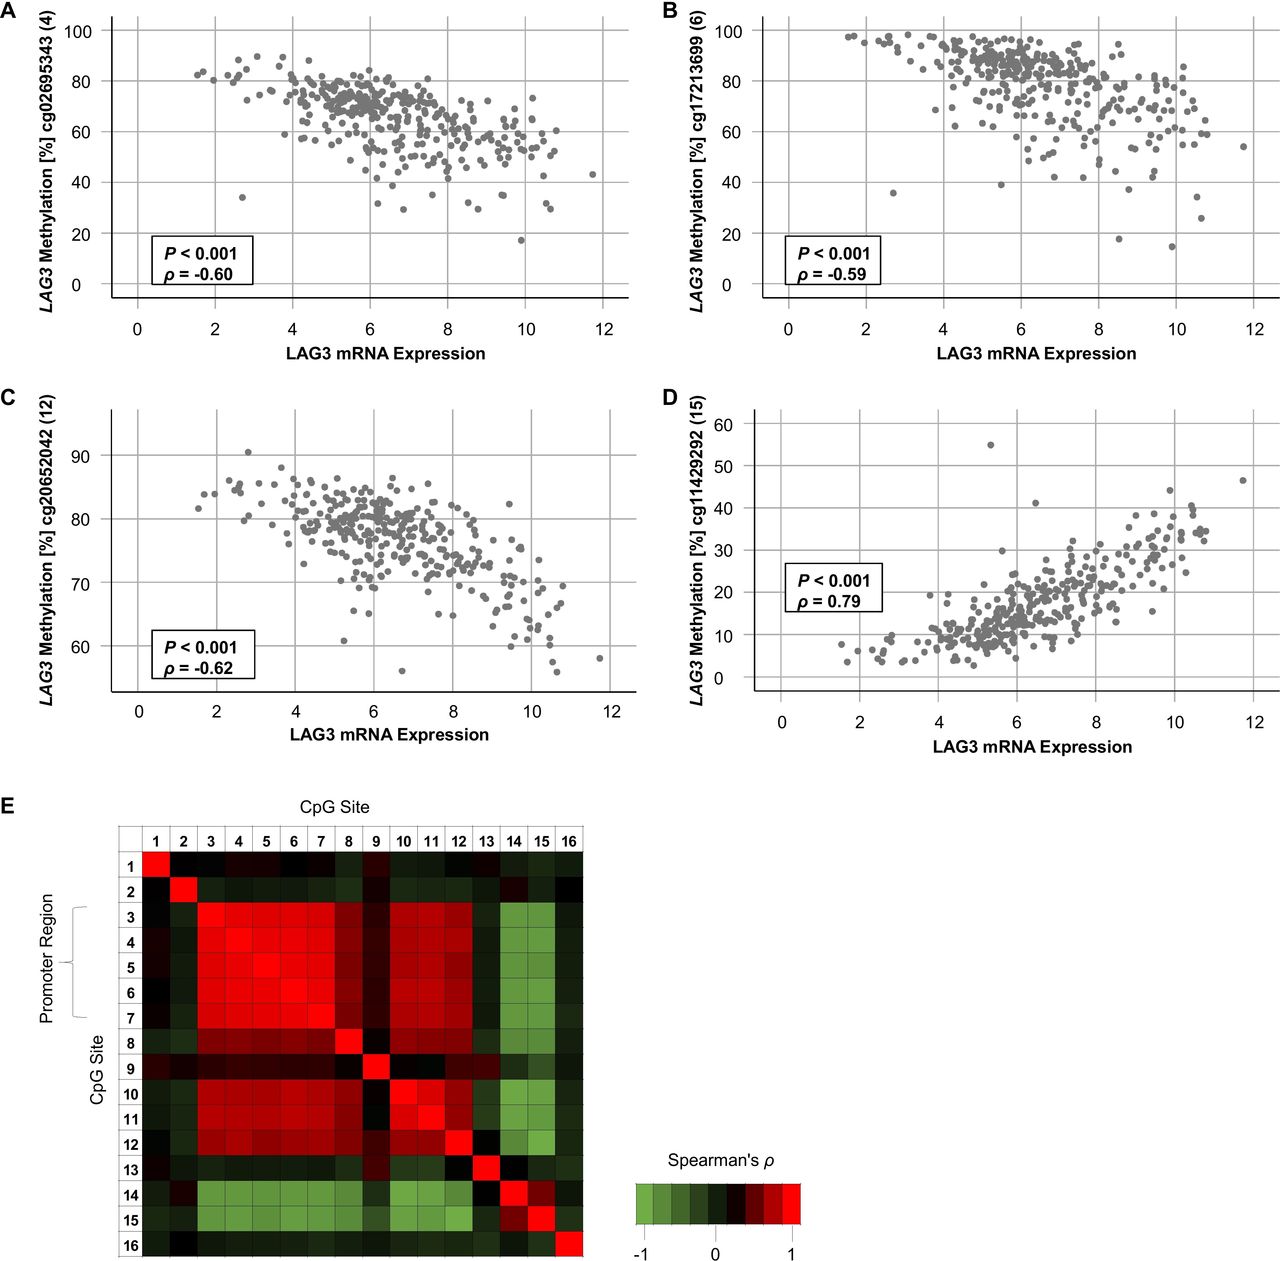
First, we investigated LAG3 methylation status in KIRC tissue compared with NAT. Fourteen out of 16 CpG sites were differentially methylated between KIRC and NAT (table 1, figure 2A). Interestingly, CpG sites located within the promoter and gene body region showed significant hypomethylation in KIRC versus NAT. Contrarily, CpG site 15 and 16, located downstream of LAG3 within the CTCF binding site, were hypermethylated in KIRC. Of note, promoter CpG sites (CpG sites 3–8 and 10–12) showed high correlation coefficients towards each other indicating a high degree of co-methylation (figure 3E). On the other hand, CpG sites 14 and 15 showed an inverse methylation pattern compared with sites 3–8 and 10–12. We validated the level of comethylation of CpG sites 4 and 8 via qMSP in the independent UHB cohort (TCGA cohort: Spearman’s ρ=0.62, p<0.001; UHB cohort: ρ=0.66, p<0.001).

Correlation of LAG3 methylation and mRNA expression. (A–D) Scatter plots showing LAG3 methylation with respect to LAG3 mRNA expression of the four CpG sites with highest correlation coefficients targeted by HumanMethylation450 BeadChip beads cg02695343 (4, (A)), cg17213699 (6, (B)), cg20652042 (12, (C)), and cg11429292 (15, (D)) in n=318 KIRC samples. (E) Correlation heatmap of methylation levels of 16 LAG3 CpG sites. LAG3, lymphocyte activating 3; KIRC, clear cell renal cell carcinoma.
LAG3 methylation levels and correlation with mRNA expression and overall survival

LAG3 methylation in KIRC, isolated tumor cell lines, and PBMCs and its correlation with immune cell infiltrates and IFN-γ signature. Correlation of LAG3 methylation status in KIRC, NAT, PBMCs (GSE82221), and KIRC cell lines (GSE89649) (A) with leukocyte subtypes (CD4, CD8A, and CD8B mRNA; and absolute immune cell infiltrates adopted from Li et al 21) (B), and IFN-γ signature (C). (A)–(C) are illustrated with regard to CpG sites targeted by HumanMethylation450 BeadChip. KIRC, clear cell renal cell carcinoma; LAG3, lymphocyte activating 3; NAT, normal adjacent tissue; PBMC, peripheral blood mononuclear cell.
LAG3 expression correlates with methylation
Second, we analyzed the extent to which LAG3 mRNA expression correlated to CpG methylation (table 1). In KIRC tissue, 12 out of 16 analyzed CpG sites significantly correlated with LAG3 mRNA expression. Interestingly, LAG3 promoter and body hypomethylation were associated with increased LAG3 mRNA expression, indicated by strong negative correlation coefficients (figure 3A–C). Conversely, methylation downstream of the LAG3 gene (figure 3D) correlated with LAG3 mRNA upregulation. This effect was most pronounced at CpG site 15 located within the binding site of the transcriptional repressor CTCF. We found a significant inverse correlation between methylation and mRNA expression in NAT at one CpG site (CpG site 10, table 1). A negative correlation at CpG site 11 was present in KIRC cell lines. Of note, we detected a significant positive correlation at CpG site 13 in KIRC cell lines whereas methylation of this CpG site did not correlate with mRNA expression in KIRC tumors. Since the microenvironment of KIRC tumors comprises many cell types, the lack of correlation at this site in KIRC tumors might be due to oppositely directed correlations in immune cells compared with KIRC cells. Accordingly, we found a strong negative correlation between methylation and expression at site 13 in PBMCs. Other CpG sites (8, 9, 12, and 15) revealed similar correlations in PBMCs compared with KIRC tumors. An additional significant correlation in PBMCs was found for CpG site 1 which was not observed in KIRC tumors, cell lines or NAT. Despite the low number of analyzed cell lines, PBMC, and NATs necessitating a thorough consideration of correlation coefficients and p values, our data clearly show differences in correlates of mRNA expression with LAG3 methylation among distinct cell lineages, suggesting differences in epigenetic regulation between NAT, PBMCs, and KIRC tumor cell lines.
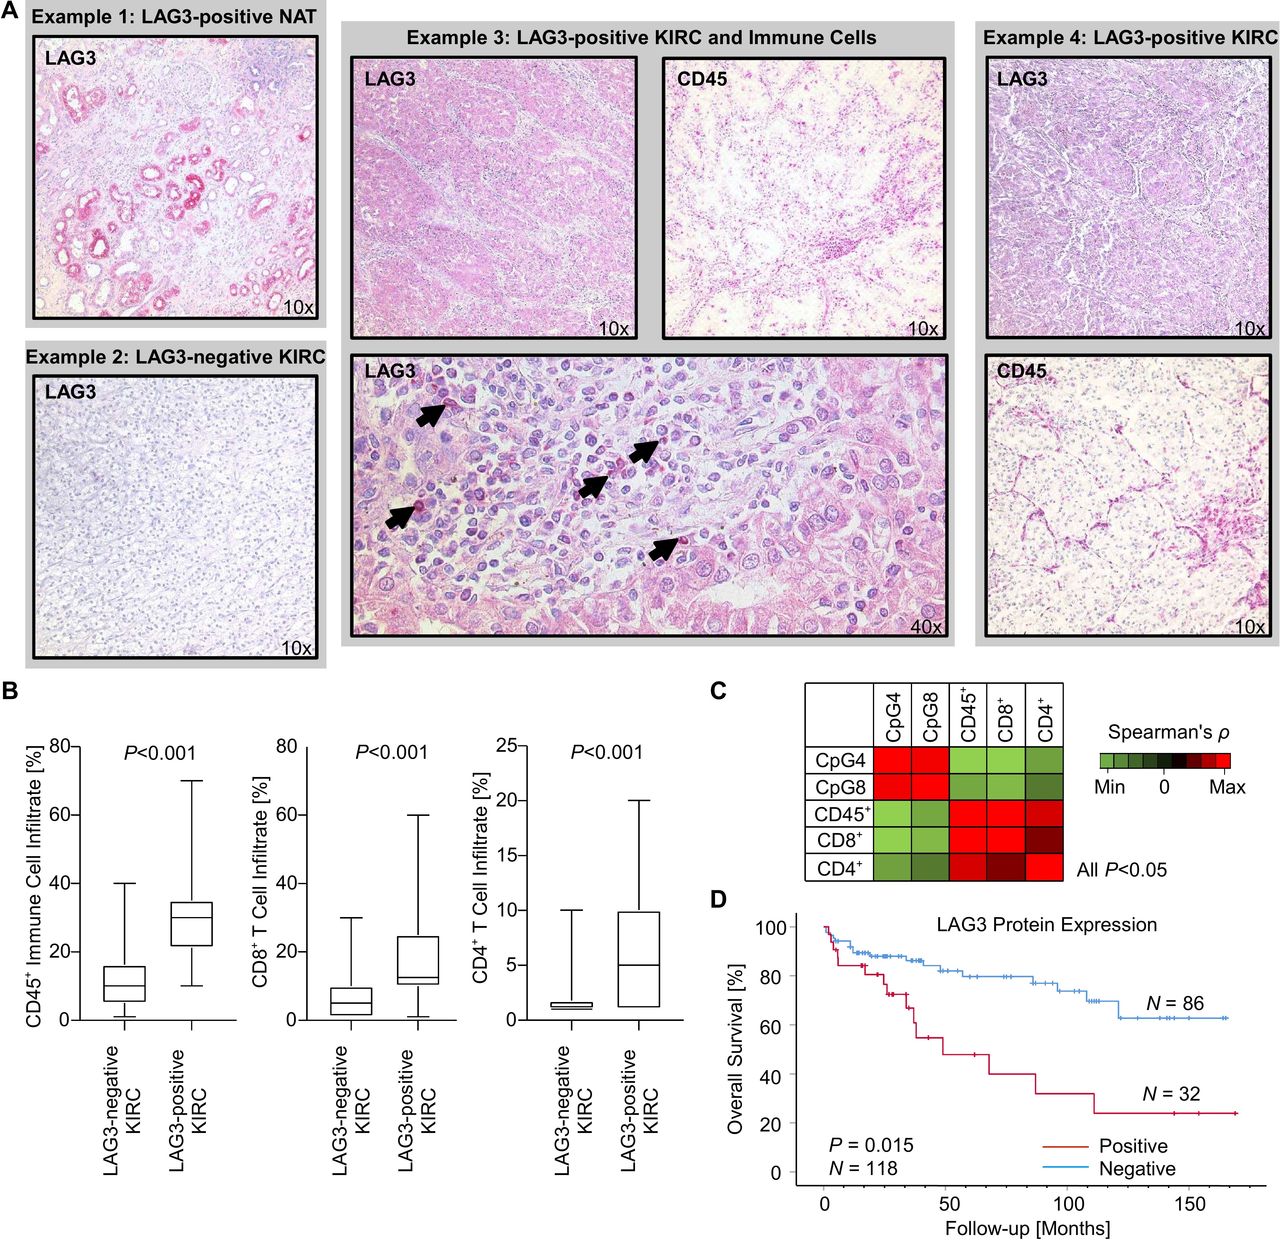
Next, we analyzed the correlation between methylation (CpG site 4 and 8) and expression of LAG3 on the protein level in our independent UHB KIRC cohort (n=118) with IHC and qMSP. CpG site 4 was selected as hypomethylation of this CpG site showed the strongest negative correlation with LAG3 mRNA expression in the TCGA KIRC cohort. Methylation of CpG site 8, on the other hand, was strongly correlated with reduced mRNA expression in PBMCs. Interestingly, a subset of tumors (32/118; 27.1%, figure 4A) exhibited tumor cell-intrinsic LAG3 protein expression, however, on a low expression level. LAG3-positive immune cells were rare and mainly present in the tumors with concomitant tumor cell-intrinsic LAG3 expression indicated by high correlation coefficient (22/118; 18.6%; Spearman’s ρ=0.62, p<0.001). Of note, LAG3 protein expression was also observed in the proximal tubules in the normal adjacent kidney (figure 4A) and in the urothelium of the renal pelvis. Methylation status of CpG sites 4 and 8 negatively correlated with LAG3 protein expression by tumor cells (CpG 4: Spearman’s ρ=−0.42, p<0.001; CpG 8: Spearman’s ρ=−0.27, p=0.004). Thus, we were able to confirm the proposed epigenetic regulation of LAG3 on the translational level in an independent cohort consistent with the results obtained from the KIRC TCGA.

LAG3 protein expression, immune cell infiltration, and methylation levels of CpG sites 4 and 8 in the UHB cohort (n=118 KIRC). (A) Representative images of immunohistochemical stainings against LAG3 and pan-leukocyte marker CD45 in four distinct cases of the UHB cohort. Example 1: The proximal tubules of NAT exhibit LAG3 expression. Example 3: Tumor-intrinsic LAG3 expression of a highly immune infiltrated KIRC tumor. The arrowheads point to LAG3+ immune cells within the tumor microenvironment of case 3. (B) Boxplots displaying immune cell infiltration of LAG3-negative vs LAG3-positive KIRC. (C) Correlation heatmap of methylation levels of CpG sites 4 and 8 within LAG3 and immune cell infiltration markers. (D) Kaplan-Meier survival analysis of patients with KIRC dichotomized according to tumor-intrinsic LAG3 protein expression. KIRC, clear cell renal cell carcinoma; LAG3, lymphocyte activating 3; UHB, University Hospital Bonn.
LAG3 promoter hypomethylation and expression is associated with immune cell infiltration
The tumor microenvironment can be infiltrated by various distinct immune cell subsets. We correlated RNAseq signatures of B cells, CD4+ and CD8+ T cells, neutrophils, macrophages, and dendritic cells with LAG3 methylation levels. We found an association of LAG3 promoter hypomethylation with higher infiltration of immune cells. In contrast, hypermethylation of CpG site 15, which is located in the downstream CTCF binding site, was correlated with increased immune cell infiltration (figure 2). This observation was supported by strong correlation between LAG3 promoter hypomethylation and elevated mRNA levels of the cluster of differentiation markers CD4, CD8A, and CD8B (figure 2A). These analyses are based on whole tumor tissue comprising tumor cells as well as stroma and infiltrating immune cells. LAG3 methylation in isolated PBMCs, comprising lymphocytes and monocytes, showed strong LAG3 promoter hypomethylation. Renal cell carcinoma cell lines, devoid of immune cells or stroma, on the other hand, were hypermethylated at the LAG3 promoter (figure 2B). Consistent with this finding, the arithmetic mean LAG3 methylation of the whole tumor, representing a composition of both tumor cells and immune infiltrates, was greater than that of PBMCs and less than that of the renal cell carcinoma cell lines (figure 2).
Further, we evaluated the relationship between LAG3 methylation and an IFN-y signature, indicated by IFN-y, STAT1, STAT2, JAK2, and IRF9 mRNA expression. Widespread promoter hypomethylation and body hypermethylation were strongly associated with increased IFN-y signature. Consistent with results presented above, methylation of CpG sites 14 and 15 showed positive correlations with an IFN-y signature (figure 2C).
We next evaluated the correlation of LAG3 methylation status of CpG sites 4 and 8 with immune cell infiltration in the UHB cohort. In addition to the methodology described above, which is entirely based on RNA signatures of immune cell infiltrates, the proportion of CD45+, CD4+, and CD8+ immune cells was evaluated via IHC. We were able to confirm that LAG3 methylation status correlated with pan-leukocyte infiltration measured by CD45 IHC, as well as with infiltration of CD4+ and CD8+ T cells (figure 4). Further, strong infiltration of CD45+, CD8+, and CD4+ immune cells was seen in the LAG3 expressing KIRC tumors.
Common driver mutations are associated with LAG3 methylation
In the KIRC TCGA cohort, the most frequent driver mutations are located in genes regulating oxygen metabolism and chromatin modification, namely VHL, PBRM1, SETD2, BAP1, and KDM5C (TCGA mutation frequency approximately: 49.9%, 30.6%, 11.3%, 8.9%, 6.0%, respectively). VHL-mutation status showed no correlation to LAG3 methylation. In contrast, methylation at several CpG loci were associated with mutation status of the most frequently mutated chromatin modifier genes, especially PBRM1 and BAP1 (table 2).
Associations of LAG3 methylation and mRNA expression (mean levels) with VHL, PBRM1, SETD2, KDM5C, and BAP1 mutation status in KIRC
LAG3 promoter hypomethylation and expression predict overall survival in KIRC
Next, we evaluated whether LAG3 methylation levels in KIRC are correlated with OS. In univariate Cox regression analyses, differential methylation of 10 out of 16 CpG sites significantly correlated with OS (table 1). LAG3 promoter hypomethylation was associated with unfavorable OS (CpG loci 3–7, 10, and 11) while higher methylation of CpG sites 13, 14, and 15, located in the gene body and the downstream CTCF binding site, significantly correlated to poor OS (table 1, figure 5). These results were validated via qMSP methylation analyses of CpG loci 4 and 8 in the UHB cohort. Hypomethylation of CpG sites 4 and 8 was significantly associated with worse OS measured by Cox regression (CpG site 4: HR (95% CI) 0.39 (0.02 to 0.66), p=0.001; CpG site 8: HR (95% CI) 0.11 (0.02 to 0.88), p=0.037).

Kaplan-Meier analysis regarding overall survival in patients with KIRC stratified according to LAG3 methylation and mRNA expression. Methylation and mRNA expression levels were dichotomized by median LAG3 methylation and mRNA expression, respectively. The prognostic significant CpG sites and LAG3 mRNA expression are depicted. KIRC, clear cell renal cell carcinoma; LAG3, lymphocyte activating 3.
As previously shown by Giraldo et al.27 LAG3 mRNA overexpression was associated with unfavorable OS in KIRC. In the UHB cohort, the LAG3-expressing and strongly immune-infiltrated KIRC subset was also associated with strongly reduced OS (figure 4D). LAG3 methylation status and overexpression on the transcriptional and translational level were therefore linked to unfavorable OS in two different KIRC cohorts.
Discussion
Despite the resounding success of multiple antibody-based therapies that inhibit the PD-1/PD-L1 axis, there are numerous nonresponding patients. Since this axis represents only one of a large number of inhibitory immune checkpoints, investigation of other potential targets that can be blocked to enhance the anticancer immune response is warranted. One of these targets is the immune checkpoint receptor, LAG3.
In the present study, we investigated DNA methylation at single CpG site resolution within the LAG3 gene. We correlated LAG3 methylation with transcriptional activity, protein expression, most frequent somatic mutations, overall patient survival, and tumor immune microenvironment in KIRC tissue. Our results suggest a strong epigenetic regulation of LAG3 via promoter methylation. Molecular, clinicopathological, and immunogenicity correlates with LAG3 promoter DNA methylation.
Distinct binding sites for transcriptional repressor CTCF are predicted within the promoter and downstream from LAG3. CTCF is known to be heavily involved in transcriptional regulation of regulation of chromatin architecture.28 Differential methylation of the CTCF binding sites within LAG3 correlates with its expression; however, further functional investigations are needed to clarify the mechanism of this differential regulation.
LAG3 is expressed on activated T cells, natural killer cells, B cells, and plasmacytoid dendritic cells and binds with high affinity to MHC class II receptors. Research has shown that LAG3 negatively regulates cellular proliferation, activation, and homeostasis of T cells, similar to the function of CTLA-4 and PD-1. Furthermore, it has been demonstrated that LAG3 plays a role in regulatory T cell (Treg) suppressive function and maintenance of CD8+ T cell exhaustion during chronic viral infection.29 30 In addition, LAG3 is involved in the process of maturation and activation of dendritic cells.
In an oncological context, LAG3 inhibition activates effector T cells, similar to PD-1 inhibitors, and additionally inhibits suppressive Tregs. This combined effect has the potential to enhance the antitumor response of the tumor-infiltrating immune cells.8 9 Hence, LAG3 is considered as a potential target in immunotherapy. Currently, clinical trials evaluating the safety and efficacy of multiple therapeutic monoclonal LAG3 antibodies such as relatlimab (Bristol-Myers Squibb) or MK-4280 (Merck/MSD Sharp & Dohme) alone (ClinicalTrials.gov Identifier: NCT01968109) or in combination with nivolumab and/or ipilimumab (NCT01968109, NCT03459222, NCT02996110) in KIRC are ongoing.
Clinical studies evaluating the efficacy of immune checkpoint inhibitors targeting the PD-1/PD-L1 axis have proposed different potential markers such as tumor-intrinsic immune checkpoint expression, the intensity of intratumoral CD8+ T cell infiltrates, or an enhanced interferon-γ signature to be predictive for therapy response.31–35 Currently, immunohistochemically determined receptor status is the only widely used biomarker prior immune checkpoint inhibition. However, the use of PD-L1 IHC as a predictive biomarker is confounded by multiple difficulties, such as the usage of different antibodies and expression scores, as well as interlaboratory and interobserver variability.36 The use of methylation as a biomarker has several advantages: DNA methylation is a stable epigenetic modification which is not as dynamic as mRNA or protein expression. In addition, it is chemically stable and can also be measured investigator-independently. Moreover, a quantitative measurement is also possible in small sample amounts (microdissected cells, biopsies), a situation often faced in the clinical setting.37 38 DNA methylation status is a particular promising biomarker for immunotherapies as demonstrated in previous reports.12–16
Results of the present study suggest that LAG3 gene expression in KIRC is strongly regulated epigenetically, that is, LAG3 methylation correlates with LAG3 mRNA expression. In particular, hypomethylation of the promoter region negatively correlates with enhanced mRNA expression in the KIRC TCGA cohort whereas two methylation sites, one in the body of the LAG3 gene, and one downstream within a putative binding site of the transcriptional repressor CTCF, positively correlate with mRNA expression. These findings on epigenetic regulation are consistent with our findings in KIRC tumor samples (UHB cohort). Overall, LAG3 promoter hypomethylation was concordantly associated with LAG3 protein expression. Results from IHC demonstrated that LAG3 is expressed intrinsically by a subset of KIRC tumor cells and sparsely by immune infiltrates. This LAG3-expressing KIRC subset was characterized by adverse clinical outcome, high immune cell infiltration, and LAG3+ immune cell infiltration indicating those tumors as immunologically “hot tumors.” Consistent with our observations, distinct populations of phenotypically exhausted CD8+ T cells have previously been shown to exist in highly immune-infiltrated KIRC tumors.39 Furthermore, soluble LAG3, which is known to function as a dendritic cell activator, was also recently shown to be associated with advanced KIRC stage.40 Tumor-specific LAG3 upregulation might be an immune evasion phenotype similarly to PD-L1 upregulation or upregulation of other immune checkpoints. This hypothesis needs further functional evaluation. However, the finding of KIRC cell-intrinsic LAG3 expression is contradictory to a recent study on immune checkpoints in the microenvironment of primary and metastatic KIRC that revealed LAG3 expression by tumor infiltrating immune cells in a small subset of KIRC but not by the tumor itself.27 Previously, the immune checkpoint PD-1, which was thought to be solely expressed on immune cells, was also found to be expressed cancer cell-intrinsically in different tumor entities including renal cancers.41 Furthermore, it has already been shown that LAG3 is solely expressed on immune cells and in the central nervous system.42 Additionally, we found LAG3 expression in proximal tubules of NAT, the site in which malignant transformation occurs for KIRC,43 44 and in the urothelium of the renal pelvis. While the finding of cancer cell-intrinsic LAG3 expression in KIRC is interesting, further validation and functional analyses are required.
Based on data on LAG3 DNA methylation shown here, LAG3 methylation status could be used as an observer-independent predictive biomarker for stratification of patients who could benefit from LAG3 or other immune checkpoint inhibition therapy. However, this is speculative and further prospective studies are needed to evaluate the extent to which therapy response of LAG3 inhibition is predicted by promoter hypomethylation. Therefore, we recommend integration of LAG3 promoter methylation in biomarker programs of clinical trials to evaluate the efficacy of immune checkpoint inhibition in patients with KIRC.
Correlations of LAG3 mRNA expression and methylation in the KIRC TCGA cohort, comprising whole tumor tissue, NAT, PBMC, and KIRC cell lines showed significant differences between sample type. This suggests a cell type-specific epigenetic regulation of LAG3. For example, the methylation status of CpG site 13 showed a differential correlation with LAG3 mRNA in PBMCs compared with KIRC cell lines. This could be a hint for an alternative LAG3 promoter that indicates a leukocyte-specific expression of a particular splice variant. LAG3 variants that display different effects on immunological microenvironments have already been described.45 Widespread tissue-specific and cell type-specific methylation patterns in diverse biological processes are already described, highlighting the complexity of epigenetics.46
In KIRC, the most frequently mutated genes comprise chromatin modifier genes as PBRM1 and SETD2.47 48 Interestingly, recent studies have shown associations between therapy response to ICI and PBRM1 mutation status in KIRC and mesothelioma.47 49 Genomic alterations in SETD2 have already been associated with an altered activation of the interferon signaling pathway. Our data also showed a differential LAG3 methylation status in the context of mutations within chromatin modifier genes.
Further, our data demonstrate that promoter hypomethylation predicts unfavorable OS in KIRC. This finding highlights clinical significance. However, the main focus of our study is on the epigenetic regulation of LAG3 via DNA methylation in KIRC. LAG3 promoter hypomethylation is associated with increased immune cell infiltration and an interferon-γ signature. In the context of PD-1/PD-L1 directed immune checkpoint inhibition, interferon-γ signature is suggested as a critical driver for antitumoral immune efficacy and thereby a potential biomarker for ICI therapy response.35 Using GEO datasets, LAG3 methylation in KIRC cell lines and PBMCs was investigated independently. Our results showed that compared with tumor cell lines, PBMCs are hypomethylated in the LAG3 promoter region. The KIRC TCGA data are based on whole tumor tissue comprising tumor cells, stroma, and immune infiltrates. LAG3 promoter hypomethylation could thereby serve as a surrogate biomarker for high immune cell infiltration. However, a limitation of this data is that only isolated immune cells from peripheral blood of healthy individuals were examined. In this context, further studies are needed to clarify whether LAG3 methylation in the tumor is a surrogate biomarker for immunogenicity, that is, infiltration by immune cells and an interferon-γ signature, or whether LAG3 expression of the tumor cells themselves represents a more aggressive phenotype. One aspect of this is highlighted by our results from IHC staining, which showed that LAG3-expressing tumors are associated with poorer survival.
Conclusion
Our results suggest an epigenetic regulation of LAG3 in KIRC by DNA methylation. Understanding the epigenetic regulation of LAG3 in KIRC might help to develop biomarkers for the stratification of patients eligible for anti-LAG3 immunotherapies. Our study provides rationale to include LAG3 methylation testing as a potential predictive biomarker into the biomarker program of clinical trials with anti-LAG3 immune checkpoint inhibitors.
Acknowledgments
We thank the BioBank Bonn of the Bonn University Medical Faculty and the University Hospital Bonn for the support of this study.
References
Footnotes
NK and DJR are joint first authors.
JE and DD are joint senior authors.
Contributors NK, DJR, JE and DD were involved in the study design and concept. NK, DJR, and DD drafted the manuscript. NK, DJR, RZ and DD performed the experiments. Immunohistochemical stainings were analyzed by NK, MT and JL. NK and DD performed statistical analyses. JL, GK, MR, EGB, MH and JE revised the manuscript for critical intellectual content. All authors read and approved the final version of the manuscript.
Funding This study was supported by a Ferdinand Eisenberger grant of the Deutsche Gesellschaft für Urologie (German Society of Urology), grant ID KIN1/FE-19 (NK). The main funding source was the University Hospital Bonn.
Competing interests DD owns patents and patent applications on biomarker technologies and methylation of immune checkpoint genes as predictive and prognostic biomarkers (DE 10 2016 005 947.8, DE 10 2015 009 187.5, DE 10 2017 125 780.2, PCT/EP2016/001237). The patents are licensed to Qiagen GmbH (Hilden, Germany). DD is a consultant of Qiagen. The University Hospital Bonn (PI Dimo Dietrich) receives research funding from Qiagen. The other authors have declared that no conflict of interest exists.
Patient consent for publication Not required.
Ethics approval All patients registered in the TCGA Research Network and UHB cohort had signed informed consent in accordance with the declaration of Helsinki. The study protocol for the UHB cohort was approved by the Institutional Review Board (vote no. 187/16).
Provenance and peer review Not commissioned; externally peer reviewed.
Data availability statement Data are available in a public, open access repository. Data are available on reasonable request. The results shown here are based on data generated by The Cancer Genome Atlas project (TCGA, http://cancergenome.nih.gov/) and the Gene Expression Omnibus project (GEO, https://www.ncbi.nlm.nih.gov/geo/). Data based on the UHB cohort is available on reasonable request.