Article Text

Abstract
Objective To characterise the clinical relevance of urinary macrophage migration inhibitory factor (uMIF) concentrations in patients with systemic lupus erythematosus (SLE).
Methods MIF, adjusted for urine creatinine, was quantified by ELISA in urine samples from 64 prospectively recruited patients with SLE. Serum MIF and urinary monocyte chemoattractant protein 1 (uMCP-1) were quantified by ELISA in a subset of patients (n = 39). Disease activity was assessed using the SLE Disease Activity Index-2000 (SLEDAI-2K) score.
Results uMIF was detectable in all patients with SLE. uMIF was positively correlated with overall SLEDAI-2K, was significantly higher in patients with SLE with high disease activity (SLEDAI-2K≥10) compared with those with inactive disease (SLEDAI-2K<4), and this association remained significant after adjusting for ethnicity, flare and use of immunosuppressants. uMIF was also significantly higher in SLE patients with flare of disease, although not confirmed in multivariable analysis. No significant differences in uMIF levels were observed according to the presence of renal disease activity, as assessed by renal SLEDAI-2K or biopsy-confirmed lupus nephritis. In contrast, uMCP-1 was significantly higher in SLE patients with active renal disease. uMIF expression was not associated with irreversible organ damage accrual or glucocorticoid use.
Conclusions These data suggest uMIF as a potential overall but not renal-specific SLE biomarker, whereas uMCP-1 is a renal-specific SLE biomarker.
- biomarker
- lupus nephritis
- macrophage migration inhibitory factor
- monocyte chemoattractant protein 1
- systemic lupus erythematosus
This is an open access article distributed in accordance with the Creative Commons Attribution Non Commercial (CC BY-NC 4.0) license, which permits others to distribute, remix, adapt, build upon this work non-commercially, and license their derivative works on different terms, provided the original work is properly cited, appropriate credit is given, any changes made indicated, and the use is non-commercial. See: http://creativecommons.org/licenses/by-nc/4.0/
Statistics from Altmetric.com
- biomarker
- lupus nephritis
- macrophage migration inhibitory factor
- monocyte chemoattractant protein 1
- systemic lupus erythematosus
Introduction
Systemic lupus erythematosus (SLE) is an idiopathic systemic autoimmune condition, affecting multiple organs including the skin, joints, brain and kidneys.1 2 Renal involvement in SLE is common and constitutes a clinically serious manifestation, although urine concentrations of several proinflammatory molecules have been evaluated as potential biomarkers for active renal lupus,3–5 assessment of the activity of nephritis in SLE still requires renal biopsy. Evaluation of potential non-invasive biomarkers for lupus nephritis (LN) remains an unmet need.
The past decade has witnessed the emergence of significant understanding of SLE pathogenesis, including the critical role of macrophage migration inhibitory factor (MIF).6 7 MIF is produced by most innate and adaptive immune cells as well as non-haematopoietic cells including renal proximal tubular epithelial cells and endothelial cells.8–11 Studies in animal models suggest a role for MIF in LN pathogenesis. In MRL/lpr mice, renal MIF expression was upregulated compared with control MRL+/+ mice, and MIF-deficient MRL/lpr mice exhibited markedly reduced renal damage and protection from mortality.12 In addition, in an experimental rat model of crescentic glomerulonephritis (GN),13 renal glomerular and tubular MIF expression was upregulated, preceding macrophage infiltration and accumulation.10 Furthermore, a small molecule MIF inhibitor showed promising therapeutic effects in two lupus-prone mouse models, NZB/NZW F1 and MRL/lpr, particularly in reducing nephritis severity.11 These findings raise the possibility that measurement of MIF in the clinical setting could be informative in SLE and/or LN.
Plasma MIF levels have been reported to be elevated in lupus-prone mouse models.11 Serum MIF concentrations are also elevated in patients with SLE and associated with SLE disease activity, damage scores and glucocorticoid dose.14–18 Moreover, renal glomerular and tubular MIF expression has been reported to be increased in patients with SLE with proliferative LN,19 suggesting the possibility that MIF would be detectable in the urine of patients with LN and have utility in the assessment of disease activity or LN.
Based on the hypothesis that distinct pathways are activated in patients with different disease manifestations, phenotype-selective biomarkers for SLE might be more clinically useful than markers of overall disease activity.20 21 Urine concentrations of MIF have been reported in two prior studies in SLE; however, each of these included only 10 patients and neither used validated disease activity indices.22 23 Based on the evidence of involvement of MIF in the pathogenesis of LN and the preliminary reports of detection of MIF in urine in SLE, we aimed to more explicitly characterise the clinical relevance of urinary MIF (uMIF) concentrations in patients with SLE. As the previously best-characterised urinary biomarker for LN is the chemokine monocyte chemoattractant protein 1 (MCP-1, also known as chemokine ligand 2),3 4 and MCP-1 has been shown to correlate with MIF concentrations in serum of patients with SLE,18 we used urinary MCP-1 as a comparator.
Materials and methods
Patients and clinical assessments
Adult patients fulfilling the 1982 American College of Rheumatology (ACR) criteria for the classification of SLE,24 attending the Lupus Clinic at Monash Medical Centre in Melbourne Australia and consenting to provide clinical data are enrolled in a longitudinal registry, as described.25 Between April and October 2010, from 148 patients enrolled, only the patients who had full clinical data available and who consented to provide a urine sample were consecutively enrolled in the current study. All patients received standard-of-care therapy. Patients’ baseline characteristics were recorded, including age, gender and ethnicity. As previously described,16 26 in this cohort, disease activity is assessed at each visit using the SLE Disease Activity Index-2000 (SLEDAI-2K). Flare was defined according to the SLE flare Index.27 Damage was assessed using the Systemic Lupus International Collaborating Clinics (SLICC) SLE Damage Index (SDI), as previously described.16 26 Renal SLEDAI-2K was defined as the sum of the four renal components of the SLEDAI-2K28 and active renal disease was defined as renal SLEDAI-2K>0; non-renal disease activity was measured using the SLEDAI-2K omitting renal domains. The International Society of Nephrology/Renal Pathological Society (ISN/RPS) 2003 criteria were used for histological classification of LN; or the WHO classification for biopsies performed before 2004.29 Written informed consent was obtained from all subjects.
Serum and urinary cytokines quantification
Urine samples were collected at patients’ routine clinic visits. A paired serum sample was obtained at the same time from a subset of patients who consented to provide a blood sample. Urine was centrifuged (1500×g, 10 min) to separate debris. Samples were stored at −80°C until use. Serum and uMIF were quantified by ELISA (Capture antibody (Ab): mouse monoclonal anti-human MIF Ab (R&D Systems, Minneapolis, Minnesota, USA); Detection Ab: biotinylated goat anti-human MIF Ab (R&D Systems), according to a published method.16 Urinary MCP-1 concentrations were quantified by commercial ELISA (Duoset; Cat #DY279; R&D Systems), as per the manufacturer’s protocol. Optical density value was higher than the highest standard (1000 pg/mL) for urinary MCP-1 in one urine sample; urinary MCP-1 concentration has been replaced by the upper limit of detection (1000 pg/mL) in this sample for statistical analyse purpose. Urinary cytokine concentrations were normalised against creatinine concentration within the same sample, and urinary MIF/creatinine ratio (uMIF) and urinary MCP-1/creatinine ratio (uMCP-1) were used for all statistical analysis.22
Statistical analysis
All statistical analyses were performed using Stata V.14 (StataCorp, College Station, Texas, USA) and GraphPad software (Prism V.7.0d, 2017, San Diego, California, USA). Normally distributed data are shown as mean and SD. For non-normally distributed data, data are shown as median and IQR, Spearman’s rank test was used to determine correlations between variables, and Wilcoxon rank-sum or Kruskal-Wallis test (followed by Dunn’s multiple comparison test) were used to examine difference in two or more than two groups, respectively. Categorical data were presented as frequency (%) and were examined using Pearson's χ² test or Fisher’s exact test when appropriate. Linear regression analyses were performed to examine potential associations of uMIF with demographics and clinical parameters, as previously described.30 uMIF was log10-transformed to include in the linear regression model. Bootstrap methods with 50 repetitions were incorporated to derive robust 95% CI. Variables associated with uMIF (outcome) and the primary exposure of interest with p<0.1 were included in multivariable linear regression models. Results were presented as geometric means (GM) (antilog of the means derived from linear regressions) and the ratios of GM with corresponding 95% CI. P<0.05 was considered statistically significant.
Results
Patients characteristics
The cohort comprised 64 patients with SLE with a mean (SD) age of 39.3 (12.5) years. Eighty-one per cent were female and 38% were of Asian ethnicity. Median (IQR) disease duration was 8.2 (3.5–15.4) years. Median (IQR) SLEDAI-2K was 4 (2–7) and 25% of the patients had active renal disease as defined by the renal SLEDAI-2K score. Fifty-nine per cent and 55% of patients were receiving glucocorticoids and immunosuppressants, respectively (table 1).
uMIF concentrations in SLE
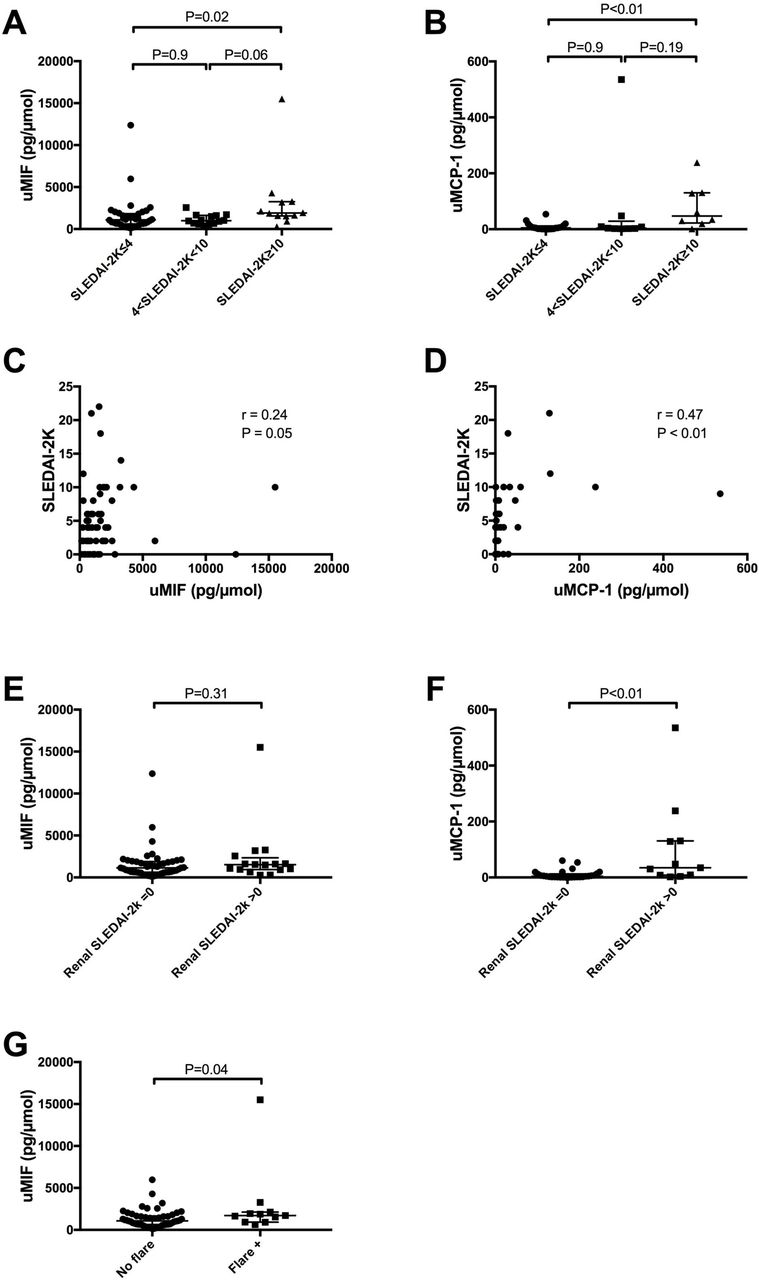
uMIF was detectable in all SLE samples. We examined the differences in uMIF levels according to demographics and SLE clinical parameters, and the results are reported in table 2. uMIF was significantly higher in younger patients and those with Asian ethnicity (table 2). uMIF was also significantly higher in patients with SLE with highly active disease (SLEDAI-2K≥10) compared with those with inactive disease (SLEDAI-2K≤4) and higher in patients with SLE with highly active disease compared with those with mildly active disease (4<SLEDAI-2K<10) with borderline significance (table 2; figure 1A). Accordingly, we found a statistically significant moderate and positive correlation between uMIF levels and overall SLEDAI-2K (r=0.24; p=0.05) (figure 1C). We found a similar statistically significant correlation between clinical SLEDAI-2K (removing serology) and uMIF (r=0.28; p=0.03). uMIF was also higher in patients with high non-renal disease activity (SLEDAI-2K not including renal domains>10) (median (IQR): 1947.9 (1871.1–2129.7) pg/µmol) compared with patients with non-renal SLEDAI-2K≤4 (median (IQR): 1067.4 (645.9–1892.4) pg/µmol) or patients with non-renal SLEDAI-2K between 4 and 10 (median (IQR): 1258.4 (684.4–1649.5) pg/µmol) (p=0.08). Using linear regression analysis, uMIF levels were confirmed as significantly increased in patients classified as having high disease activity compared with those with inactive disease (ratio of GM 2.15; 95% CI 1.18 to 3.93; p=0.01) (table 3), and this association remained significant after adjusting for ethnicity, flare and use of immunosuppressants (table 4).

Urinary MIF and MCP-1 in SLE. (A) uMIF in patients with SLE categorised by disease activity, inactive (SLEDAI-2K≤4; n=38), mildly active (4<SLEDAI-2K<10; n=14) and highly active disease (SLEDAI-2K≥10; n=12). (B) uMCP-1 in patients with SLE categorised by disease activity, inactive (SLEDAI-2K≤4; n=22), mildly active (4<SLEDAI-2K<10; n=9) and highly active disease (SLEDAI-2K≥10; n=8). (C) Correlation between uMIF levels and SLEDAI-2K in patients with SLE (n=64). (D) Correlation between uMCP-1 levels with SLEDAI-2K in patients with SLE (n=39). (E) uMIF in patients with SLE categorised by renal disease activity, inactive (renal SLEDAI-2K=0; n=48), and active renal disease (renal SLEDAI-2K>0; n=16). (F) uMCP-1 in patients with SLE categorised by renal disease activity, inactive (renal SLEDAI-2K=0; n=28), and active renal disease (renal SLEDAI-2K>0; n=11). (G) uMIF in patients with SLE with no flare (n=51) vs flare of disease (n=11). Panels A, B, E–G: Horizontal bars indicate medians and corresponding error bars indicate IQRs. Panels A and B: Medians were compared using Kruskal-Wallis test followed by Dunn’s multiple comparison test. Panels C and D: Spearman’s rank test was used to determine correlations between variables. Panels E–G: Medians were compared using Wilcoxon rank-sum test. MCP, monocyte chemoattractant protein; MIF, macrophage migration inhibitory factor; SLE, systemic lupus erythematosus; SLEDAI-2K, SLE disease activity index-2K score; uMCP-1, urinary monocyte chemoattractant protein 1; uMIF, urinary macrophage migration inhibitory factor.
Demographic, clinical and biological characteristics of the SLE cohort
Table 2uMIF and uMCP-1 according to demographic and clinical SLE parameters
Univariable associations of uMIF in SLE
Multivariable associations of uMIF with disease activity as primary exposure in SLE
No significant differences in uMIF levels were observed according to renal disease activity (figure 1E) or biopsy-confirmed LN (table 2). However, uMIF was higher in patients with SLE with proteinuria compared with those without (table 2), and this association was also confirmed in univariable linear regression (ratio of GM 1.65; 95% CI 1.01 to 2.69; p=0.05) (table 3), although attenuated after adjusting for ethnicity and flare (adjusted ratio of GM 1.44; 95% CI 0.91 to 2.3; p=0.12). We did not observe any statistically significant difference in uMIF levels according to the estimated glomerular filtration rate (table 2), consistent with a previous report on serum MIF.31
uMIF was significantly higher in patients with SLE with disease flare compared with those without (table 2; figure 1G), and this association was confirmed in univariable linear regression analysis (ratio of GM 1.9; 95% CI 1.08 to 3.32; p=0.03) (table 3), although attenuated after adjusting for ethnicity, disease activity and use of immunosuppressants (table 4). No significant difference in uMIF levels were observed according to the presence of irreversible organ damage. uMIF levels were significantly lower in patients with SLE receiving immunosuppressants when compared with those without (table 2). The use of other medications including glucocorticoids and hydroxychloroquine and also the presence or the absence of laboratory markers (ANA, anti-dsDNA Ab, anti-Sm Ab, low C3, low C4, elevated C reactive protein, elevated ESR) were not related to uMIF levels (table 2). Similarly, we found no correlation between uMIF and serological variables (data not shown).
In the subset of patients where both serum and uMIF were quantified, uMIF did not correlate with serum MIF (r=−0.17; p=0.31; n=39). We performed an additional sensitivity analysis comparing uMIF to serum MIF in this subset; uMIF remained significantly higher in patients with SLE with flare compared with those without, while no significant difference in serum MIF according to flare was observed (data not shown).
uMCP-1 concentrations in SLE
We quantified uMCP-1 in a subset of 39 patients with SLE in whom sufficient stored urine was available. uMCP-1 was detectable in 27/39 (69%) of these samples. Similar to uMIF, we found a statistically significant moderate positive correlation between uMCP-1 and overall SLEDAI-2K (r=0.47; p<0.01). uMCP-1 was also significantly higher in patients with SLE with highly active disease compared with those with inactive disease (figure 1B; table 2). In contrast to uMIF, however, uMCP-1 was significantly higher in patients with SLE with active renal disease compared with those without (figure 1F; table 2). Accordingly, uMCP-1 was significantly correlated with urine protein/creatinine ratio (r=0.56; p<0.01; n=38). uMCP-1 was also higher in patients with SLE with biopsy-confirmed LN compared with those without, with borderline significance (table 2).
Discussion
Here, we have assessed the clinical associations of uMIF in SLE in a study of patients from within a well-characterised single centre cohort. MIF is well-characterised as a potential pathogenic molecule in SLE and in LN, with evidence of protection from skin disease and nephritis in murine lupus models when MIF is deleted or antagonised and renal MIF expression in GN. Our data indicate that uMIF was higher in patients with SLE with higher disease activity compared with those with inactive disease, including when excluding serological or renal activity, suggesting uMIF as a potential SLE disease activity biomarker. Against expectations, given evidence of both the role of MIF in the pathogenesis of LN and its local expression in kidney, no significant difference in uMIF was observed according to renal disease activity measured using the renal domains of SLEDAI-2K or the presence of biopsy-confirmed LN. uMIF has previously been reported to be elevated in patients with proliferative nephropathies, in a cross sectional study of 63 patients which included 10 with SLE.22 uMIF was also described as being associated with overall and renal disease activity in paediatric SLE, in a cohort of only 10 children in which validated SLE disease activity scoring indices were not used.23 The same study also reported that uMIF was associated with histological severity of LN; however, this conclusion was drawn from a sample of only five patients.23 Although MIF plays a role in LN pathogenesis in SLE-prone animal models, the current results do not provide evidence supporting uMIF as a renal SLE biomarker. uMIF was not correlated with serum MIF, suggesting that the presence of MIF in the urine in these patients with SLE does not simply reflect renal excretion, but likely a combination of several mechanisms, potentially including in situ production by glomerular infiltrated leucocytes and/or tubular epithelial cells. Our findings are concordant with a previous report showing the absence of correlation between serum and urine MIF in patients with GN,22 but the relatively small size of the group with active nephritis means this lack of association must be interpreted with caution.
In contrast, uMCP-1 was higher in patients with SLE with active renal disease, proteinuria or with presence of biopsy-confirmed LN. We measured uMCP-1 in this study as a positive control, as previous reports on uMCP-1 indicated utility as a biomarker for LN.32 Our findings suggest that uMIF and uMCP-1 are markers of distinct aspects of SLE pathology. Moreover, uMIF was not correlated with uMCP-1 in our study (data not shown), despite serum concentrations of MIF and MCP-1 being recently shown to be highly correlated,18 further suggesting that the presence of each in the urine may reflect different mechanisms of excretion, inflammation or injury. Further research is needed to characterise mechanisms responsible for the presence of MIF in the urine.
The well-defined clinical phenotypic characteristics of the population of patients with SLE studied is a strength of this study. However, several caveats apply to the interpretation of our findings. First, this is a single-centre study, and potential bias may accordingly arise. Second, our study sample size was modest, although comparable to or larger than some prior studies on urinary biomarkers in SLE,3 4 33 and numbers of patients with active LN were small. Further prospective studies would be of interest to confirm these findings and whether uMIF has value in predicting clinical outcomes subsequent to measurement. Finally, only a subset of 39 patients had urine samples tested for both uMIF and uMCP-1.
In summary, uMIF was related to overall SLE disease activity, but not renal disease, while in contrast uMCP-1 was related to renal SLE disease activity. These findings are in line with emerging evidence base suggesting that clinically distinct subsets of SLE may be associated with the expression of different proinflammatory molecules. This has implications for identification of these subsets and potentially also for the selective application of targeted therapies.
Acknowledgments
The authors wish to thank the clinical staff of the Lupus Clinic at Monash Medical Centre, as well as the patients. The authors wish to thank the French Society of Rheumatology for its support.
References
Footnotes
RK-R and EFM contributed equally.
Contributors LS collected urine samples and both LS and FBV analysed them. FBV drafted the manuscript. All authors contributed to experimental design, analysis and drafting of the paper. All authors read and gave final approval of the version to be published.
Funding FM is recipient of fellowships from the NHMRC of Australia. EFM was supported by the Kim Jolly Lupus Research Trust, and the Monash lupus database has received support from Arthritis and Osteoporosis Victoria and unrestricted educational grants from Glaxosmithkline, UCB and Eli Lilly Australia.
Competing interests EFM has been consultants to GSK and Eli Lilly. The other authors have no conflict of interest to declare. This study had no external funding source.
Patient consent Obtained.
Ethics approval Human Research Ethics Committee, Monash Health.
Provenance and peer review Not commissioned; externally peer reviewed.
Data sharing statement Requests for non-identifiable data can be made to Dr Fabien B Vincent.