
Abstract
The nickel-nickel oxide  composites prepared from a mixture of Ni and
  or NiO powders at 900°C under 2000 atm for 2 h by hot isostatic pressing were employed as the anode for electrolytic production of
  In electrolysis of a molten
  with and without LiF at 100°C and at 25 mA/cm2, the anode gas generated at the
  composite anode was composed of


 and
and  and its composition was almost the same as that at the Ni sheet anode. The current efficiency for
  formation on the Ni-NiO composite anode from mixture of NiO and Ni powders was high compared with that on the
  composite anode from the mixture of
  and Ni powders. The best current efficiency for
  formation was ca. 53% on the Ni 5 mol % NiO composite anode, and it was almost the same as that of the Ni sheet anode. The addition of LiF in a molten
  increased it, presumably because of deposition of
  on the anode. On the other hand, the anode consumption of the Ni-NiO composite was much smaller compared with that of the Ni sheet electrode. Also, the oxygen content in the oxidized layer formed on the Ni-NiO composite anode was high compared with that on the Ni sheet anode. The scanning electron microscope observation revealed that the surface of the Ni-NiO composite anode was covered with the compact film having some defects. From these results, it is concluded that the Ni-NiO composite anode is favorable for electrolytic production of
  and that the oxidized layer on the anode has a high resistance to corrosion, because of the compact film containing a higher content of oxygen formed on the anode. © 2003 The Electrochemical Society. All rights reserved.
Export citation and abstract BibTeX RIS
A large amount of nitrogen trifluoride  is consumed as a dry etchant and a cleaner gas for the chemical vapor deposition (CVD) chamber by the electronic industry in Japan. Pure
  free from carbon tetrafluoride
  can be obtained by the electrolysis of
  with a nickel anode to meet the demand. However, a relatively large corrosion rate and passivation of the nickel anode are problems for electrolytic production of
  According to the previous works,1
2
3 the nickel dissolution is diminished by a trace of water in the melt whereas the current efficiency for
According to the previous works,1
2
3 the nickel dissolution is diminished by a trace of water in the melt whereas the current efficiency for  formation decreases. The surface layer on the anode formed in a molten salt containing water was dense and adhesive, and its oxygen content was high.2
3 When the oxidized layer on the nickel anode has a high content of nickel oxide, it has a higher electric conductivity and a higher resistance to corrosion.4 Although a
formation decreases. The surface layer on the anode formed in a molten salt containing water was dense and adhesive, and its oxygen content was high.2
3 When the oxidized layer on the nickel anode has a high content of nickel oxide, it has a higher electric conductivity and a higher resistance to corrosion.4 Although a  -coated Ni sheet anode prepared by atmospheric plasma spraying technique has almost same current efficiency for
  formation as that on the Ni sheet anode and a relatively small anode consumption, the
  layer having the thickness of 20 to 50 μm is dissolved during electrolysis for only 120 h, so that the lifetime of the
  layer in a dehydrated melt of
  may be insufficient.5 Hence, a
 composite was prepared from mixture of Ni and
  or NiO powders by hot isostatic pressing (HIP).
This paper deals with the effect of the content of nickel oxide in the composite on the current efficiency for  formation and the anode consumption.
Experimental
A mixture of  (particle size of 1 to 3.3 μm) and Ni (purity of 99.9%, particle size of 74 μm) powders and that of NiO (purity of 97.0%, particle size of 1 μm) and Ni (purity of 99.0%, particle size of 2.9 to 3.6 μm) powders were sintered at 900°C under 2000 atm for 2 h by HIP. The former and the latter are denoted as
 and Ni-NiO composites, respectively, in this paper. The concentrations of
  and NiO in the mixture were 0, 2, 5, 10, and 20 mol %. These samples were used as composite electrodes, and the anodic behaviors of them were investigated in a dehydrated melt of
A box-type poly(tetrafluoroethylene) (PTFE) cell of ca. 0.5 dm3 in volume was provided for electrochemical and corrosion studies, and the cell configuration was described in the previous papers.1
3
4 A composite of 1 cm2 in surface area and the nickel sheet having a large surface area were used as the anode and the cathode, respectively. A nickel rod immersed in molten  saturated with
  was used as the reference electrode, and the potential was corrected to the potential of hydrogen evolution on a Pt plate, designated as V vs.
  in the text. The potential of this reference electrode determined at 100°C was
  vs.
vs.  during the electrochemical measurement. When the electrochemical measurement, the corrosion test, and the preparation of the specimen for the X-ray photoelectron spectroscopy (XPS) analysis were conducted, the PTFE cell was positioned in a dry box. Since the chemicals contained water to some extent, pre-electrolysis was conducted with a carbon anode at ca. 10 mA/cm2 for about 10 days to reduce the water content to less than 0.02 wt %6
7 or ca. 20 mmol per dm3 prior to the electrochemical, corrosion, and XPS studies. For the corrosion test, the nickel-nickel oxide composite anode as well as the Ni sheet anode were washed with water and methanol before weighing. The current losses caused by nickel dissolution with an assumption of two-electron transfer for Reaction 1 were calculated from the weight loss
during the electrochemical measurement. When the electrochemical measurement, the corrosion test, and the preparation of the specimen for the X-ray photoelectron spectroscopy (XPS) analysis were conducted, the PTFE cell was positioned in a dry box. Since the chemicals contained water to some extent, pre-electrolysis was conducted with a carbon anode at ca. 10 mA/cm2 for about 10 days to reduce the water content to less than 0.02 wt %6
7 or ca. 20 mmol per dm3 prior to the electrochemical, corrosion, and XPS studies. For the corrosion test, the nickel-nickel oxide composite anode as well as the Ni sheet anode were washed with water and methanol before weighing. The current losses caused by nickel dissolution with an assumption of two-electron transfer for Reaction 1 were calculated from the weight loss

The cell employed for electrolytic production of  was a cylindrical Ni cell (1.5 dm3) as described in the previous papers.1
8 The Ni sheet and the composite anodes of 19.2 cm2 in surface area were employed as the anode. The anode was located at the center of cell whereas the cell wall was utilized as the cathode. The Ni rod of 0.1 cm2 in surface area with pretreatment of anodic oxidation in a dehydrated melt of
was a cylindrical Ni cell (1.5 dm3) as described in the previous papers.1
8 The Ni sheet and the composite anodes of 19.2 cm2 in surface area were employed as the anode. The anode was located at the center of cell whereas the cell wall was utilized as the cathode. The Ni rod of 0.1 cm2 in surface area with pretreatment of anodic oxidation in a dehydrated melt of  was used as the reference electrode, and it is considered to function as a
  electrode. A nickel sheet skirt was provided between the anode and the cathode to separate the anode gas from hydrogen generated at the cathode so that explosion and the loss of
  are prevented. The cell bottom was covered with the PTFE sheet to avoid hydrogen evolution.
Electrolysis was conducted with the nickel cell at 100°C. Although the water content was high before start-up, it might be decreased by electrolysis to less than 0.02 wt % within 80 h.9 The anode gas was treated with NaF to eliminate HF before the chromatographic and IR spectroscopic analyses.1 The current efficiencies for the constituents were evaluated from the results of gas analysis and the flow rate of anode gas.1 9 10
In order to prepare the specimen for SEM, XPS, and X-ray diffraction (XRD) studies, the nickel-nickel oxide composite anode was electrolyzed at 25 mA/cm2 in a dehydrated melt of  at 100°C for 120 h. The test specimen was washed with 47% HF aqueous solution to remove adhesive melt on the surface prior to inspection by XPS, XRD, and SEM. ESCA-1000 (Shimadzu Seisakusho Ltd.) with an Al-Kα radiation (1400 eV) and RINT-2500 (Rigaku Electric Co. Ltd.) with a Cu
  radiation were used for the XPS and the XRD analyses.1
2
3
4
9
10
radiation were used for the XPS and the XRD analyses.1
2
3
4
9
10
Results and Discussion
Preparation of  and Ni-NiO composite materials by HIP.—

A nickel sample was at first prepared from a nickel powder by HIP. Its density was 8.8763 g/cm3, and was almost the same as that of the commercial nickel sheet (purity of 99.6%, Nilaco Corporation Co. Ltd.). Hence, it is found that the material prepared by HIP is dense and has a low porosity.
The  composites were prepared from a mixture of
  and Ni powder as a binder by HIP at 900°C under 2000 atm for 2 h. Figure 1 shows the XRD diagrams of the composites prepared. The top figure, labeled a, is the XRD patterns of the nickel specimen (specimen A) prepared by HIP, which is denoted as HIP Ni, in this paper. The middle and the bottom figures, labeled b and c, are of the Ni-10 mol %
  and the Ni-20 mol %
  composites, denoted as the 10 mol % and 20 mol % composites, respectively, in this paper. The Ni-10 mol %
  composite (specimen B) was composed of NiO and Ni, whereas the Ni-20 mol %
  composite (specimen C) was composed of NiO and Ni with a small amount of
  as shown in Fig. 1c. No
  was detected in both composites by the XRD analysis, so that
  seemed to be decomposed and/or reduced by heating with nickel powder according to Reactions 2
3
4, resulting in formation of
seemed to be decomposed and/or reduced by heating with nickel powder according to Reactions 2
3
4, resulting in formation of  and NiO4


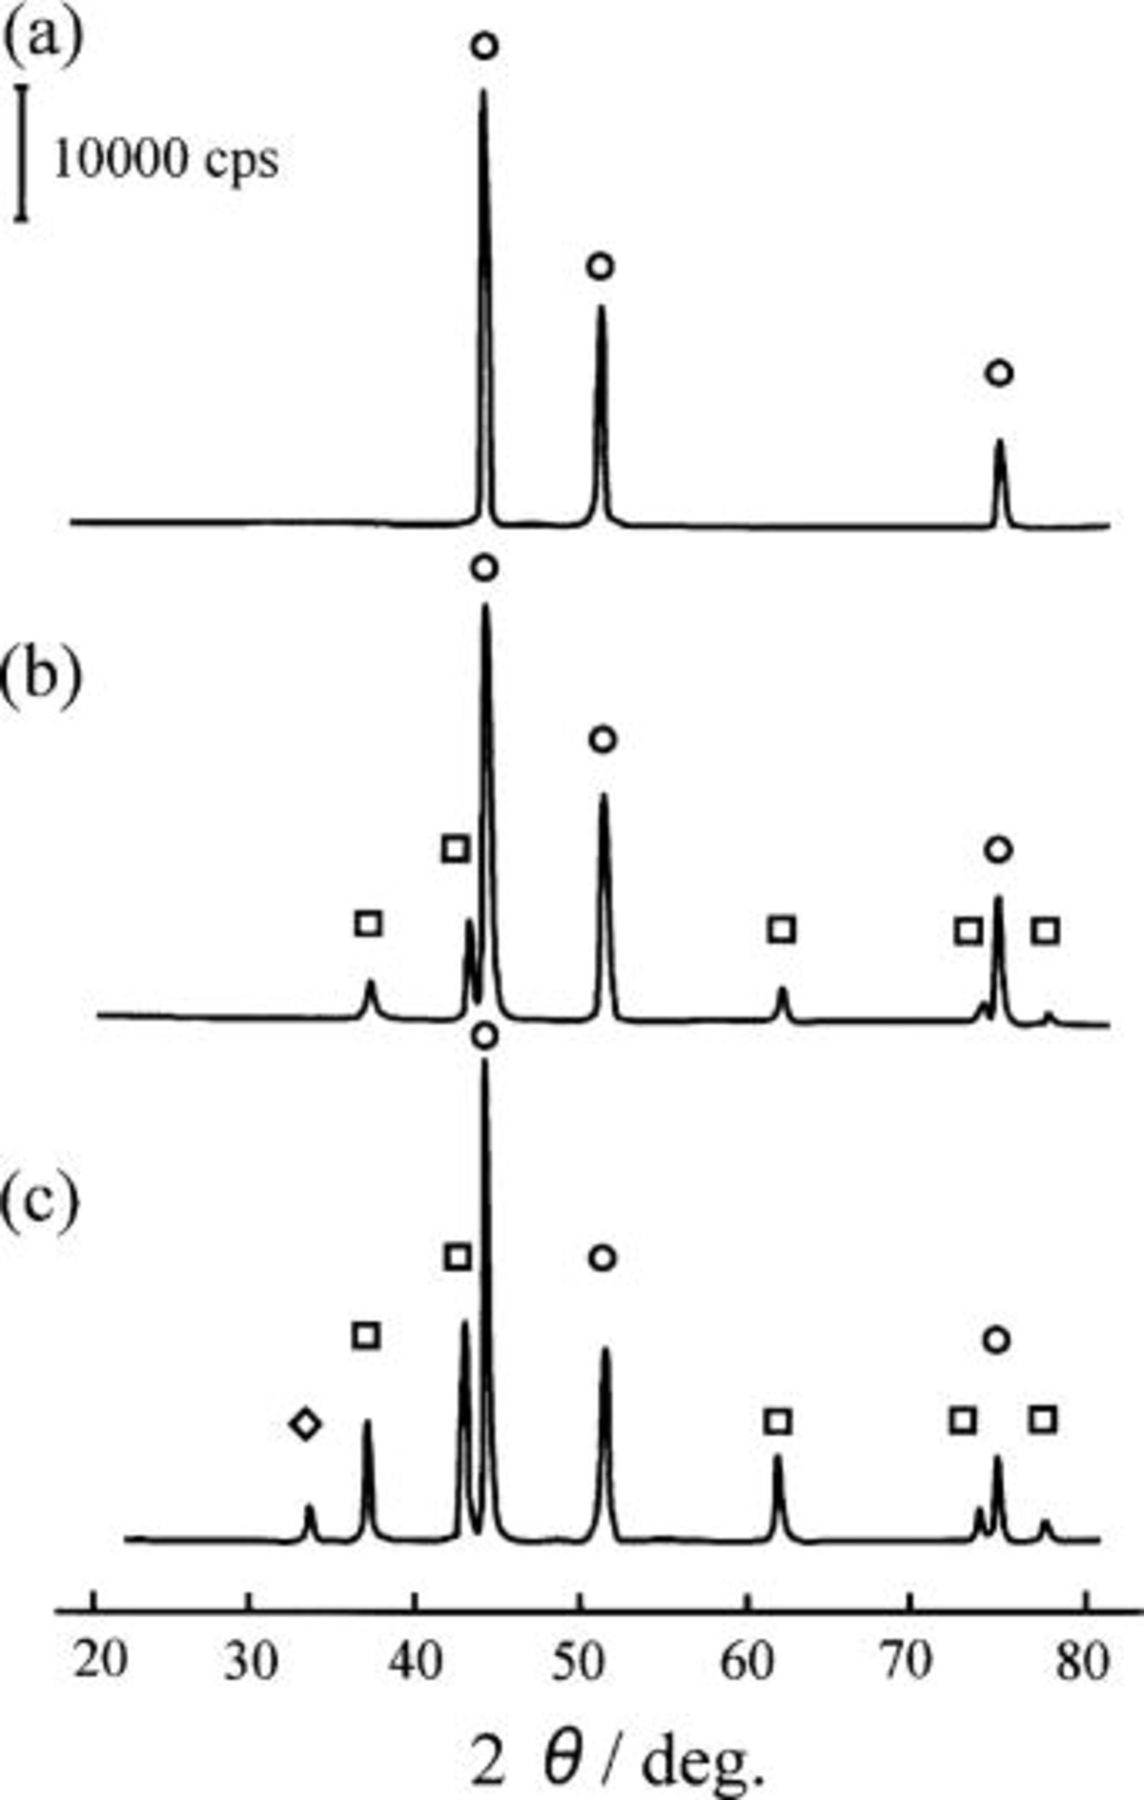
Figure 1. X-ray diffraction patterns of the (a) HIP Ni, (b) the 10 mol % composite, and (c) the 20 mol % composite materials prepared by HIP. (a) HIPed Ni, (b) Ni-10 mol %  composite, (c) Ni-20 mol %
  composite. (○) Ni, (▵) NiO, and (◊)
The specimen was also analyzed by XPS. Two small peaks at 530 and 532 eV on the O 1s spectra were found, and were assigned to NiO and  respectively. Hence, this material can be designated as the
  composite.
The Ni-NiO composites were also prepared from a mixture of NiO and Ni powders prepared by HIP under the same conditions as the previous procedure. Figure 2 shows the XRD diagrams of the composite prepared. The upper figure, labeled d, is the XRD pattern of the Ni-5 mol % NiO composite (specimen D), and the lower figure, labeled e, is of the Ni-10 mol % NiO composite (specimen E). Both composites were composed of NiO and Ni. A small peak at 530 eV was found on the O 1s spectra, and hence this material can be designated as the Ni-NiO composite.
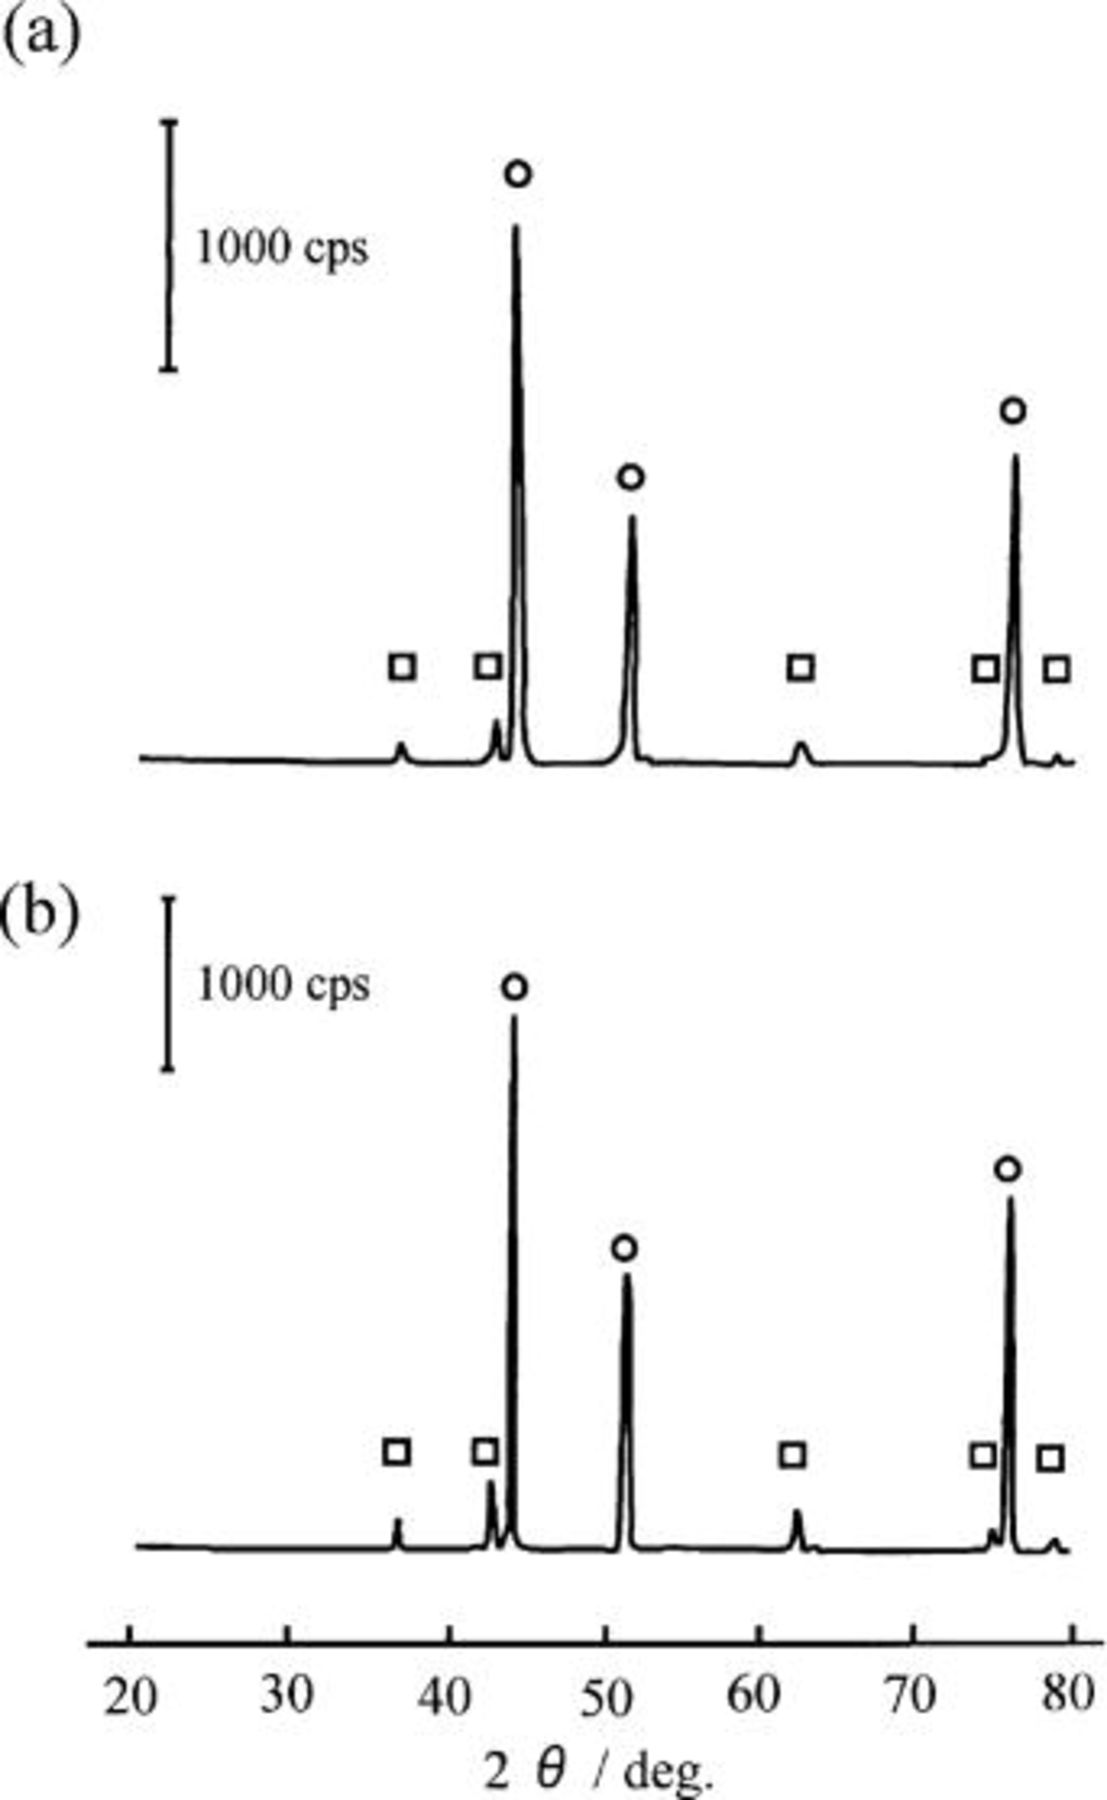
Figure 2. X-ray diffraction patterns of (a) the Ni-5 mol % NiO composite and (b) the Ni-10 mol % NiO composite materials prepared by HIP. (a) Ni-5 mol % NiO composite, (b) Ni-10 mol % NiO composite. (○) Ni, (□) NiO.
Anodic polarization curves.—
The anodic polarization curves of the specimens (specimens A, B, and C) were determined in a dehydrated melt of  at 100°C by the potential sweep method with a sweep rate of 5 mV/s, and are shown in Fig. 3
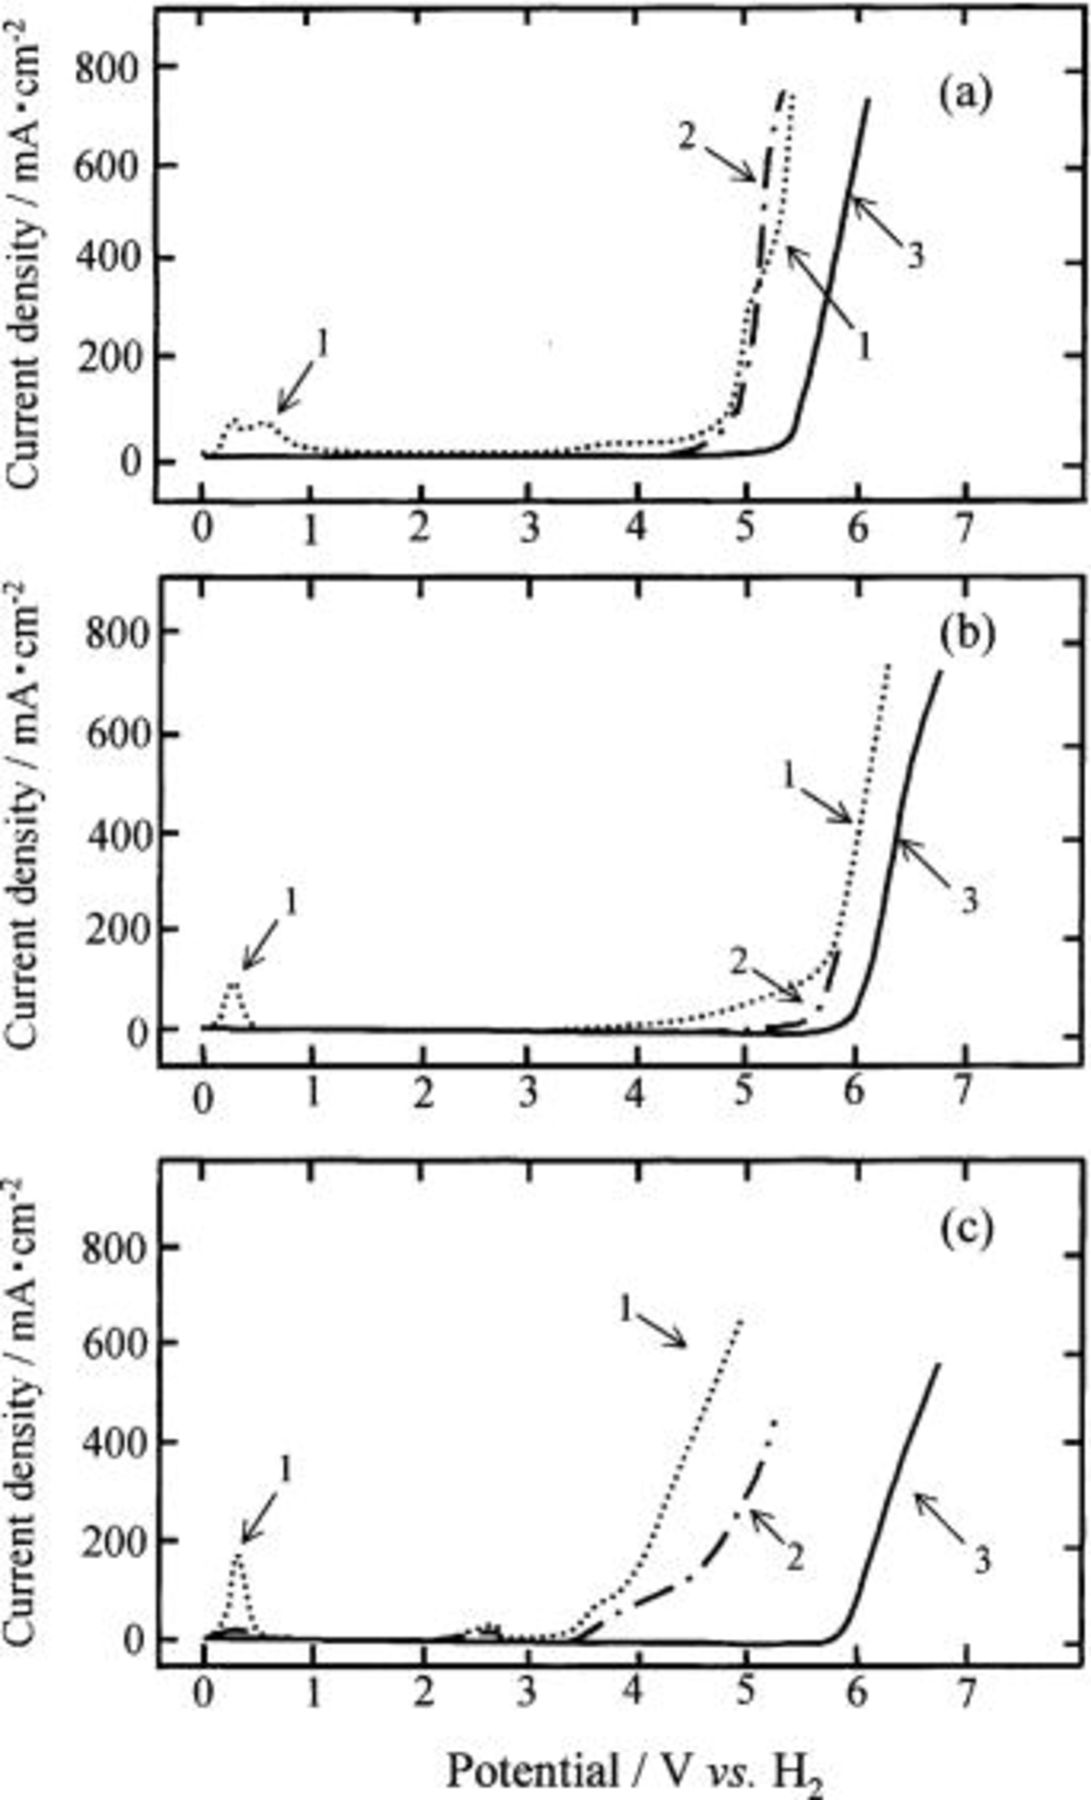
Figure 3. Anodic polarization curves of the (a) HIP Ni, (b) 10 mol % composite, and (c) 20 mol % composite anodes in a dehydrated melt of  at 100°C by the potential sweep method with a sweep rate of 5 mV/s. (a) HIP Ni anode, (b) Ni-10 mol %
  composite anode, (c) Ni-20 mol %
  composite anode.
The top figure, labeled a, is the anodic polarization curves of a HIPed Ni (specimen A). A virgin HIP Ni anode was dissolved in the potential range of 0 to 1 V and passivated in the range of 1 to 4 V (curve 1). The current density was increased with sweeping potential from 4 V to 5 V, probably caused by the fluorination of nickel.
The potential sweep measurement with the same specimen was repeated in the potential range of 0 V to ca. 8 V. Curve 2 is a trace of the second run, which differs from curve 1. The peaks caused by active dissolution of nickel at 0.3 and 0.6 V disappeared because of the formation of a protective layer composed of nickel fluoride with nickel oxide or oxyfluoride in the potential range higher than 4 V during the first run. No current passed at potentials lower than 4 V, but the current was increased thereafter. The current density was almost the same as that observed in the first run. Curve 3 represents the fiftieth run which is almost the same as of the second run whereas the amperage is somewhat smaller because of the growth of an oxidized layer during repetition of the sweeping potential.
The middle figure, labeled (b), and the bottom figure, labeled c, are of the 10 mol % (specimen B) and the 20 mol % composites (specimen C), respectively. The anodic polarization curves of the 10 mol % composite (specimen B) were almost the same as those of the HIP Ni anode (specimen A) with the exception of a potential shift in the direction of higher potential, presumably because of the formation of a thick oxidized layer compared with that formed on the HIP Ni anode. On the other hand, a new current peak at ca. 2.6 V appeared on the anodic polarization curve of the 20 mol % composite anode (specimen C) in the first and second runs, probably due to the oxidation of a trace of water contained in the melt and/or formed at the composite anode by reaction of nickel oxide with HF in the melt.
The anodic polarization curves of the Ni-NiO composite anodes (specimens D and E) were almost similar to that of specimen C.
Surface morphologies of the HIP Ni, the composite, and the Ni-NiO composite after electrolysis.—

Figures 4, 5, and 6 are the SEM profiles of the HIP Ni (specimen A), the 10 mol % composite (specimen B), and the 20 mol % composite anodes (specimen C) polarized at 5 V in a dehydrated melt of  at 100°C, respectively. The specimens were taken out of the melt under a steady state when the anodic current became constant. The upper photographs, labeled a, are of the surface of the oxidized layer, and the lower photographs, labeled b, are of the cross section. The HIP Ni specimen (specimen A) had a dense surface with few pores and the thickness of the oxidized layer was ca. 5 μm. The outer surface seemed to be dense whereas the inner oxidized layer was rough and lumpy. Since a specimen treated with dehydrated electrolyte is generally coated with a loose deposit having a number of crevices and pores,3 dehydration of the electrolyte by pre-electrolysis may have been conducted insufficiently in this case. The specimen of 10 mol % composite (specimen B) also had a dense surface as that of the HIP Ni. The oxidized layer had a thickness of only 2 to 3 μm, and it was very dense over the entire range of depth. On the other hand, the specimen of 20 mol % composite (specimen C) had a rough surface with a number of crevices and pores, and the thickness of the oxidized layer was 7 to 9 μm. Also, Fig. 7 shows the SEM profile of the 20 mol % composite anode electrolyzed at 25 mA/cm2 in the
  melt at 100°C for 120 h. The surface looked smooth, but the cross section revealed that the interior of the oxidized layer had many pores and cavities, presumably caused by dissolution of
  during electrolysis.
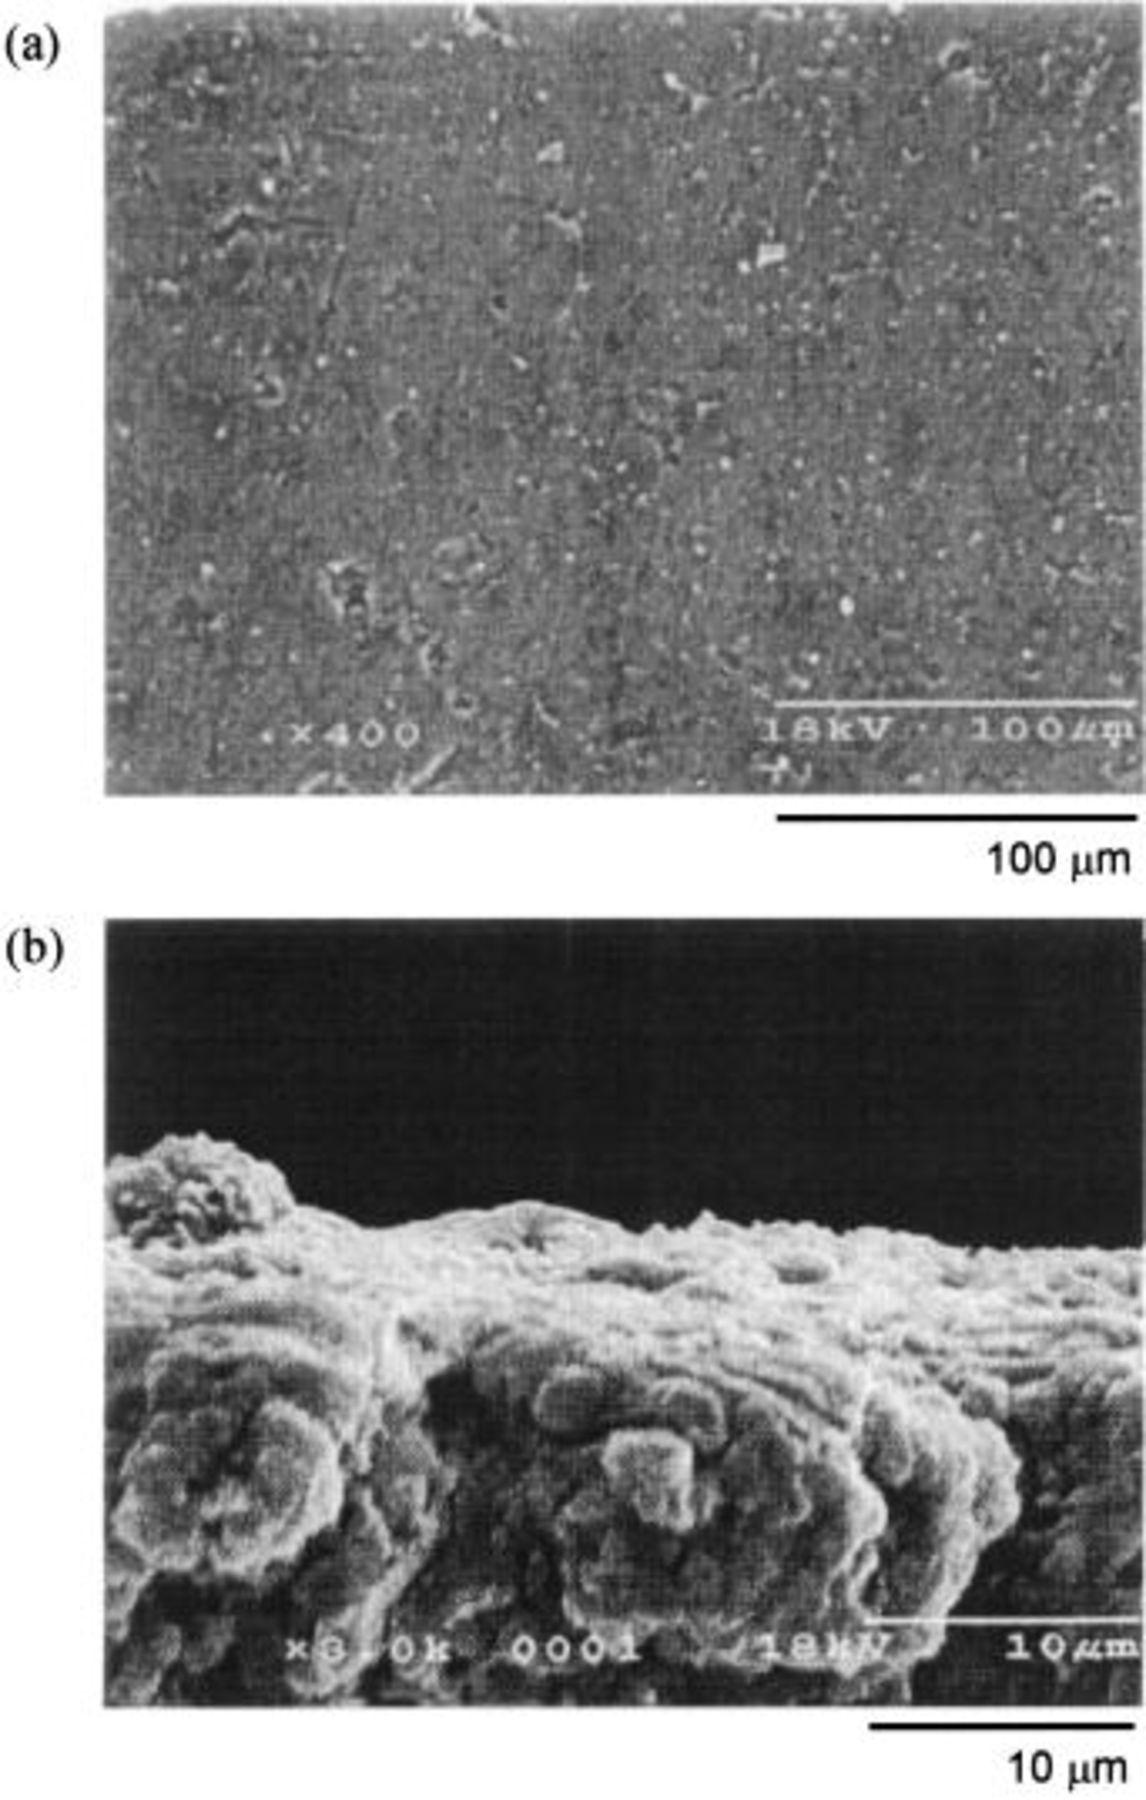
Figure 4. SEM images of the HIP Ni anode after electrolysis at 5 V in a dehydrated melt of  at 100°C. (a) Surface, (b) cross section.
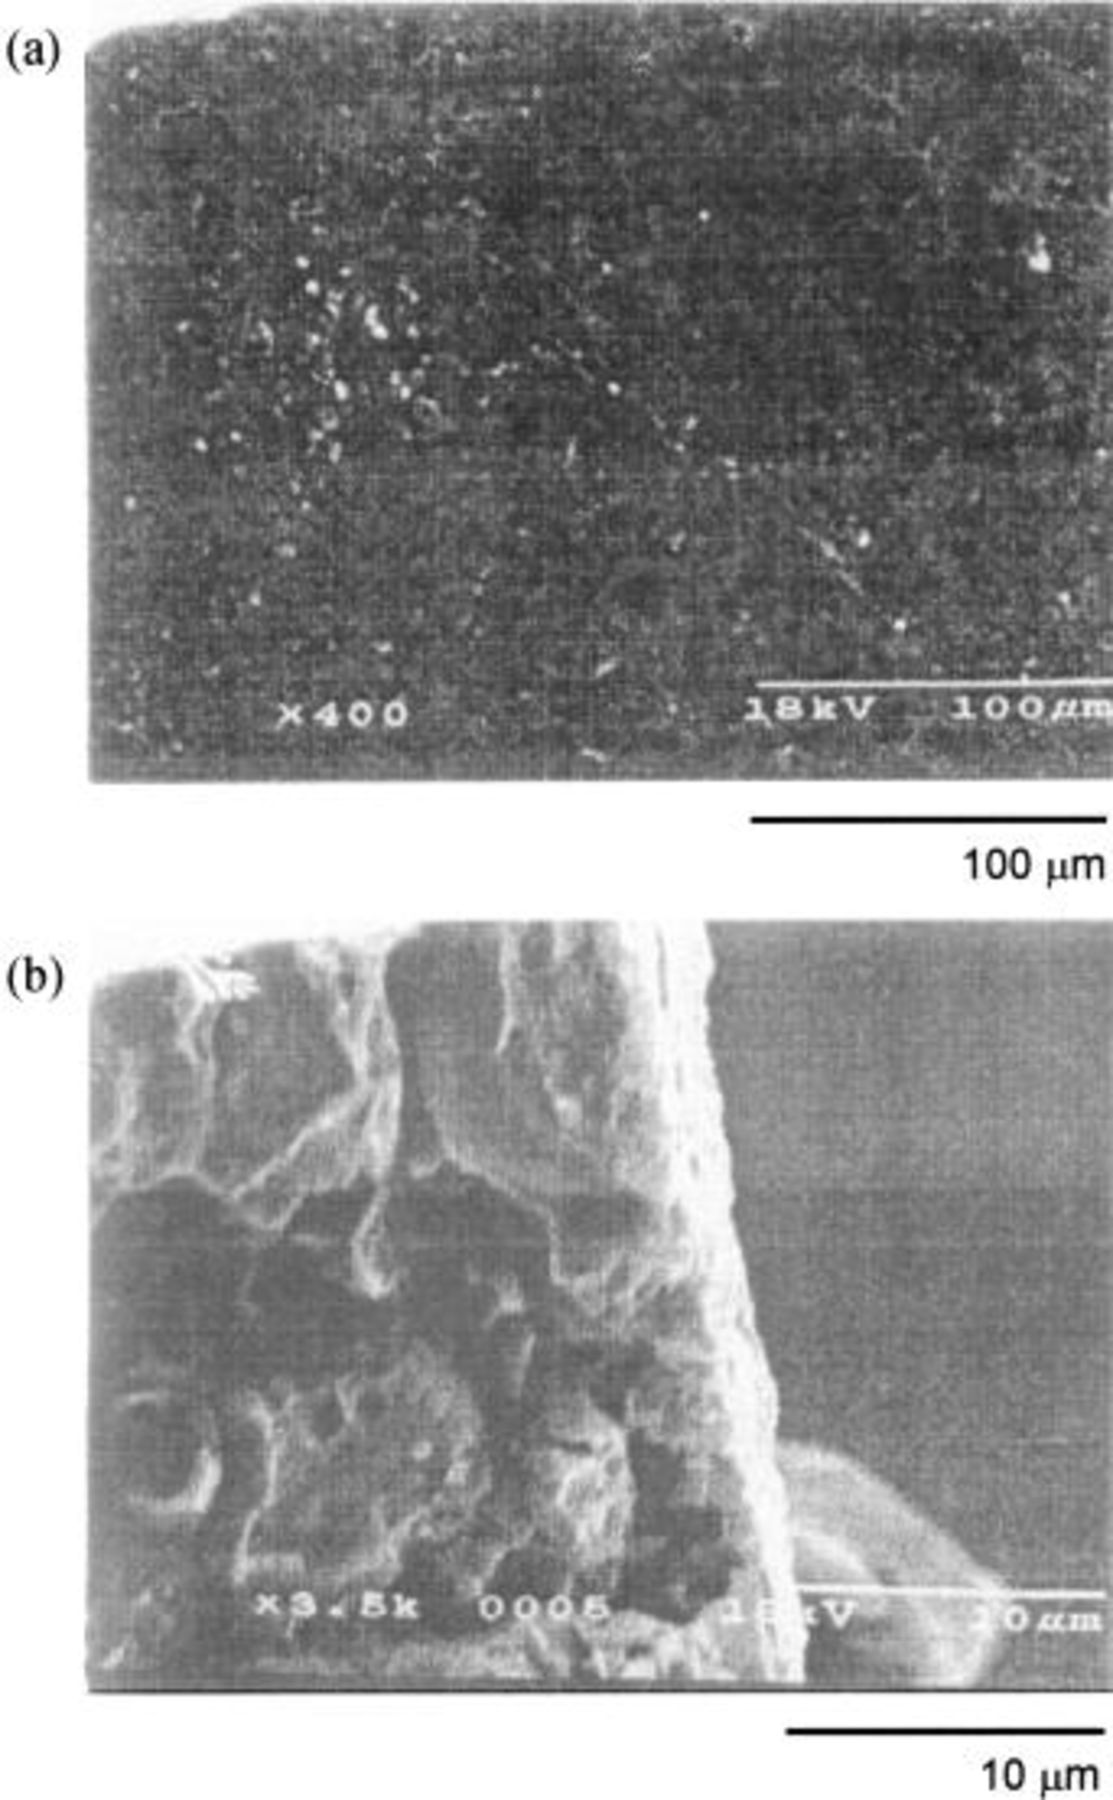
Figure 5. SEM images of the 10 mol % composite anode after electrolysis at 5 V in a dehydrated melt of  at 100°C. (a) Surface, (b) cross section.
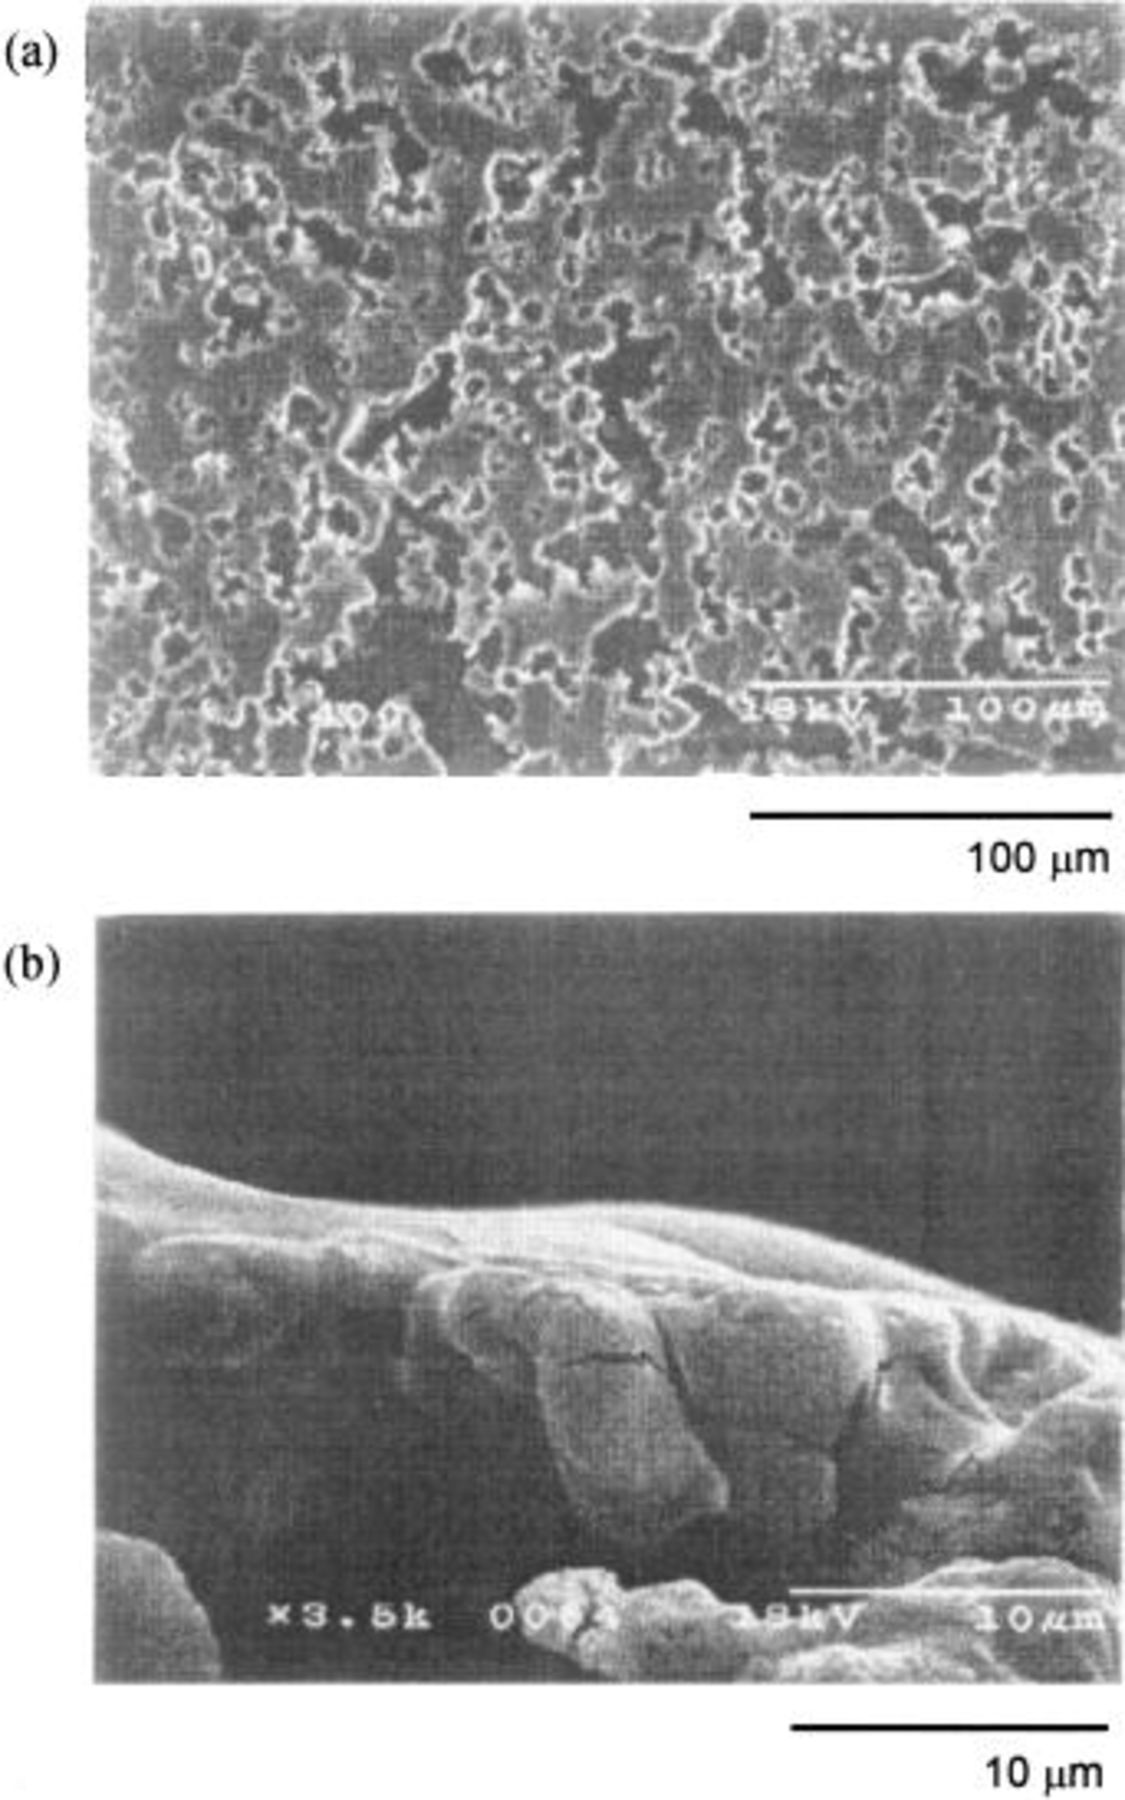
Figure 6. SEM images of the 20 mol % composite anode after electrolysis at 5 V for 90 min in a dehydrated melt of  at 100°C. (a) Surface, (b) cross section.
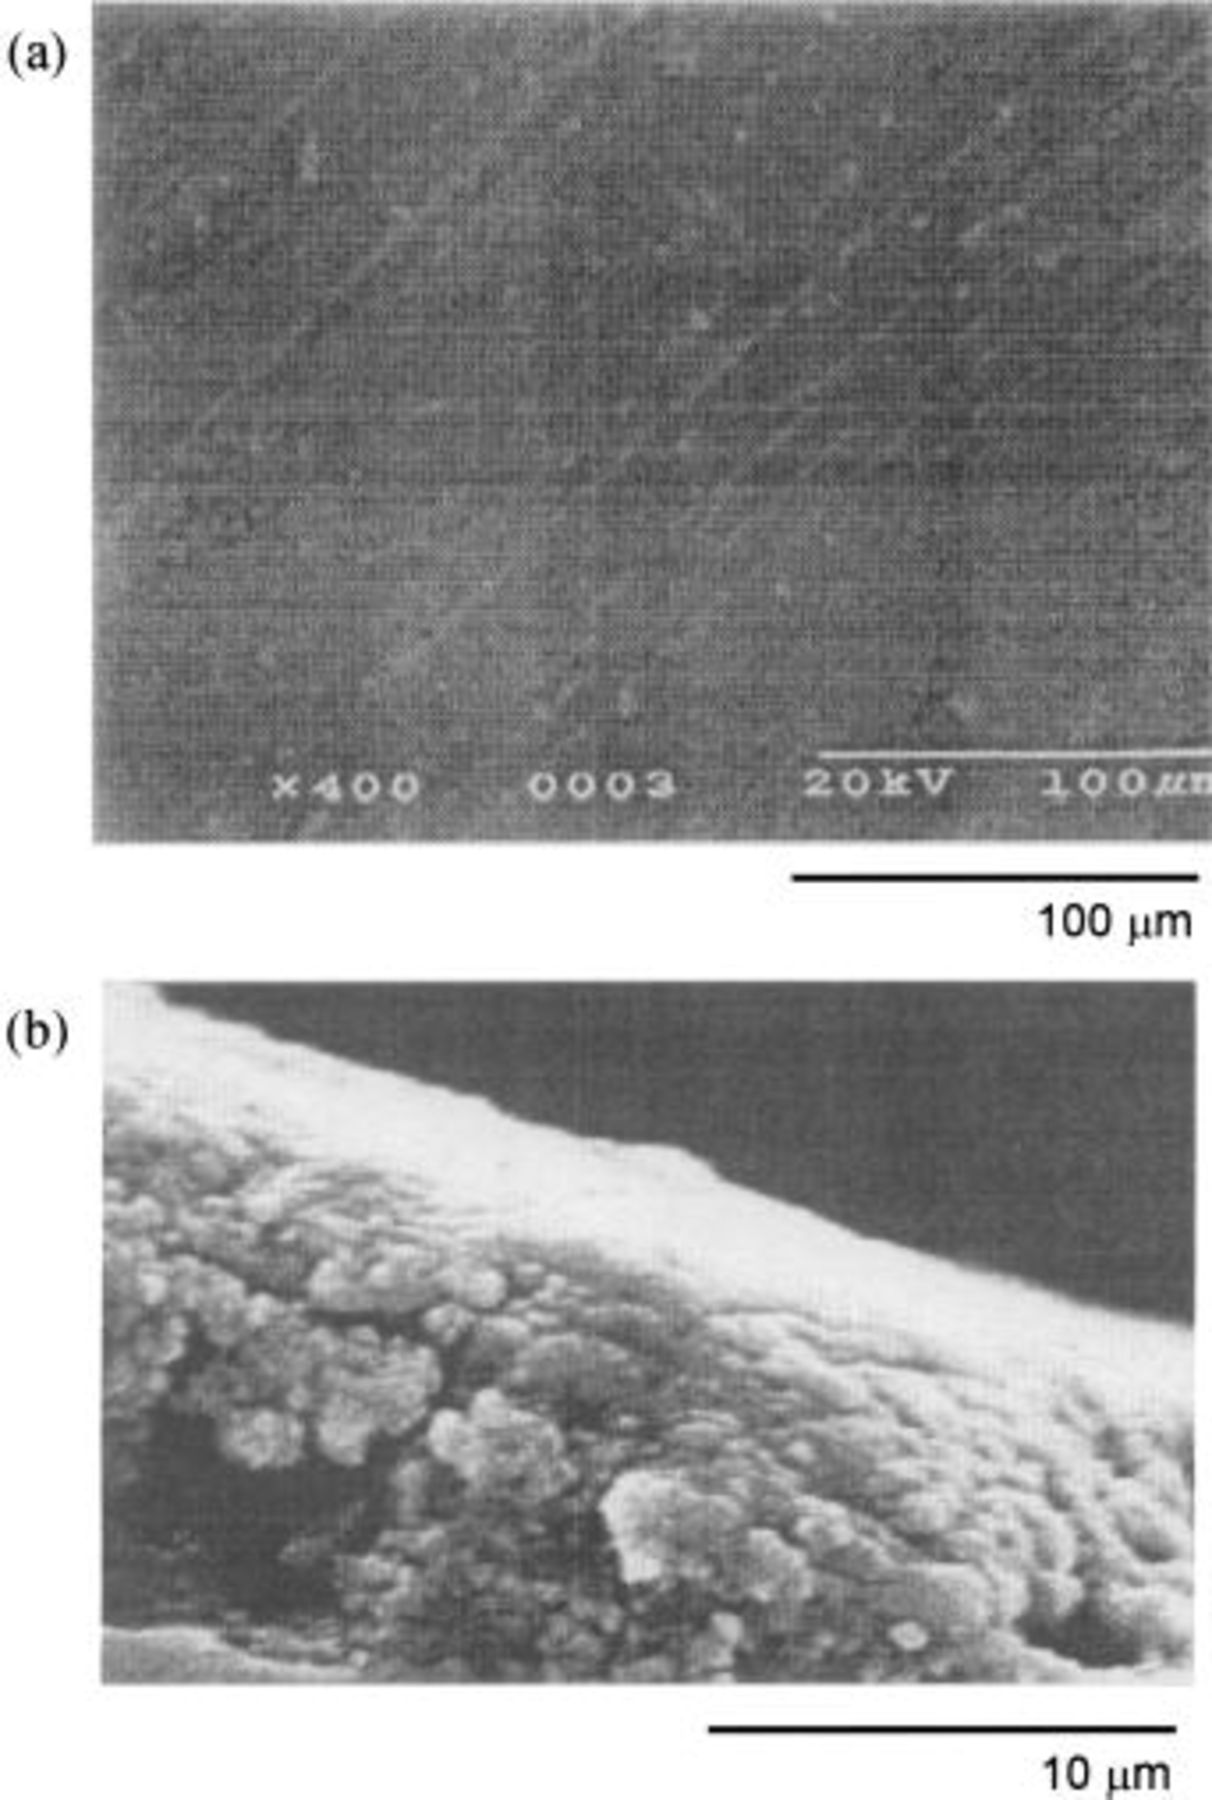
Figure 7. SEM images of the 20 mol % composite anode after electrolysis at 25 mA/cm2 for 120 h in a molten  at 100°C. (a) Surface, (b) cross section.
Figures 8a, b, and 9 also illustrate the SEM profiles of the Ni sheet, the Ni-5 mol % NiO composite (specimen D) and the Ni-10 mol % NiO composite anodes (specimen E) after electrolysis at 25 mA/cm2 for 120 h. The procedure used for preparation of the specimens was the same as described above. The upper and the lower photographs in Fig. 9, labeled a and b, are the surface and the cross section of the oxidized layers formed on the Ni-10 mol % NiO composite anode, respectively. The Ni-NiO composite specimens have the dense and adhesive surfaces of the oxidized layer containing a higher oxygen content.
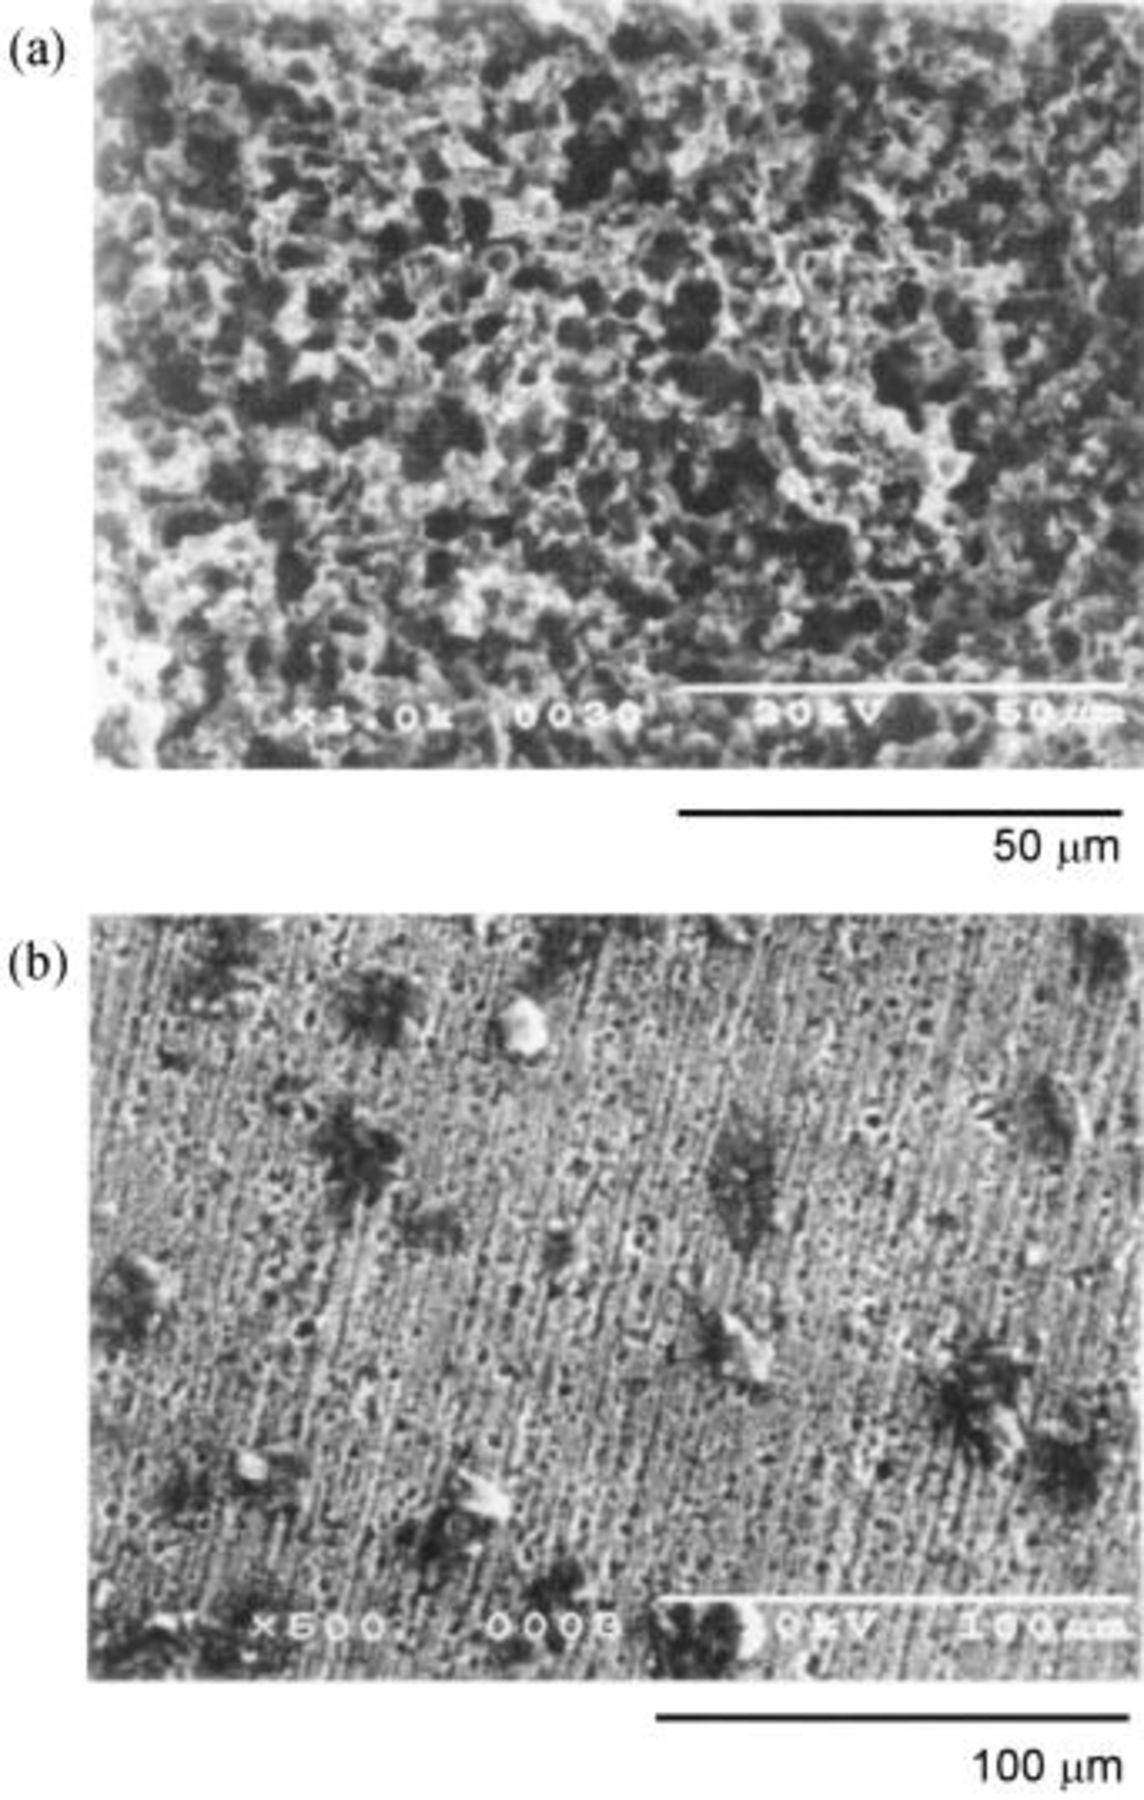
Figure 8. SEM images of the Ni sheet and the Ni-5 mol % NiO composite anodes electrolyzed at 25 mA/cm2 for 120 h in a molten  at 100°C (a) Ni sheet, (b) Ni-5 mol % NiO composite.
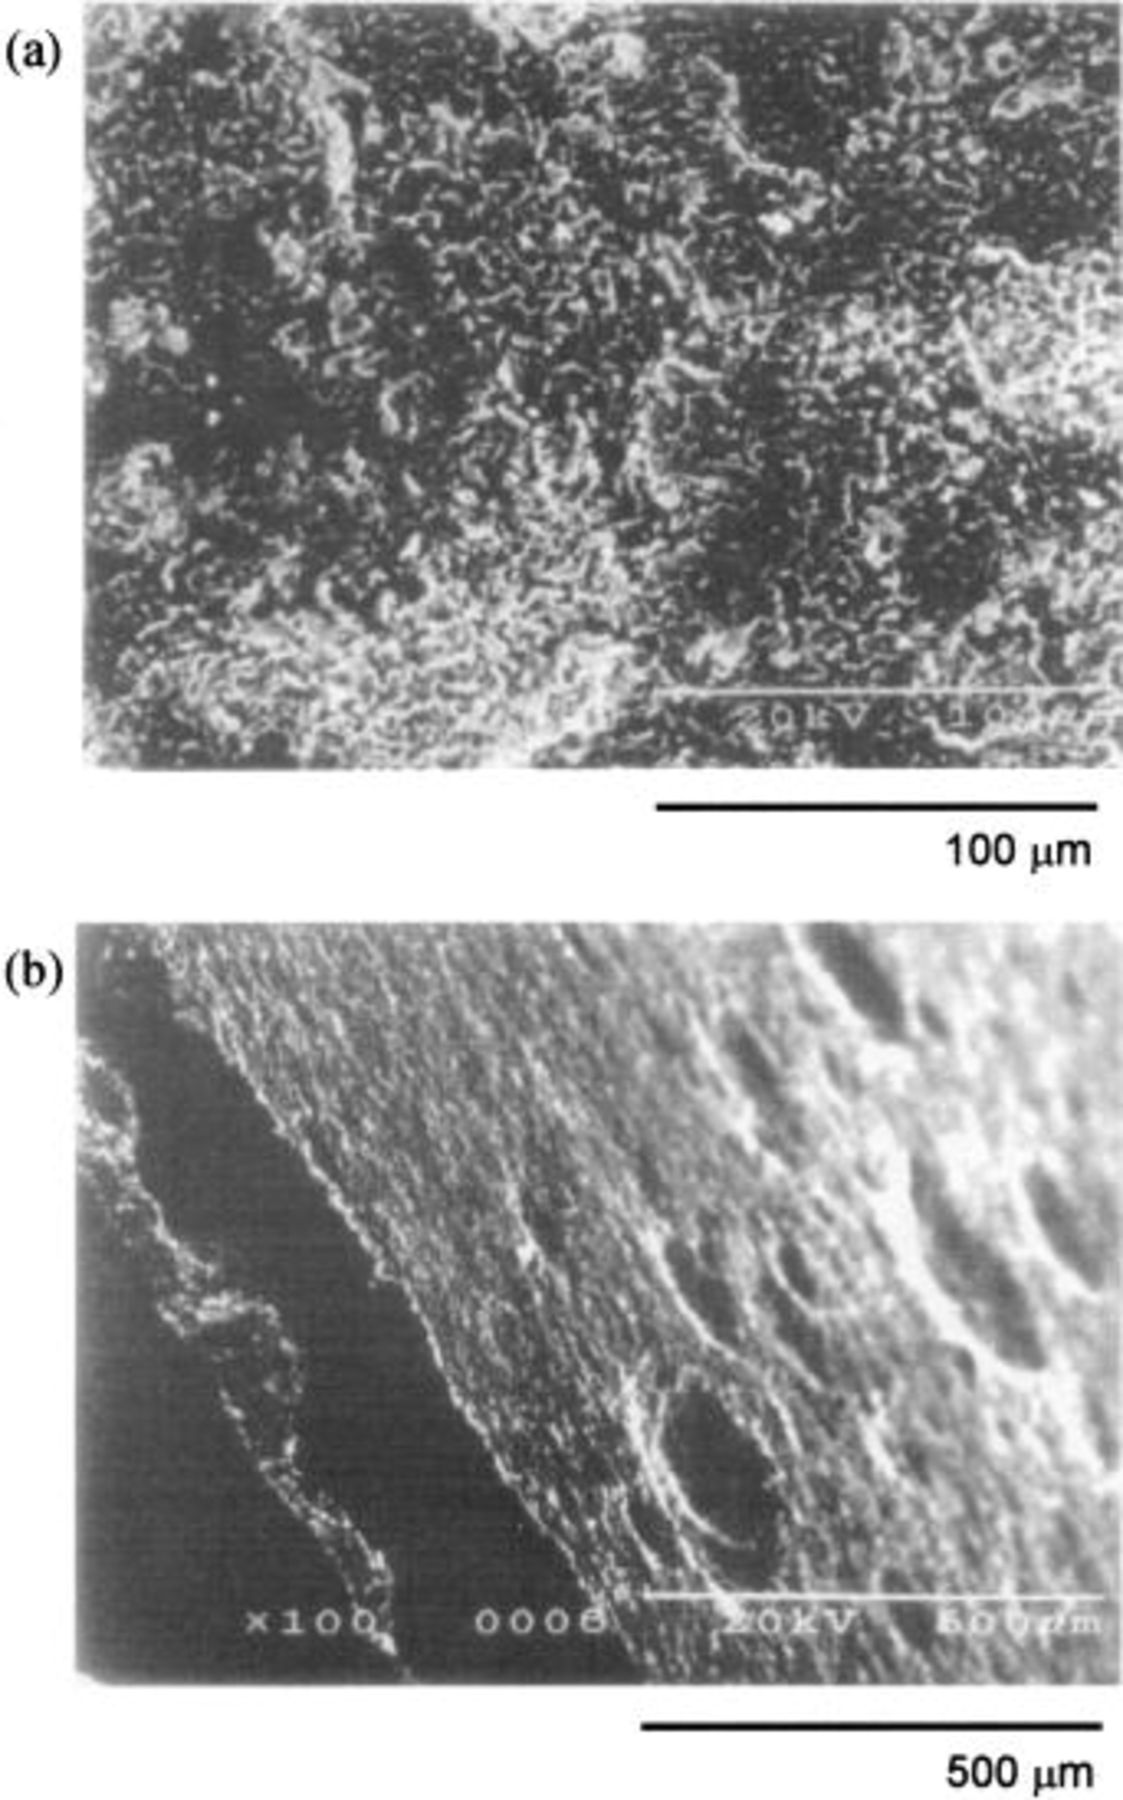
Figure 9. SEM images of the Ni-10 mol % NiO composite anodes electrolyzed at 25 mA/cm2 for 120 h in molten  at 100°C. (a) Surface, (b) cross section.
Electrolysis of a molten with the HIP Ni, the composite, and Ni-NiO composite anodes.—


Electrolysis of molten  was conducted at 25 mA/cm2 with the HIP Ni (specimen A), the 10 mol % composite (specimen B), the 20 mol % composite (specimen C), the Ni-2 mol % NiO (specimen D-1), the Ni-5 mol % NiO (specimen D), and the Ni-10 mol % NiO composite anodes (specimen E). The temperature of the electrolyte was kept constant at 100°C during the experiments. Figure 10 illustrates an example of the time variations of the gas composition on the 20 mol % composite anode (specimen C) and the cell voltage on the same anode. The upper figure, labeled a, is the time variation of the gas composition on the 20 mol % composite anode (specimen C) and the lower figure, labeled b, is the time variation of the cell voltage on the same anode. The anode gas was composed of


 and
and 
 was evolved at 20 h after switch-on, because the cell voltage attained 5 V. The current efficiency for
  formation reached ca. 48% at 20 h, then it decreased acutely and became ca. 24% after electrolysis for about 60 h. However, the anode gas evolved at ca. 3 V for the first 20 h was composed of
 and
and  without any fluorine-containing compound. With this result, it becomes evident that a new current peak at ca. 2.6 V obtained on the potential sweep curve of the 20 mol % composite anode (specimen C), as shown in Fig. 3c, would be due to the direct discharge of water and ammonium ion in the melt.
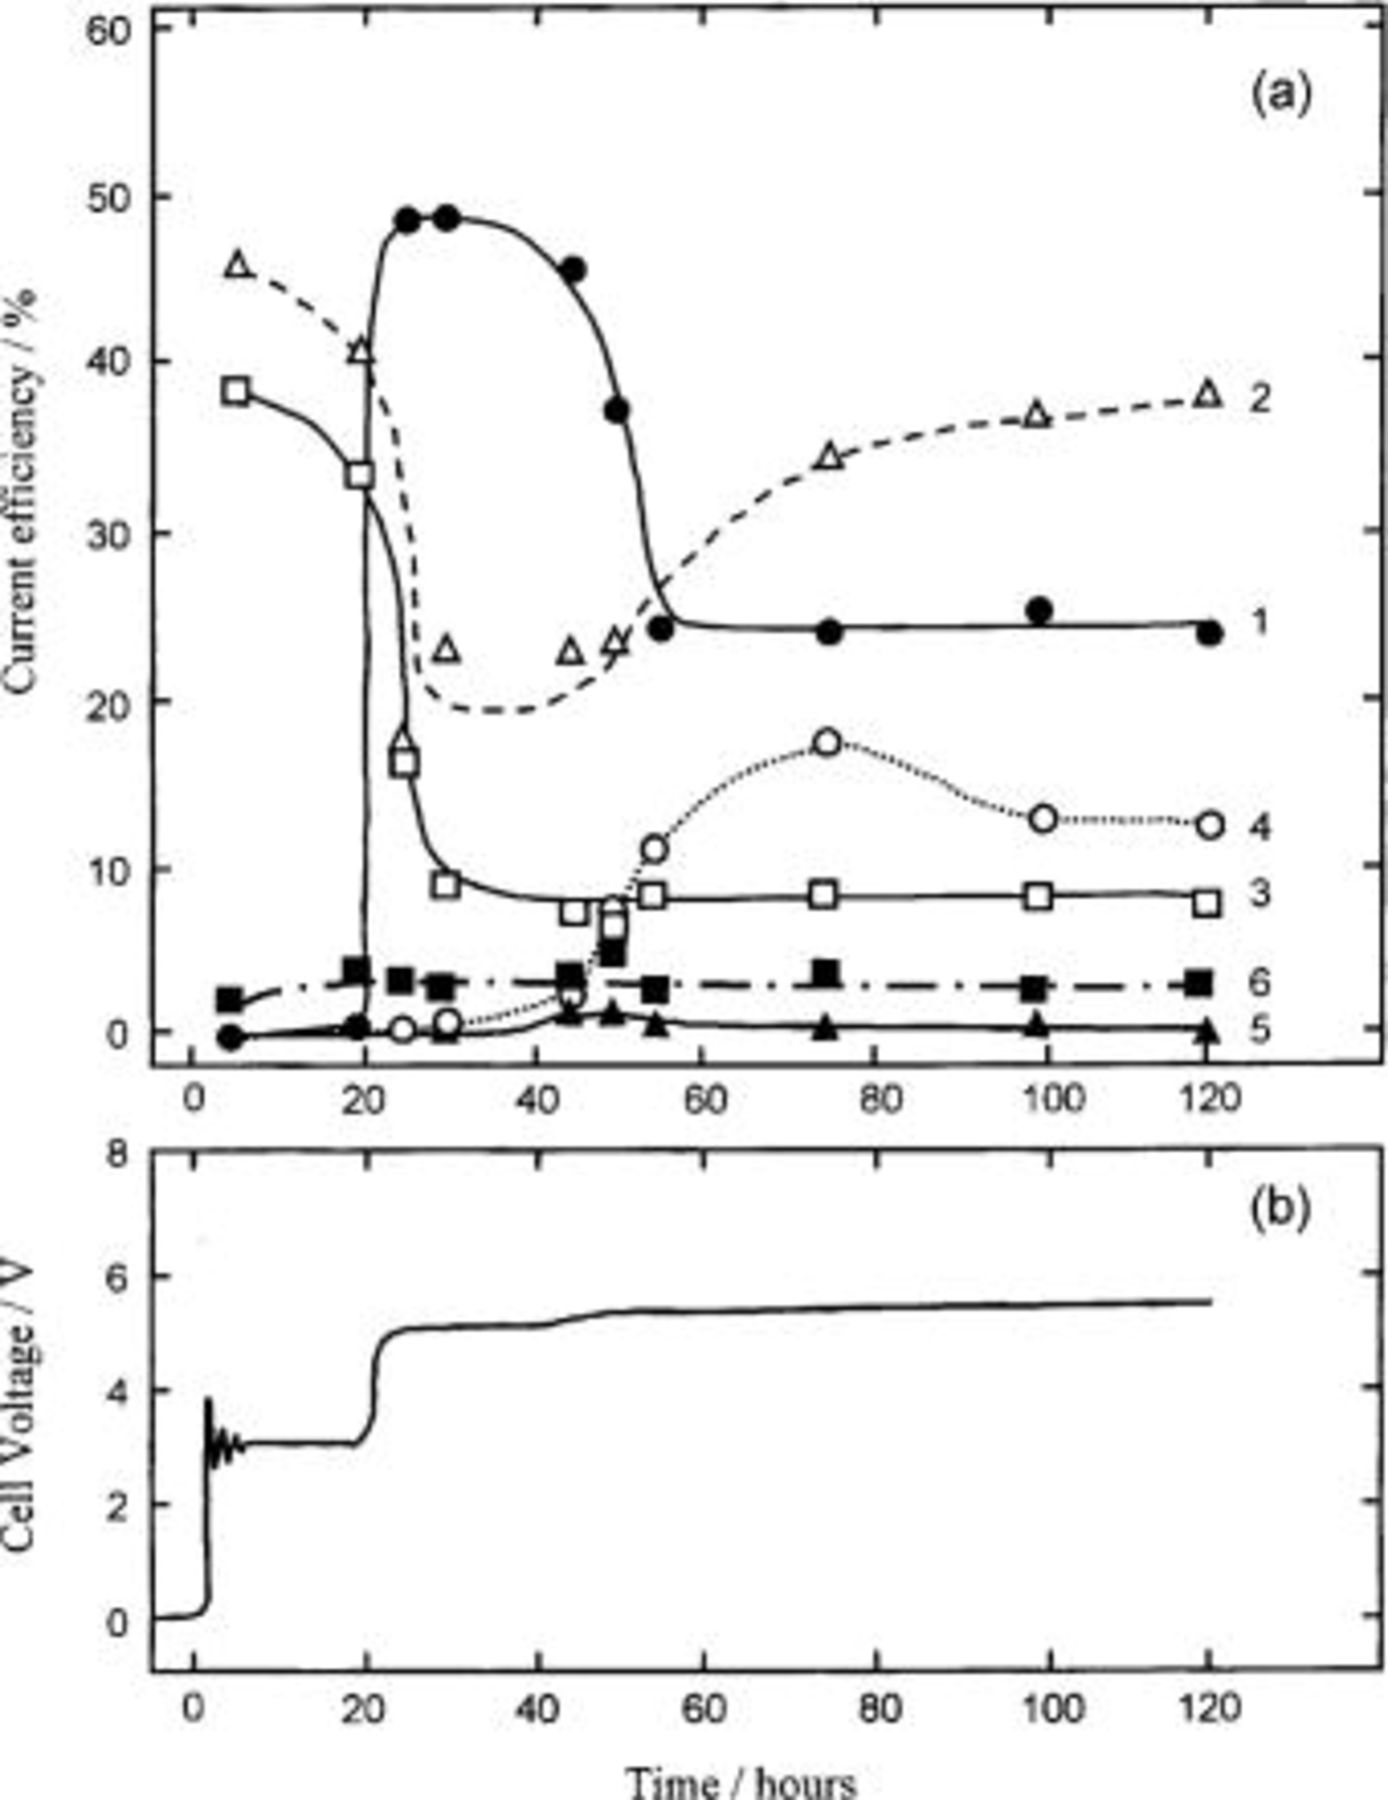
Figure 10. The time variations of the gas composition on the (a) 20 mol % composite anode and (b) the cell voltage on the same anode electrolyzed at 25 mA/cm2 in a molten  at 100°C. (a) Time variation of the gas composition on the Ni-20 mol %
  composite anode. 1 (•);
  2 (▵);
  3 (□);
  4 (○);
  5 (▴);
  and 6 (▪);
  (b) Time variation of the cell voltage on the same anode.
Table I shows the current efficiencies for the constituents in the anode gas, the overall generation of anode gas, and hydrogen evolved at the cathode, and the current loss caused by Ni dissolution. Electrolysis with an anode of commercial nickel sheet (specimen A-1) was conducted as a control. The current efficiency for  formation on the 10 mol % composite anode (specimen B) was small compared with those on the HIP Ni (specimen A) and the Ni sheet anodes (specimen A-1), and the anode consumption of the 10 mol % composite anode (specimen B) was small compared with those of specimens A-1, A, and C. In contrast, the current efficiency for
  formation on the 20 mol % composite anode (specimen C) was small and its anode consumption was high compared with those of specimens A-1, A, and B. On the other hand, the current efficiency for
  formation on the Ni-NiO composite anode (specimen D-1, D, and E) electrolyzed in a molten
  was 49.5 to 52.8%, and it was almost the same as or somewhat smaller compared with that of the Ni sheet anode. The addition of LiF in molten
  increased the current efficiency for
  formation. The anode consumption of the Ni-NiO composite anode was 0.093 to 0.503% and was small compared with that of the Ni sheet anode. In the Ni-NiO system, the Ni-5 mol % NiO composite material (specimen D) was the best for the current efficiency for
  formation and the resistance to corrosion.
Table I.
Current efficiencies for the constituents in the anode gas, the overall anode gas, and the cathode gas, and current loss caused by Ni dissolution  on the Ni sheet, the HIP Ni, the on the Ni sheet, the HIP Ni, the  composite, and the Ni-NiO composite anodes electrolyzed at 25 mA/cm2 in a molten composite, and the Ni-NiO composite anodes electrolyzed at 25 mA/cm2 in a molten  with and without LiF at 100°C. Anode with and without LiF at 100°C. Anode  | |||||||||||
|---|---|---|---|---|---|---|---|---|---|---|---|
| Specimen | Anode material | Duration(hours) | Current efficiency of anode gases and the cathode gas/percent | Current losscaused by Nidissolution
 % % | |||||||
 |
 |
 |
 |
 |
 | Overall |
 | ||||
| A-1 | Ni sheet | 100 | 13.47 | 12.14 | 62.34 | 0.47 | 2.87 | 3.08 | 94.36 | 91.50 | 3.22 |
| Ni sheet | 100 | 16.07 | 9.85 | 51.78 | 1.01 | 2.37 | 4.63 | 85.70 | 82.40 | 2.31 | |
| A | HIP Ni | 120 | 14.96 | 7.71 | 60.80 | 1.83 | 2.92 | 3.69 | 91.91 | 87.99 | 2.18 |
| B | Ni-10 mol %  composite composite | 120 | 27.31 | 4.04 | 45.01 | 2.66 | 3.33 | 4.72 | 87.07 | 84.15 | 1.14 |
| C | Ni-20 mol %  composite composite | 120 | 38.72 | 8.03 | 24.63 | 0.41 | 12.96 | 3.19 | 87.94 | 83.53 | 2.26 |
Ni-20 mol %  composite composite | 25 | 17.31 | 16.03 | 48.40 | 1.39 | 1.74 | 2.81 | 87.68 | 83.05 | — | |
| D-1 | Ni-2 mol % NiO composite | 100 | 25.98 | 15.69 | 49.48 | 0.73 | 0.77 | 1.17 | 93.81 | — | 0.45 |
| D | Ni-5 mol % NiO composite | 115 | 17.96 | 15.73 | 52.80 | 0.50 | 0.78 | 2.06 | 89.82 | — | 0.093 |
Ni-5 mol % NiO  | 130 | 14.94 | 12.97 | 53.85 | 1.04 | 0.74 | 9.11 | 92.67 | — | 0.263 | |
| E | Ni-10 mol % NiO composite | 120 | 3.75 | 13.33 | 50.34 | 4.52 | 6.45 | 13.48 | 91.87 | — | 0.503 |
Ni-10 mol % NiO  | 109 | 12.26 | 8.34 | 53.79 | 5.89 | 0.95 | 13.28 | 94.51 | — | 0.279 | |
The XPS spectra of Ni  F 1s, and O 1s levels for the specimens D-1, D, and E after electrolysis of
  melts with and without LiF at 25 mA/cm2 for 120 h were similar to that those of specimens A, B, and C.13
14 The O 1s spectra have peaks at 531 and 533 eV assigned to NiO and
melts with and without LiF at 25 mA/cm2 for 120 h were similar to that those of specimens A, B, and C.13
14 The O 1s spectra have peaks at 531 and 533 eV assigned to NiO and  respectively. This means that the oxidized layer of the Ni-NiO composite anode after electrolysis is mainly composed of
  with a small amount of nickel oxide having plural oxidation states. Figure 11 shows the depth profiles of the oxidized layer formed on the Ni-NiO composite anode after electrolysis. The ordinate shows the atomic ratio of F/O, which is evaluated from the XPS intensities of F 1s and O 1s, and the abscissa is the bombardment time corresponding to the depth. The open triangular and rectangular points are the data for the Ni-NiO system (specimen E), while the open circular points are of a bare Ni sheet anode (specimen A-1). The atomic ratio vs. time curve for the Ni-NiO composite specimens electrolyzed at 25 mA/cm2 in
  with and without 0.9 mol % LiF resembled that of a bare Ni sheet anode electrolyzed at the same current density, whereas the atomic ratio of the former was low compared with that of the latter. This means that the oxygen content in the surface layer on specimen E is high compared with that on a bare Ni sheet anode (specimen A-1).
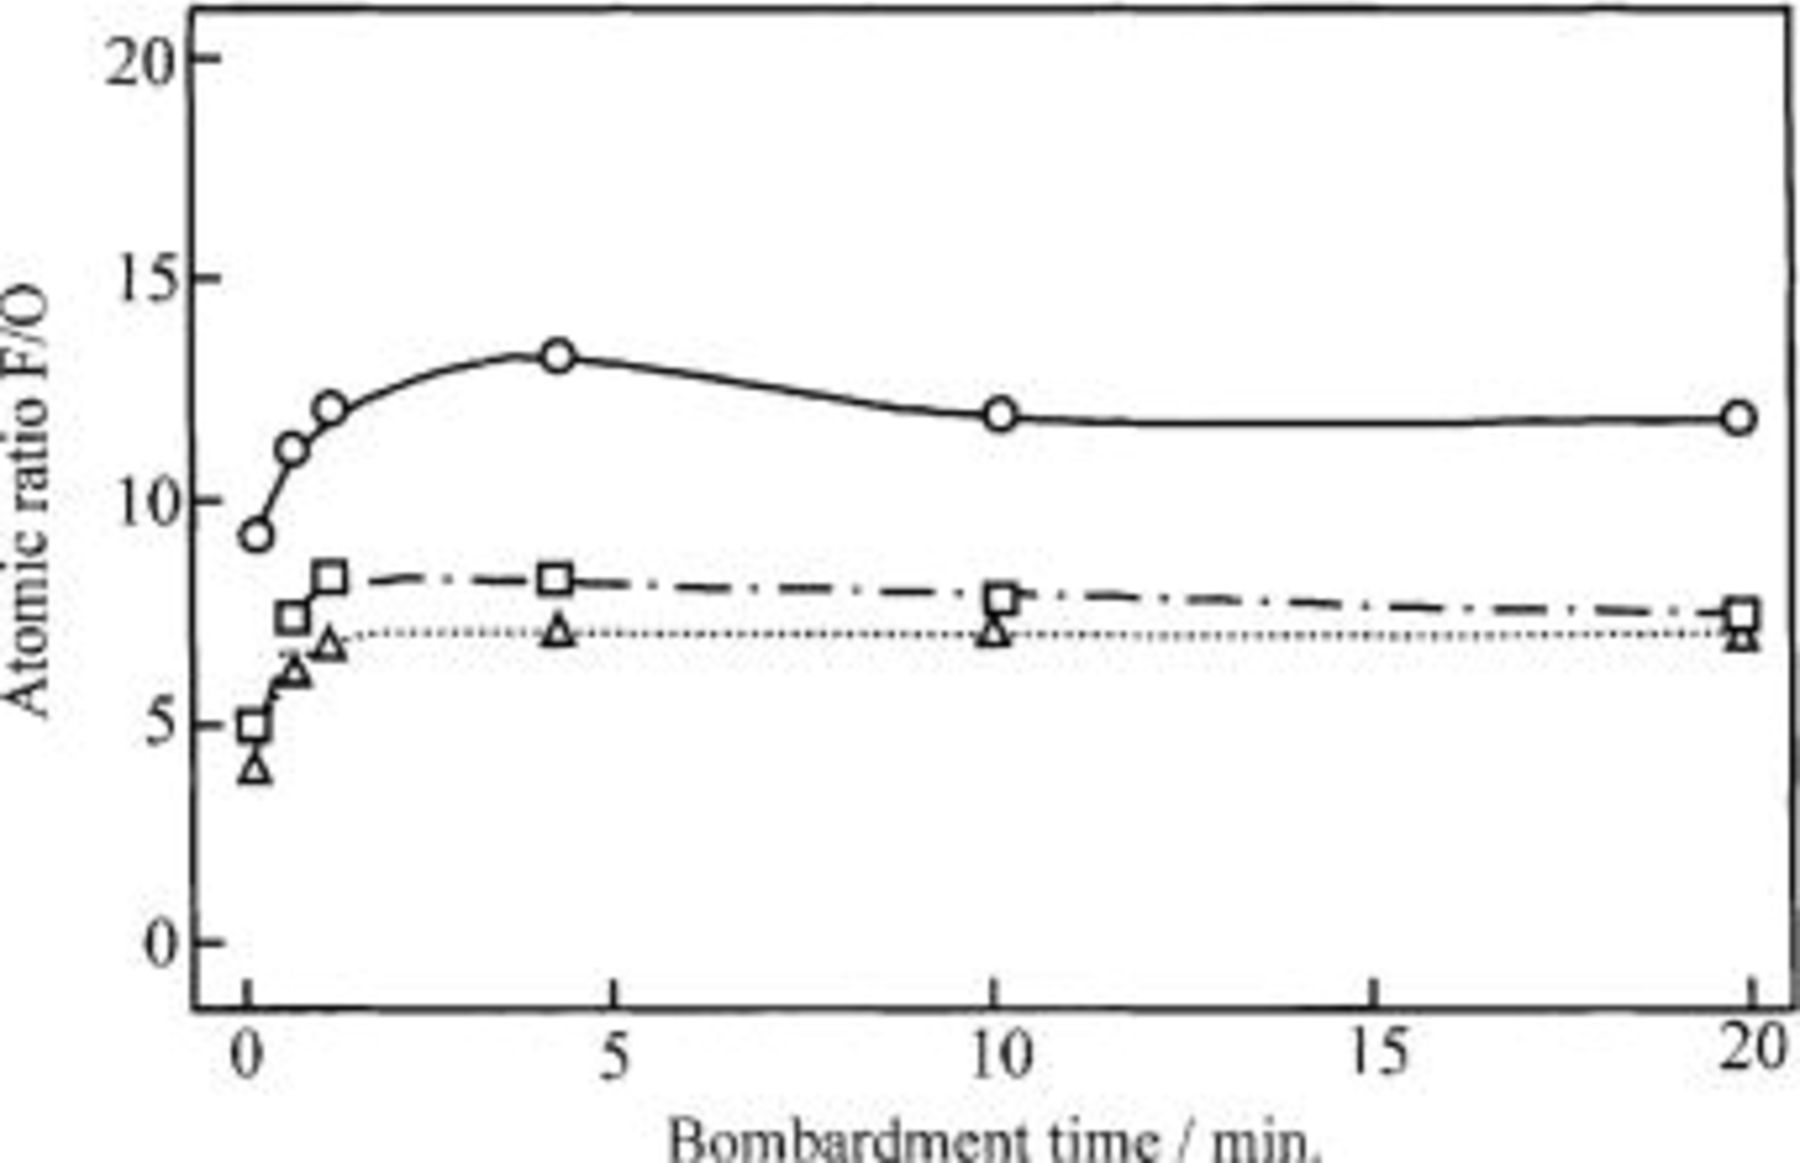
Figure 11. Depth profiles of the oxidized layer formed on the Ni sheet and the Ni-10 mol % NiO composite anodes electrolyzed at 25 mA/cm2 for 120 h in a molten  with and without LiF at 100°C. (○ Ni sheet anode electrolyzed in molten
  (▵) Ni-10 mol % NiO composite anode electrolyzed in a molten
  and (□) Ni-10 mol % NiO composite anode electrolyzed in a molten
  with 0.9 mol % LiF.
Figure 12 shows the XRD diagrams of the oxidized layer formed on the Ni-10 mol % NiO composite anode (specimen E) electrolyzed at 25 mA/cm2 in the  melts with (Fig. 12b) and without 0.9 mol % LiF (Fig. 12a). The XRD analysis revealed that the oxidized layer after electrolysis was composed of
  NiO, and Ni.
  was not observed on the XRD patterns. It may be caused by a very small amount of it. On the other hand, the layer formed only in the melt containing LiF had
  which was a product from hydrolysis of
 and/or 3) during washing the specimen with 47% HF aqueous solution. Since the solubility of
  in the
  melt may be very small,
  may deposit on the surface of the Ni-NiO composite anode and may also act as a fluorinating agent for
  at the anode.9
11
12
at the anode.9
11
12
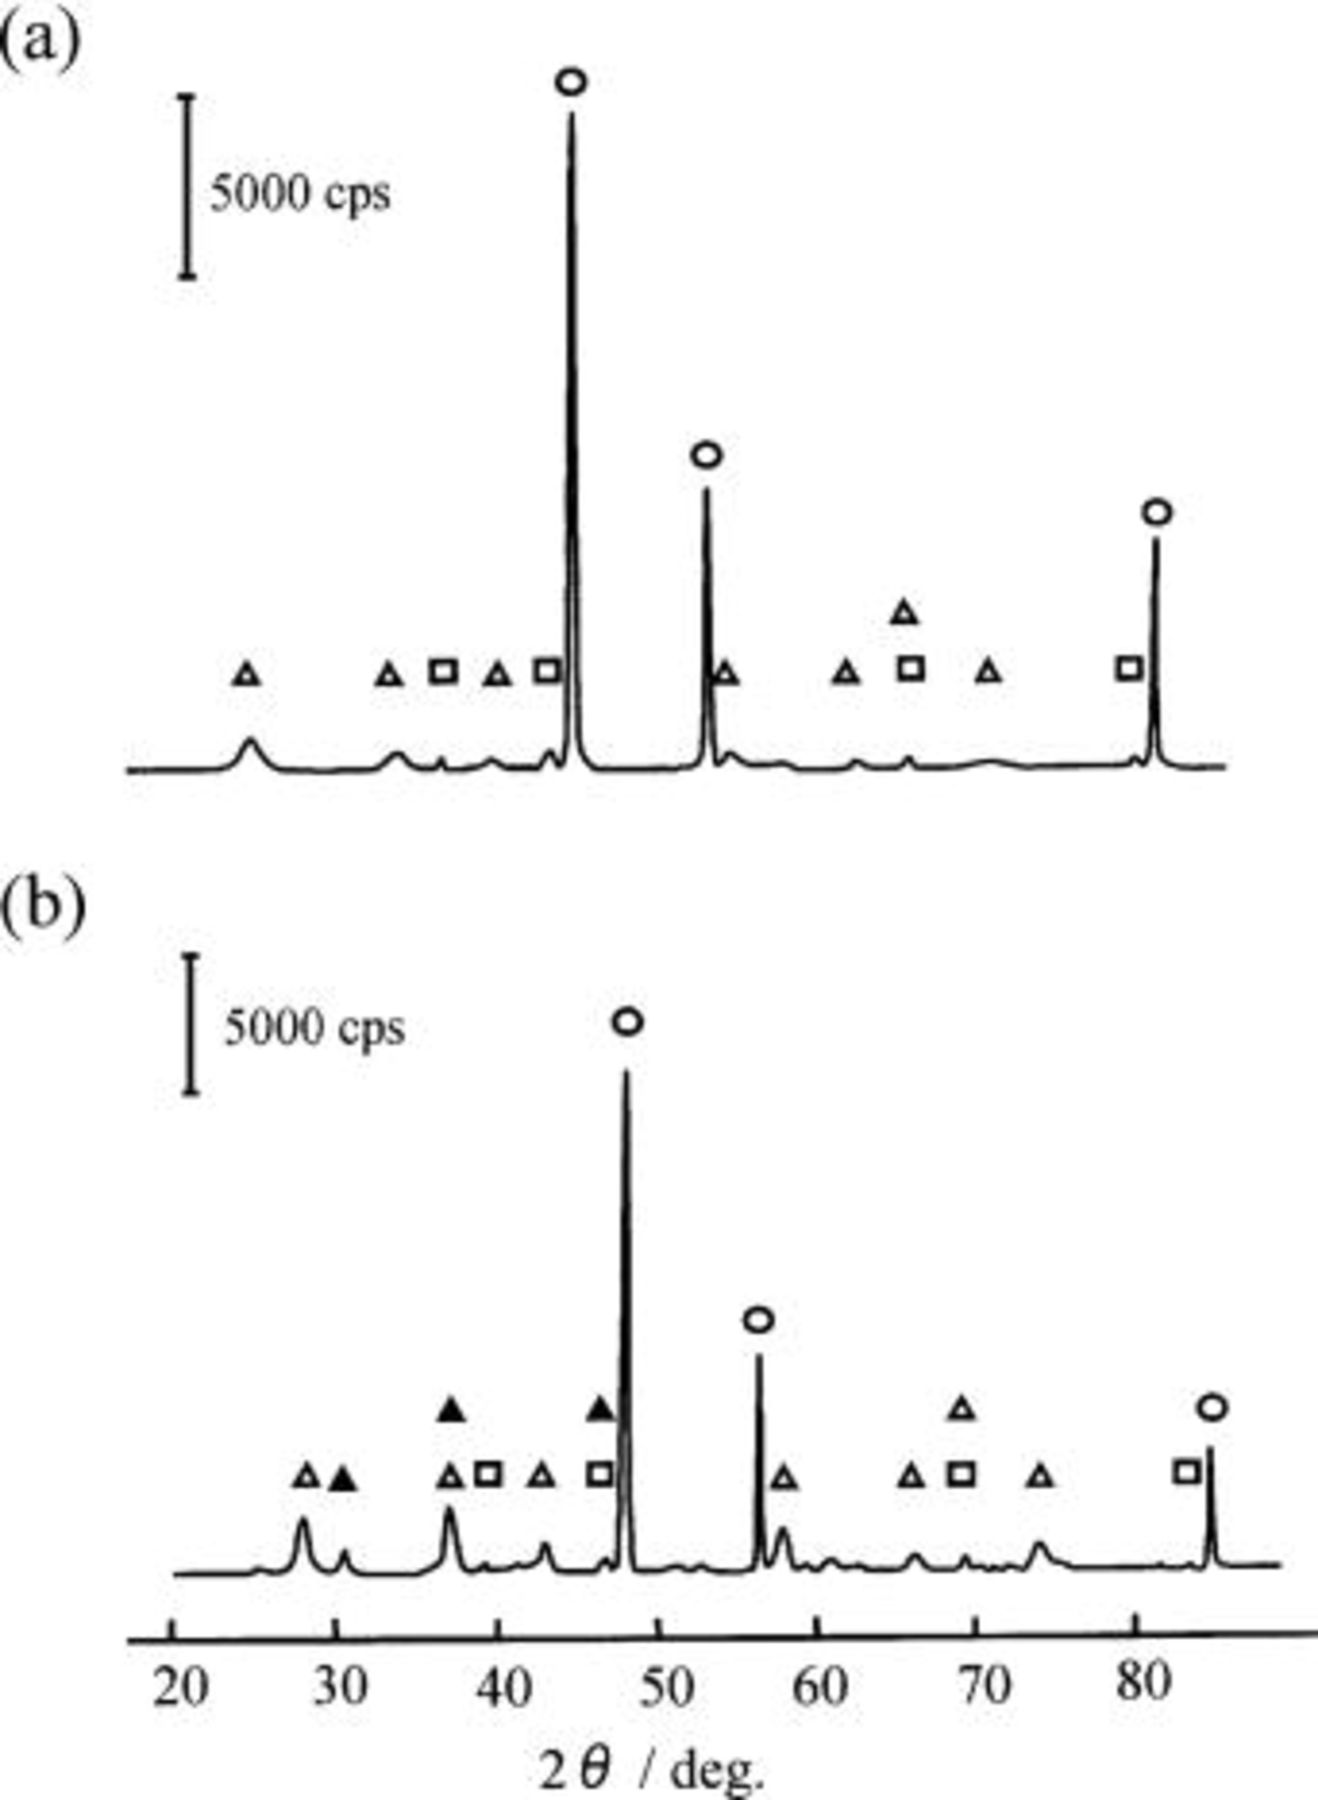
Figure 12. XRD patterns of the Ni-NiO composite anodes electrolyzed at 25 mA/cm2 for 120 h in a molten  with and without LiF at 100°C. (a) Ni-10 mol % NiO composite anode after electrolysis in a molten
  and (b) Ni-10 mol % NiO composite anode after electrolysis in a molten
  with 0.9 mol % LiF. (○) Ni, (□) NiO, (▵)
  (▴)
(▴) 
In order to elucidate the results given in Table I, the change of the anode potential with the time of electrolysis was investigated and the results obtained on the Ni-NiO composite anodes were shown in Fig. 13. The top figure, labeled a, is the anode potential of the Ni sheet (specimen A-1), and the middle figure, labeled b, is of the Ni-10 mol % NiO composite anode (specimen E). Also, the bottom figure, labeled c, is of the Ni-10 mol % NiO composite anode (specimen E) polarized in molten  containing 0.9 mol % LiF. The anode potential of the Ni sheet anode (specimen A-1) rose up from the static potential at ca. 0.2 to ca. 6.2 V after a few minutes of switching, decayed gradually through two maxima and two minima and tended to a steady state with potential fluctuation between ca. 5.2 and 5.6 V. This behavior is elucidated in the previous papers.13
14 The chronopotentiograms of the HIP Ni (specimen A) and the Ni-10 mol %
containing 0.9 mol % LiF. The anode potential of the Ni sheet anode (specimen A-1) rose up from the static potential at ca. 0.2 to ca. 6.2 V after a few minutes of switching, decayed gradually through two maxima and two minima and tended to a steady state with potential fluctuation between ca. 5.2 and 5.6 V. This behavior is elucidated in the previous papers.13
14 The chronopotentiograms of the HIP Ni (specimen A) and the Ni-10 mol %  composite anodes (specimen B) were similar to that of the Ni sheet anode (specimen A-1). On the other hand, the anode potential of the Ni-10 mol % NiO composite (specimen E) jumped at first from ca. 0.2 to ca. 3.2 V after a few minutes of switching and stagnated at ca. 3 V through two maxima and two minima for about 1 h. The direct discharge of water and ammonium ion
  in the melt took place at this potential. At 1 h after switch-on, it jumped again to 5 V and reached also at steady state with (Fig. 13b) and without potential fluctuation between 4.6 and 5.2 V (Fig. 13c). The potential at steady state on the composite anode was low compared with that on a bare Ni sheet anode. This fact indicates that the electrical resistance of the surface layer on specimen E is small compared with that on a Ni sheet anode (specimen A-1). The electrochemical fluorination of
  took place at 5 V. The behaviors of the anode potential with the Ni-NiO composite (specimens D-1 and D) and the Ni-20 mol %
  composite anode (specimen C) were almost similar to that of the Ni-10 mol % NiO composite anode (specimen E), and the stagnation time at ca. 3 V increased with increasing concentration of nickel oxide such as NiO and
  as shown in Fig. 14.
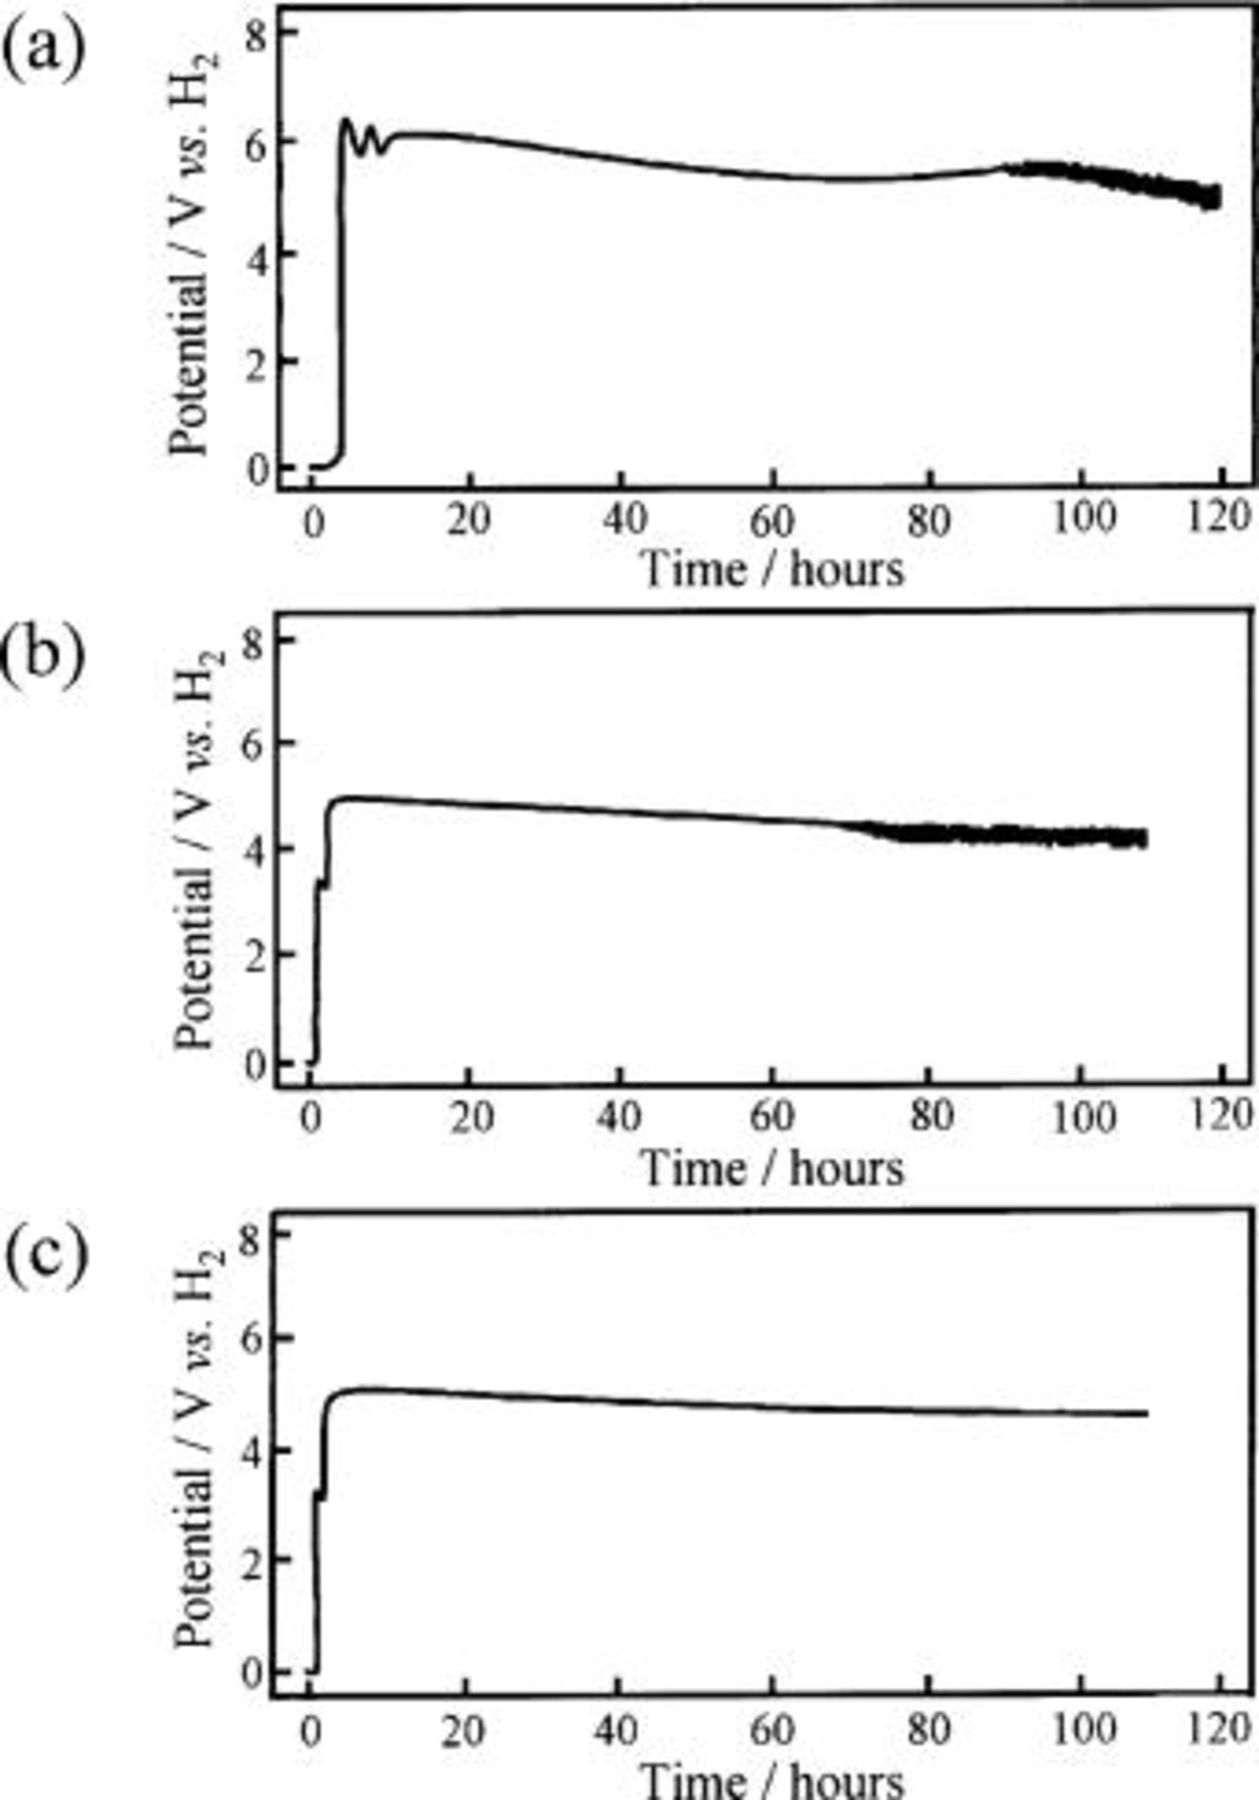
Figure 13. Chronopotentiograms of the Ni sheet and the Ni-10 mol % NiO composite anodes during electrolysis at 25 mA/cm2 in a molten  with and without LiF at 100°C. (a) Ni sheet anode electrolyzed in molten
  (b) Ni-10 mol % NiO composite anode in a molten
  and (c) Ni-10 mol % NiO composite anode in a molten
  with 0.9 mol % LiF.
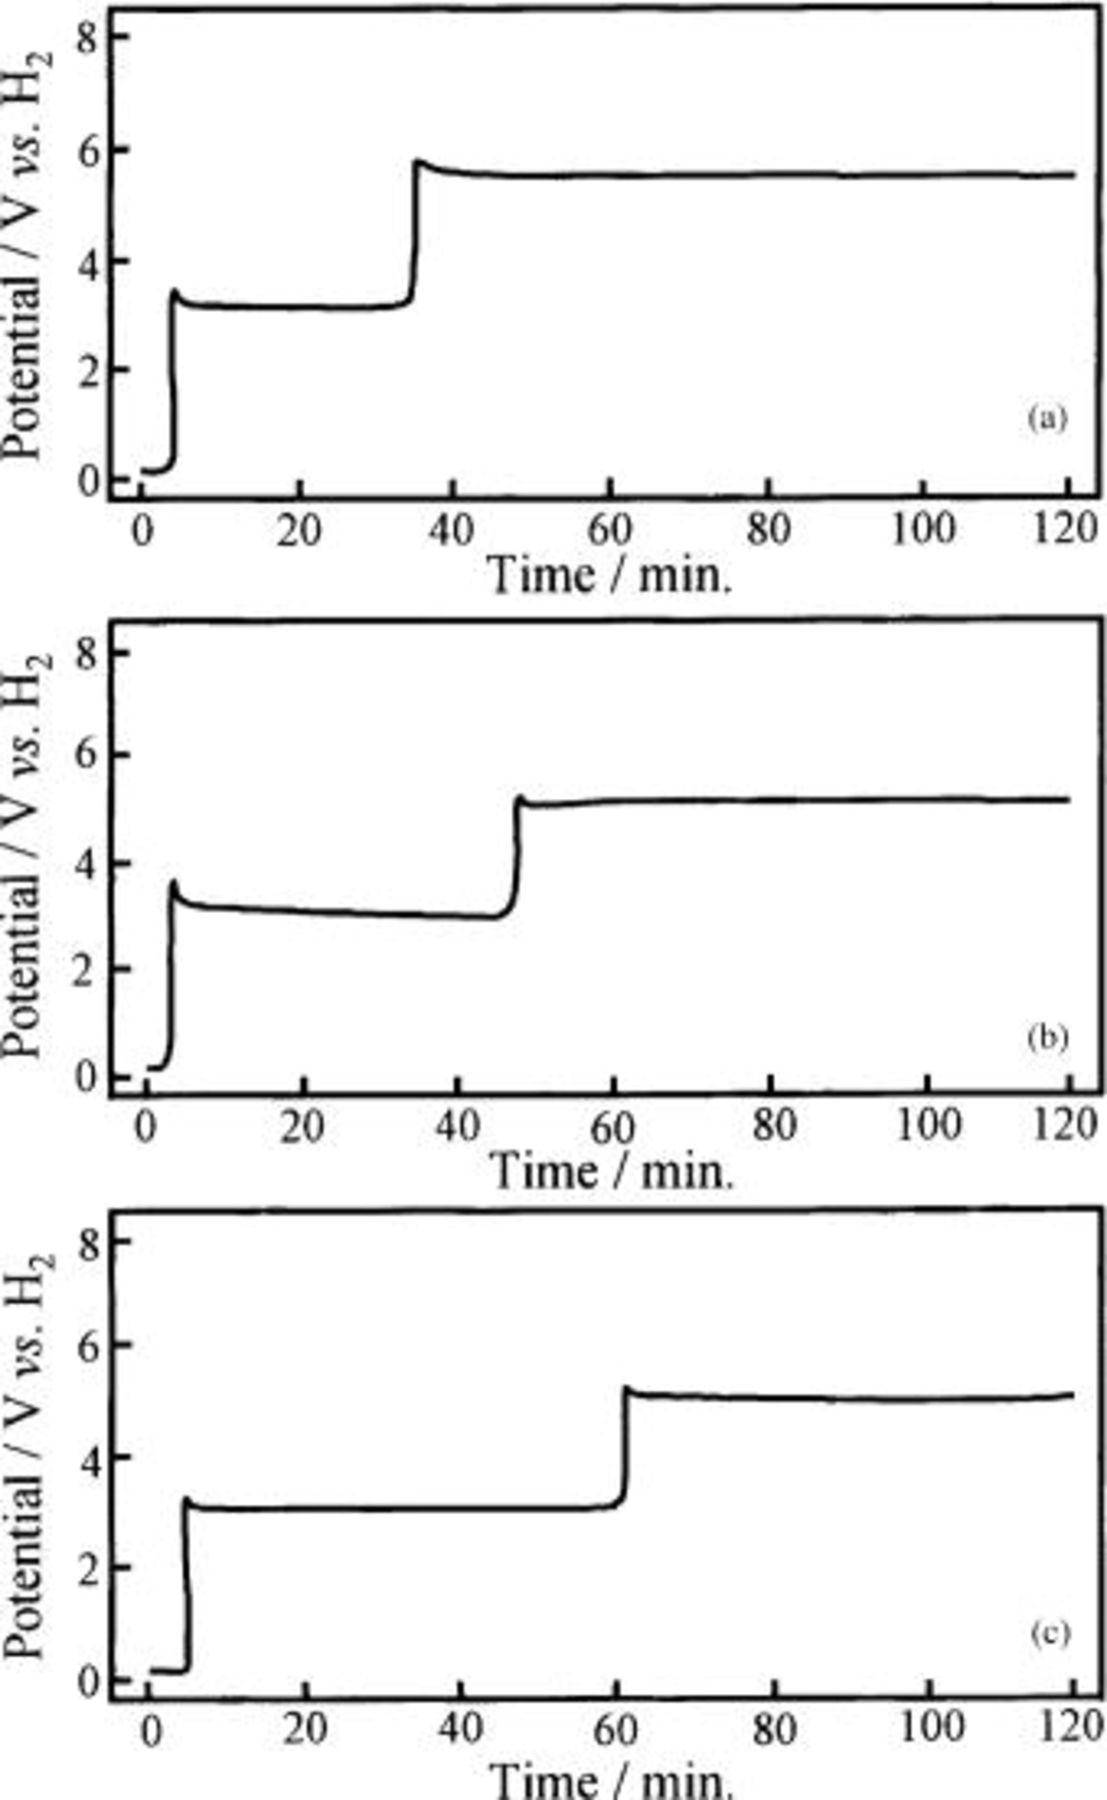
Figure 14. Effect of the NiO content in the Ni-NiO composite anode on the stagnation time at ca. 3 V observed on chronopotentiograms of the composite anodes during electrolysis at 25 mA/cm2 in a molten  at 100°C. (a) Ni-2 mol % NiO composite anode (specimen D-1), (b) Ni-5 mol % NiO composite anode (specimen D), and (c) Ni-10 mol % NiO composite anode (specimen E).
A fresh Ni anode is dissolved during stagnation of the potential at 0.2 V as shown in Fig. 13 and 14 and is then covered with an oxidized layer mainly composed of  resulting in passivity. Even so, the Ni anode is dissolved to some extent to keep passivity by formation of the film composed mainly of
  according to Reactions 1 and 5, and/or 6


On the other hand, a part of the Ni on the composite anode is also dissolved according to the same reactions and the surface of the composite anode is partially covered with  In this case, direct discharge of water and ammonium ion can take place on part of the nickel oxide such as NiO and
  to form
 and
and  according to Reactions 7 to 9 as shown in Fig. 10


The oxidized layer and nickel oxides such as NiO and  on the composite anode are dissolved and/or fluorinated by Reactions 10 to 13


After part of the nickel oxide on the surface of the composite anode is also covered with an oxidized layer composed mainly of  fluoride ions can discharge and hence the electrochemical fluorination of
  takes place on it.
Conclusion
The nickel-nickel oxide (Ni-NiO and  composites were prepared from a mixture of Ni and NiO or
  powders at 900°C under 2000 atm for 2 h by HIP, and were employed as the anode for electrolytic production of
  Since the density of HIP Ni was almost the same as that of the commercial Ni sheet, the material prepared by HIP was dense and had a low porosity. The surface and the cross section of the HIP Ni and the Ni-NiO and the
  composite specimens after electrolysis at 25 mA/cm2 or polarization at 5 V in a molten
  at 100°C were observed by means of scanning electron microscopy. The anode gas generated at the composite anodes was composed of


 and
and  and its composition was the same as that on the bare Ni sheet and on the HIP Ni anodes. The current efficiency for
  formation on the composite anodes was almost the same as, or somewhat smaller than, those on the Ni sheet and the HIP Ni anodes. In electrolysis with the composite anode, the best current efficiency for
  formation was ca. 53% on the Ni-5 mol % NiO composite anode. The addition of LiF to the
  melt increased it, presumably because of deposition of
  on the anode. On the other hand, the anode consumption of the Ni-NiO composite anode was much smaller compared with those of the Ni sheet and the HIP Ni anodes.
From these results, it is concluded that the Ni-NiO composite anode is favorable for keeping a high current efficiency for  formation and preventing the anode from corroding.
Acknowledgment
The authors wish to express many thanks to Morita Chemical Industries Co. Ltd., for supplying chemicals.
This work was supported by the Aid of Doshisha University's Research Promotion Fund in 1996 and a grant to Research Center for Advanced Science and Technology at Doshisha University from the Ministry of Education, Japan.
Doshisha University assisted in meeting the publication costs of this article.