
Abstract
This paper reports on the investigation of rate capability and cycle characteristics of a lithium sulfur battery. The second discharge region where solid  is formed on the surface of the carbon matrix in the cathode was highly sensitive to cathode thickness and discharge rate. The scanning electron microscope (SEM) observation suggests that thick
  layer formed at the surface of the cathode causes the diminution of the second discharge region at high discharge rate. Upon repeated cycle, the delocalization of the surface
  layer happened, however, the irreversible
  gradually increased with cycle as evidence by (SEM) and wave dispersive spectroscopy measurements, causing capacity fade. The formation of the irreversible
  was more significant for higher rates of discharge. It is believed that the destruction of the carbon matrix by stress generated during the localized deposition of
  is responsible for the formation of irreversible
  © 2003 The Electrochemical Society. All rights reserved.
Export citation and abstract BibTeX RIS
The successful development of a lithium sulfur battery which has been regarded as one of the candidates for next generation battery requires extensive research on the electrochemical behaviors under various operation conditions.1
2
3
4
5
6
7 We demonstrated previously that the  is formed on the carbon matrix in the cathode. In addition, little
  remained uncharged on carbon matrix of the cathode even at 100% depth of charge.8
In this paper, the performance changes of the lithium/sulfur (Li/S) battery and the morphological changes of the sulfur cathode with discharge rate, cathode thickness, and cycles are reported. From the practical point of view, information on the behaviors of the Li/S battery with the changes of these factors are highly important in design and further improvement of the Li/S battery. The changes in the morphology of the cathode with discharge rate and cycle number were detected by means of scanning electron microscopy (SEM) and wave dispersive spectroscopy (WDS) measurements. Based on the SEM and WDS analysis, we tried to find a structural factor of the sulfur cathode that affects the rate capability and cycle characteristics of the Li/S batteries.
Experimental
The sulfur (purity: 99.8%, Aldrich) was ground by ball-mixing method to reduce the particle size to 3-8 μm before use. The sulfur cathode was prepared by doctor blade-coating of the slurry of sulfur (purity: 99.98%, Aldrich) and super-P (MMM carbon), a conducting agent, on one side of aluminum current collector. The resulting cathode consists of 56.7 wt % of sulfur, 27.3 wt % of super-P, and 16 wt % of poly(butadiene-co-styrene) based binder. The thickness of the cathode layer measured with a thickness gauge (Mitutoyo digimatic indicator 407-320) was varied as 15, 30, and 60 μm. The capacity and density of the resulting cathodes are summarized in Table I. The Li metal foil (Teckraf) with thickness of 240 μm was used as an anode. The lithium sulfur (Li/S) cells were fabricated by winding the cathode  Li metal anode
  and separator (Celgard 3501, Hoest Celanses). The solution of 0.5 M
  in tetra(ethylene glycol) dimethylether (TEGDME) was used as an electrolyte. The salt was dried under vacuum at 140°C for 24 h before use. The water content of the electrolyte was 35 ppm measured by Karl Fisher titration (AF7, Orion). The assembled cell was sealed with an appropriate amount of the electrolyte in an aluminum coated plastic pack under vacuum.
Table I.
| List of thickness, capacity, and density of the cathodes used in this work. | ||
|---|---|---|
| Thickness(μm) | Theoretical capacity
 | Density
 |
| 15 | 1.09 | 0.72 |
| 30 | 2.48 | 0.75 |
| 60 | 5.21 | 0.77 |
The discharging and charging behaviors of the Li/S cells were examined with a Maccor battery cycler at room temperature. The morphology of the sulfur cathode was investigated by using SEM (2400s, Hitachi). The specimen for SEM measurement were prepared by breaking the cathode after storing them in liquid nitrogen for 10 min. The semiquantitative measurement of the content of the solid-state sulfur compounds in the cathode was made by using WDS (600 WDX, Microspec).
Results and Discussion
Rate capability of the Li/S battery.—
Figure 1a shows the first discharge curve at varying current density for the 15 μm thick electrode. This cell showed 80% sulfur utilization at  With the increase of current density, it revealed the decrease of the sulfur utilization together with the increase of overpotential. The thickness increase of the cathode resulted in decreased sulfur utilization irrespective of current density (Fig. 1b and 1c). More pronounced decrease of sulfur utilization with current density was found for a thicker cathode.
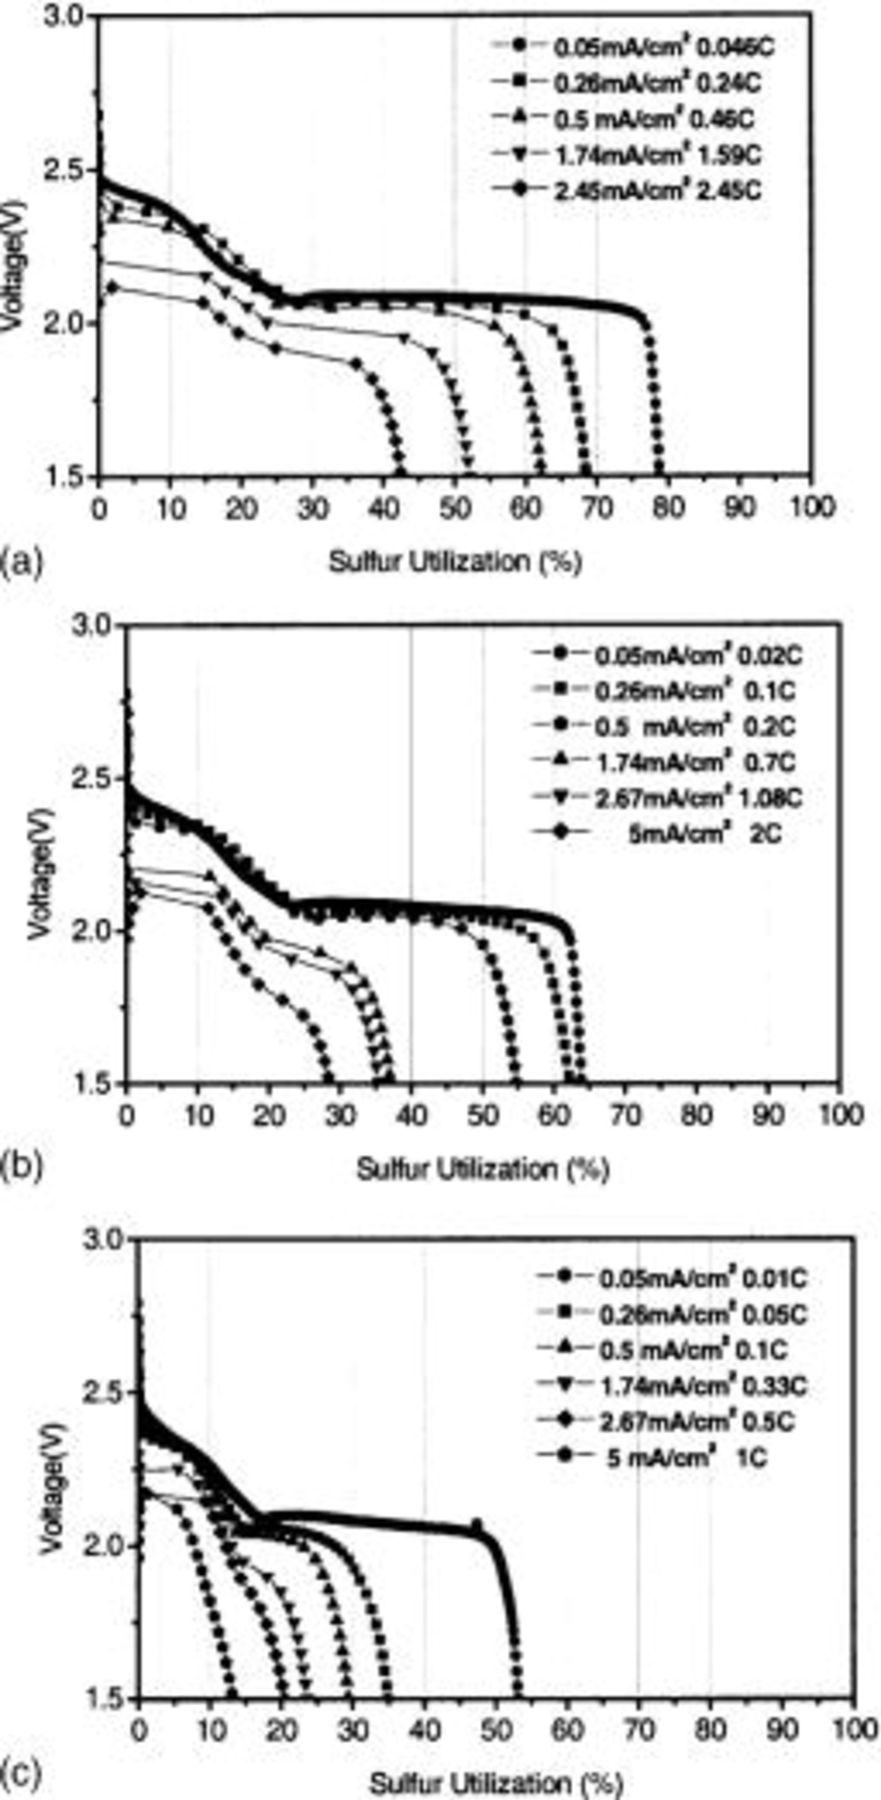
Figure 1. First discharge profiles for Li/S cells with three cathodes with varying thickness as a function of current density. Cathode thickness: (a) 15 μ, (b) 30 μ, and (c) 60 μ.
In explanation of this behavior, we may recall that, during the discharge process of the Li/S cell, an  layer is formed at the carbon matrix in the cathode as previously shown in Part I of this series of papers.8 In order to check the dependence of the
  layer formation on discharge rate, we traced the change of the cathode morphology with discharge rate by means of SEM. We observed the cross section and surface of the sulfur cathode before and after discharge to 1.5 V at various discharge rates. The remaining soluble polysulfide was washed three times with TEGDME before the SEM measurements. Figure 2a shows the SEM image of the cross section of the sulfur cathode (30 μm thick) before discharge. Sulfur (5 μm) and carbon particles were well dispersed over a whole a cathode on the Al foil current collector. The sulfur particle converts to lithium polysulfuides that are soluble in the electrolyte during the first discharge plateau at 2.4 V. At the second voltage plateau, solid
  is formed on the surface of the carbon matrix in the cathode. After the discharge to 1.5 V at
  the cathode became quite dense with the homogeneous formation of
  on whole carbon matrices as seen in Fig. 2b. However, at high current densities such as 1.74 and
  the inside of the cathode was found to be porous (see Fig. 2c and d), which indicates that the interior of the cathode layer is hardly utilized for formation of
  The SEM images of the surface of the cathode provide clear understanding of the low sulfur utilization at high discharge rate. As shown in Fig. 3, the
  layer, which blocks ionic transport toward the inside of the cathode, was produced at the surface of the cathode, and it was more profound for high discharge rate.
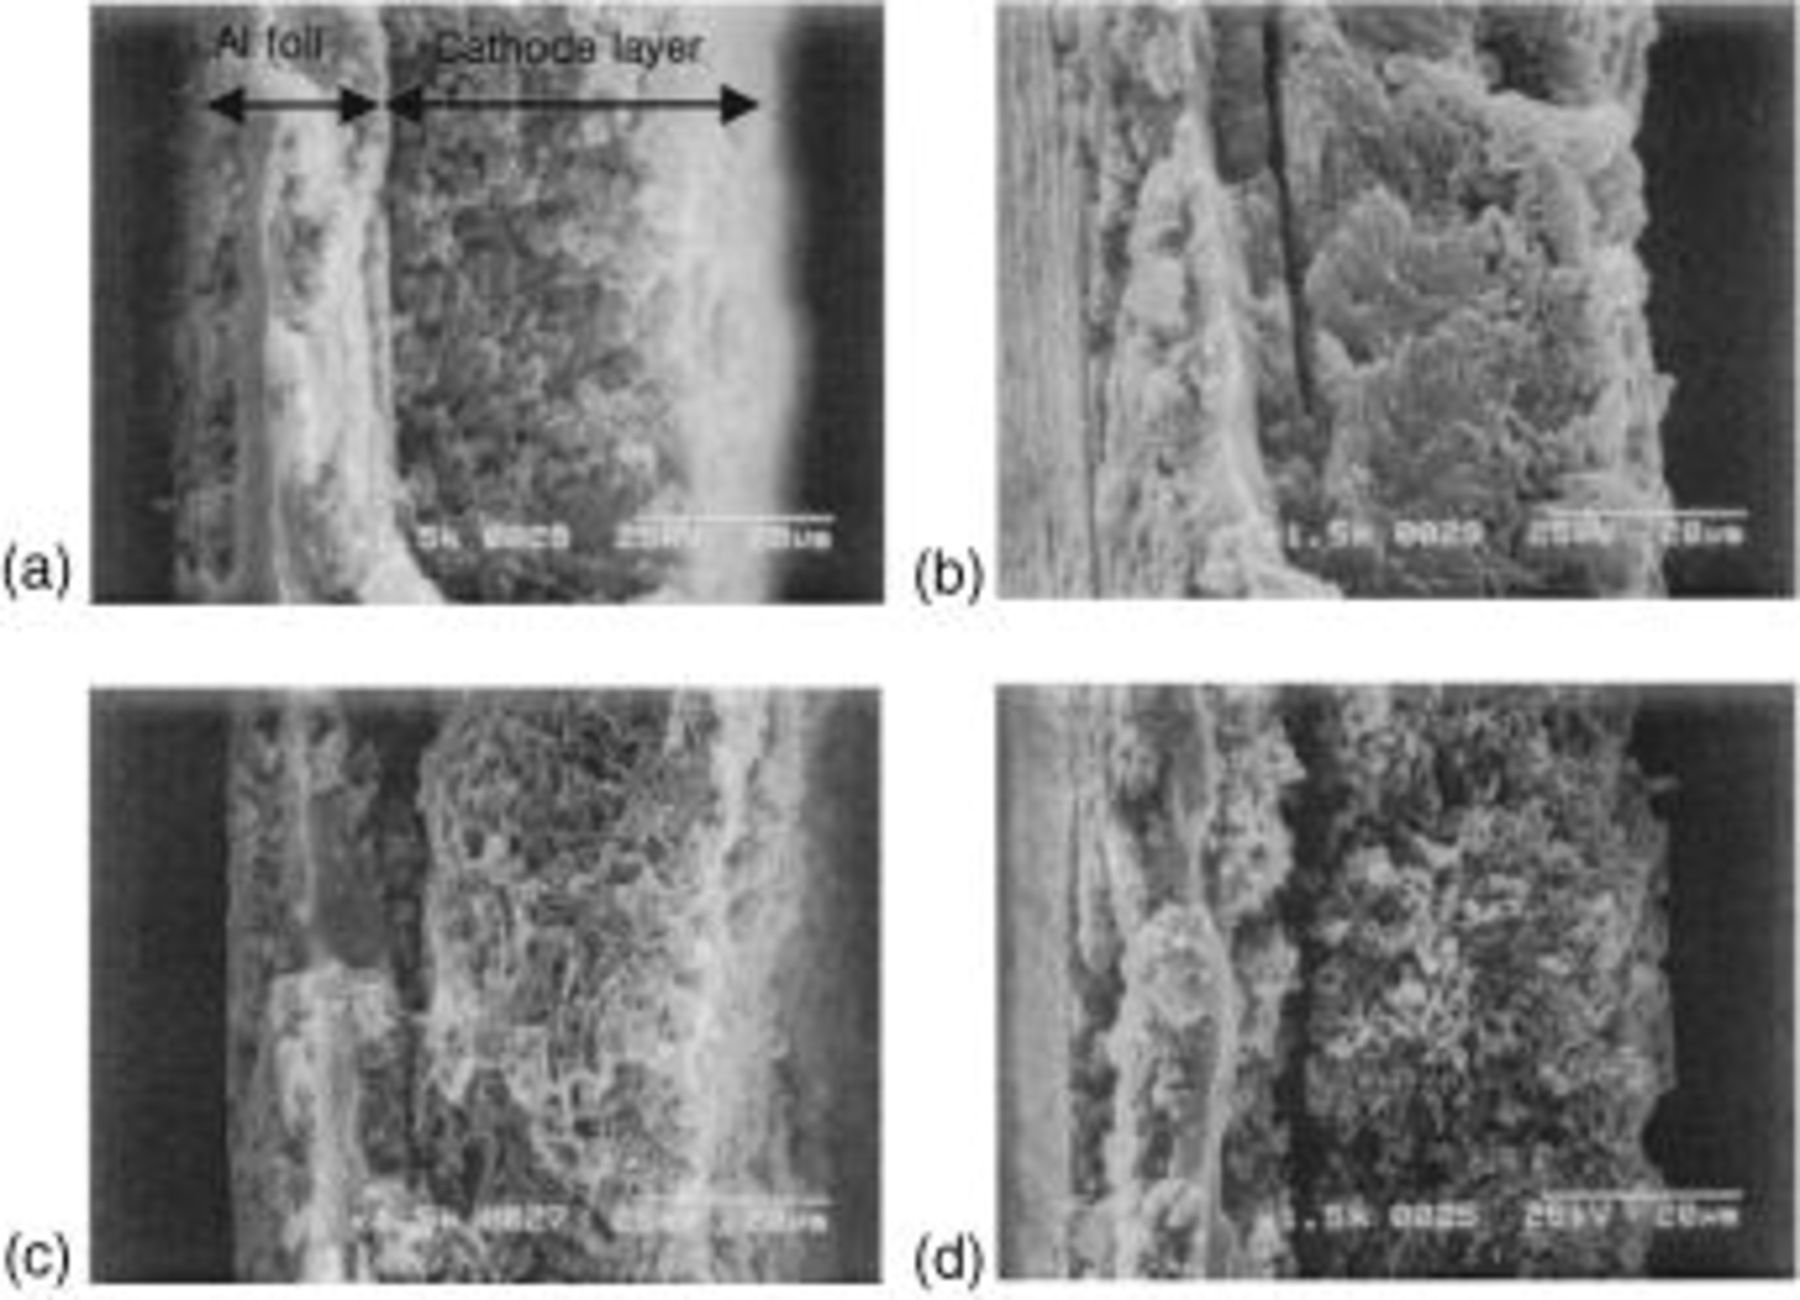
Figure 2. SEM micrographs of the cross section of the sulfur cathodes (a) before discharge, (b) after discharge to 1.5 V at  (c) after discharge to 1.5 V at
  and (d) after discharge to 1.5 V at

Figure 3. SEM micrograph of the surface of the sulfur cathode (a) before discharge, (b) after discharge to 1.5 V at  (c) after discharge to 1.5 V at
  and (d) after discharge to 1.5 V at
The dependence of the sulfur utilization on discharge rate was plotted in Fig. 4. The C rate corresponds to [discharge current]/[theoretical capacity]. We divided the total sulfur utilization into the contributions from the first discharge region (upper 2.1 V plateau) and from the second discharge region (2.1 V plateau) in order to investigate the dependence of each reduction process on discharge rate. Fig. 4a revealed that sulfur utilization decreased with the increase of the discharge rate, and the decreasing rate was higher for the thicker cathode. The comparison of the contributions from the first and the second discharge region shows that the second discharge region is more sensitive to discharge rate than the first discharge region (see Fig. 4b and c). For the cathode with 15 μm thickness, the contribution from the second discharge region for cathode decreased from 50 to 20% with the increase of the discharge rate from 0.05 to 2.5C, whereas, the contribution from the first discharge region remained unchanged with the change of the discharge rate.

Figure 4. Dependency of sulfur utilization on discharge rate for: (a) overall discharge region, (b) first discharge region, and (c) second discharge region.
The relatively high sensitivity of the second discharge region to discharge rate can be reasoned by the characteristics of the reduction process in this regime. Since the reduction products are soluble in the electrolyte in the first discharge region, the diffusion rate of polysulfide and lithium ion in electrolyte medium toward the carbon surface mainly determines the reduction rate in this regime. However, at the second discharge region, the morphology of the  layer additionally affects the reduction rate as well as the diffusion in the electrolyte phase of the cathode. It should be mentioned here that the surface passivation by
  is attributed to a low diffusion rate of the soluble polysulfide and lithium ion in the cathode. The formation of the soluble polysulfide increases the viscosity of the electrolyte medium in the cathode, resulting in the low lithium-ion diffusion toward the interior of the cathode and the low soluble polysulfide diffusion toward the exterior of the cathode.9 As a consequence, the reduction of soluble polysulfides is concentrated on the surface of the cathode, forming a thick
  surface layer. As the cathode thickness and the discharge rate increase, the diffusional resistance is increased and
  formation is more concentrated at the surface of the cathode. It explains the sensitivity of sulfur utilization to cathode thickness and discharge rate.
Cycle characteristics of the Li/S battery.—
Figure 5 shows the evolution of discharge profile of the Li/S battery based on 30 μm cathode with cycle. The current density for discharge was  for Fig. 5a and
  for Fig. 5b. The current density for charge was
  for both cases. The comparison of Fig. 5a and b shows that the decrease of the second discharge region was more severe at a higher rate of discharge. The first discharge region became shorter with cycling, however, it is barely dependent on the discharge rate. The decrease of the second discharge region with cycle is accompanied with the shortening of the charging plateau at 2.28 V for both discharge rates. It is reasonable because the charging plateau at 2.28 V corresponds to the conversion of
  which has been formed at 2.1 V during the previous discharge stage, to soluble polysulfides.8 Figure 6 compares the cycle life of the Li/S cells at different discharge rates. The capacity fade rate was faster for
  At the fiftieth cycle, the cell cycled with the discharge rate of
  revealed only 18% sulfur utilization. However, the cell cycled at the discharge rate of
  delivered 30% sulfur utilization at the 50th cycle.

Figure 5. Evolution of charge and discharge profiles of Li/S cells with cycling at varying discharge rate at room temperature. (a) Discharging rate:  charging rate:
  and (b) discharging rate:
  charging rate:
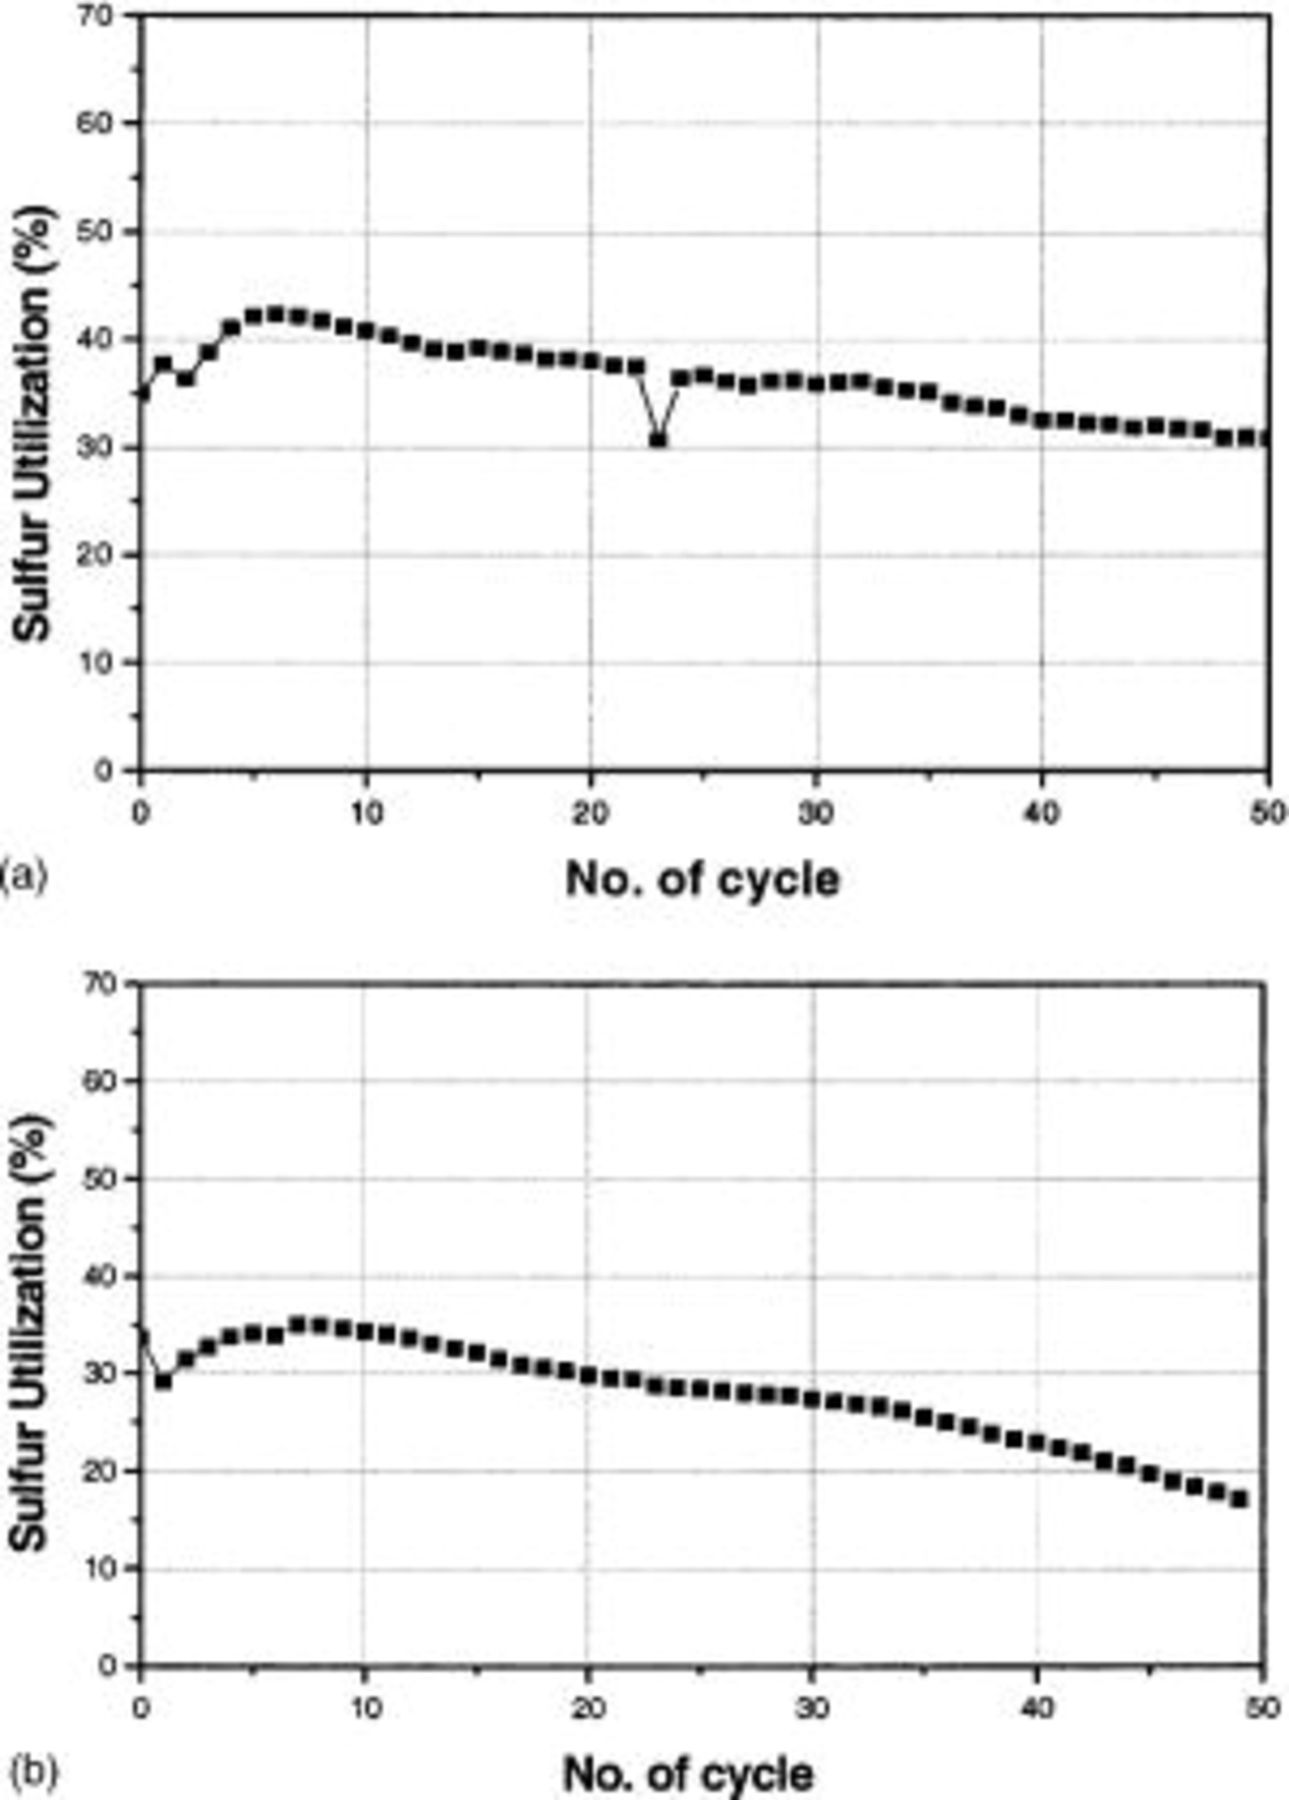
Figure 6. Cycle performance of Li/S cell at discharge rate of (a)  and (b)
With an aim to investigate the structural change of the sulfur cathode during the repeated cycle, SEM images of the sulfur cathode were observed as a function of cycle number. The remaining soluble polysulfide was completely washed with TEGDME before the SEM measurements. Figure 7 reveals the SEM images of the fully discharged cathode at various cycles. These cathodes were discharged at the current density of  After the first discharge, the
  layer was locally formed at the surface of the cathode. However, redistribution of the
  layer happened after the prolonged cycles such as the twentieth and fiftieth. The redistribution of the
  can be well explained with considering the redox mechanism of Li/S battery. The formation of thick
  during the first discharge is caused by the high soluble polysulfide concentration in the cathode layer as discussed above. On the other hand, the thick
  layer is removed from the surface of the carbon matrix by forming soluble polysulfides during the subsequent charging, and the formed soluble polysulfide is well distributed both in the cathode layer and in the electrolyte layer via diffusion. Due to the delocalization of the soluble polysulfide during charging, the viscosity of the electrolyte phase in the cathode layer becomes low, which imparts rather homogeneous
  formation. During the repeated cycles, the abovementioned process is repeated, resulting in the further delocalization of
  formation. In addition, it is believed that the increased wetting of the carbon matrix with the electrolyte during the repeated cycles enhances the amount of carbon surface available for
  formation, leading to the delocalization of the
  formation.

Figure 7. SEM images of the surface of the cathode after discharge (discharge rate:  charge rate:
  at (a) first cycle, (b) twentieth cycle, and (c) fiftieth cycle.
As demonstrated in Part I of this series of papers, a certain part of  formed during discharge, denoted as irreversible
  remains uncharged at the carbon matrix even at 100% depth of charge. At prolonged cycles, the fully charged cathode still contains the irreversible
  as shown in the SEM images of the fully charged cathode at various cycles (Fig. 8). The content of
  in the cathode after charge and discharge, determined from WDS, was plotted as a function of cycle number in Fig. 9. The content of
  at discharged state was decreased with cycle. On the other hand, the content of the irreversible
  at charged state was increased with cycle number. It indicates that the irreversible
  which does not participate in oxidization during charging, is continuously accumulated in the carbon matrix. At fifty cycles, the excess of Li anode was still remained in the cells, therefore, the decrease in discharge capacity does not come from the depletion of the Li anode.
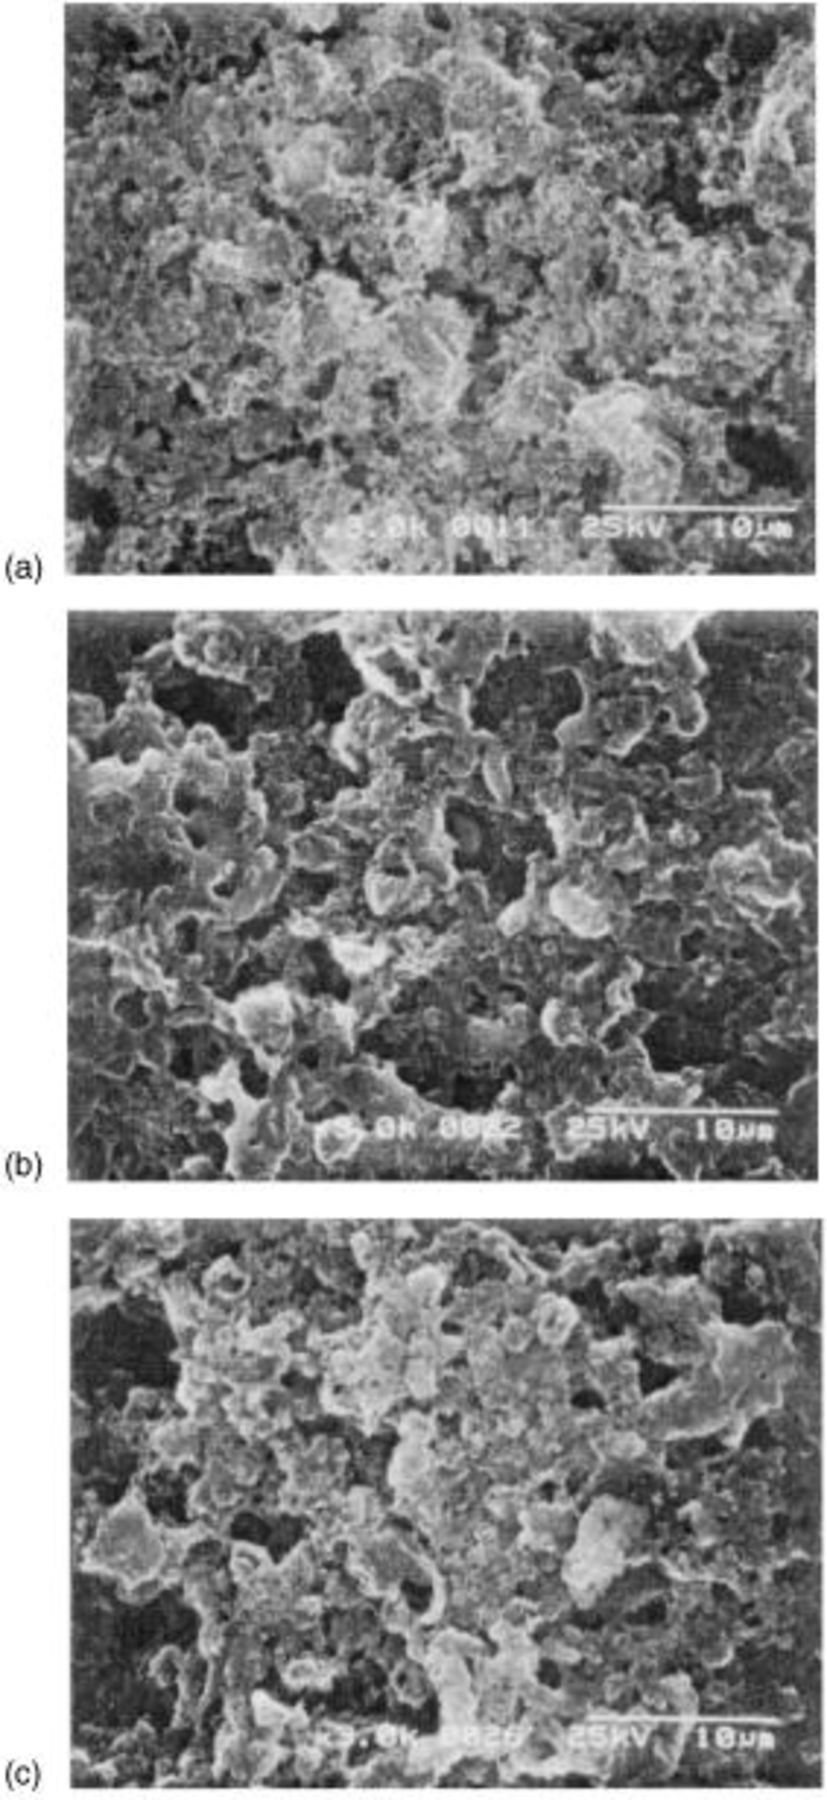
Figure 8. SEM micrograph of the surface of sulfur cathode after charge (dicharge rate:  charge rate:
  at (a) first cycle, (b) twentieth cycle, and (c) fiftieth cycle.
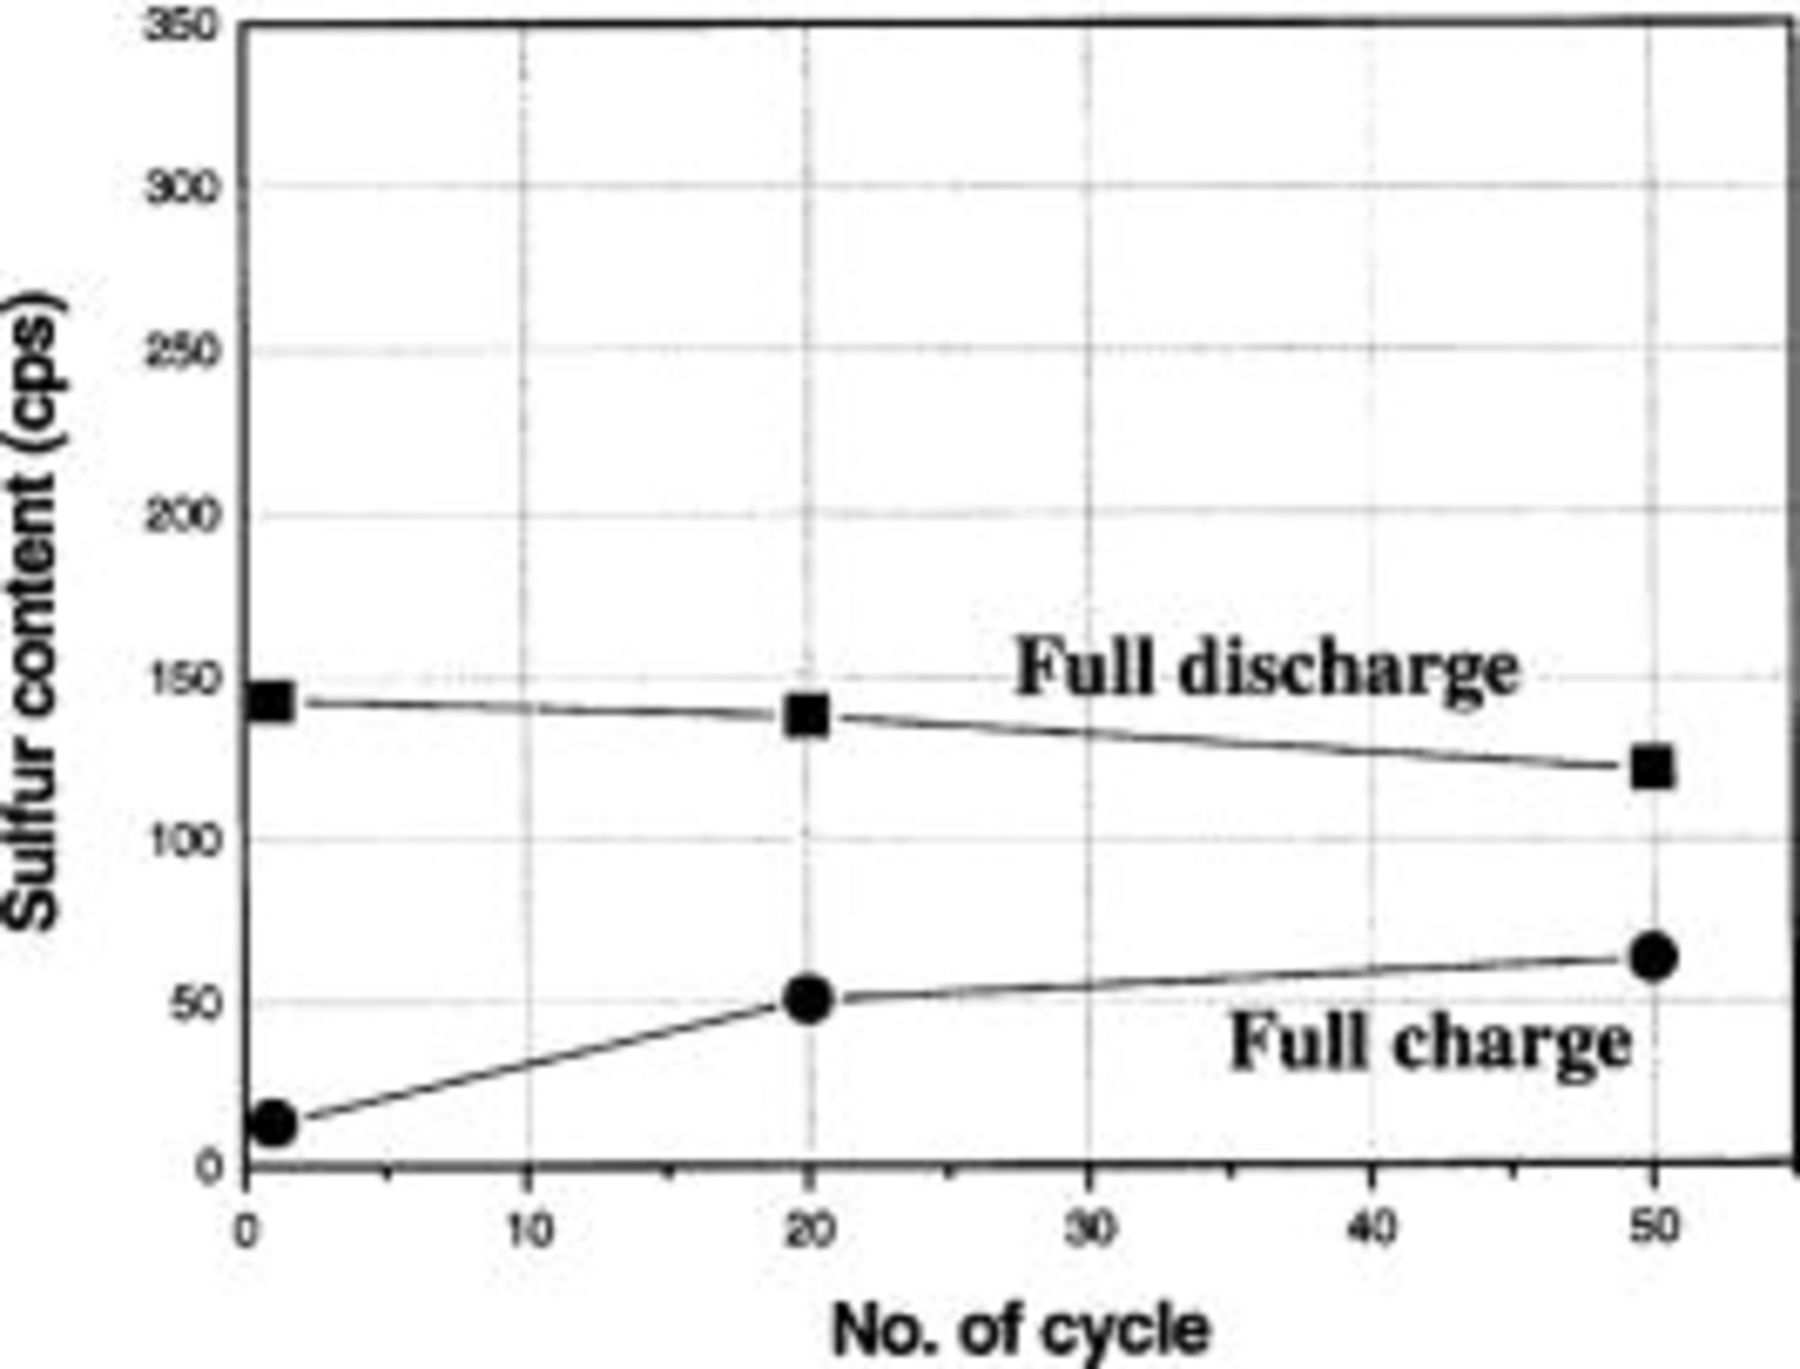
Figure 9. Relative solid sulfur compound after discharge at various cycles (discharge rate:  charge rate:
  .
.
The SEM and WDS measurements were also made for the discharge current density of  In the SEM image of the discharged cathode at
  thick
thick  layers were observed at the first, twentieth, and fiftieth cycles (see Fig. 10). Similarly to the discharge at
  the redistribution of the
  layer happened during the cycle at
  The SEM images of the charged cathode for the discharge current density of
  revealed that a significant amount of the irreversible
  remained in the cathode surface (see Fig. 11). In comparison with the discharge at
  the discharge at
  lead to a higher degree of the surface passivation by
  and higher amount of the irreversible
  at prolonged cycles. Figure 12 displays the change of the solid sulfur content in the fully charged and discharge cathode with cycle for discharge density of
  It is interesting that, at 100% depth of charge, the content of the amount of the irreversible
  was comparable to that in discharged cathode. It means that a significant amount of
  was not oxidized during the charge state, and little
  is newly formed at the carbon matrix during discharge.
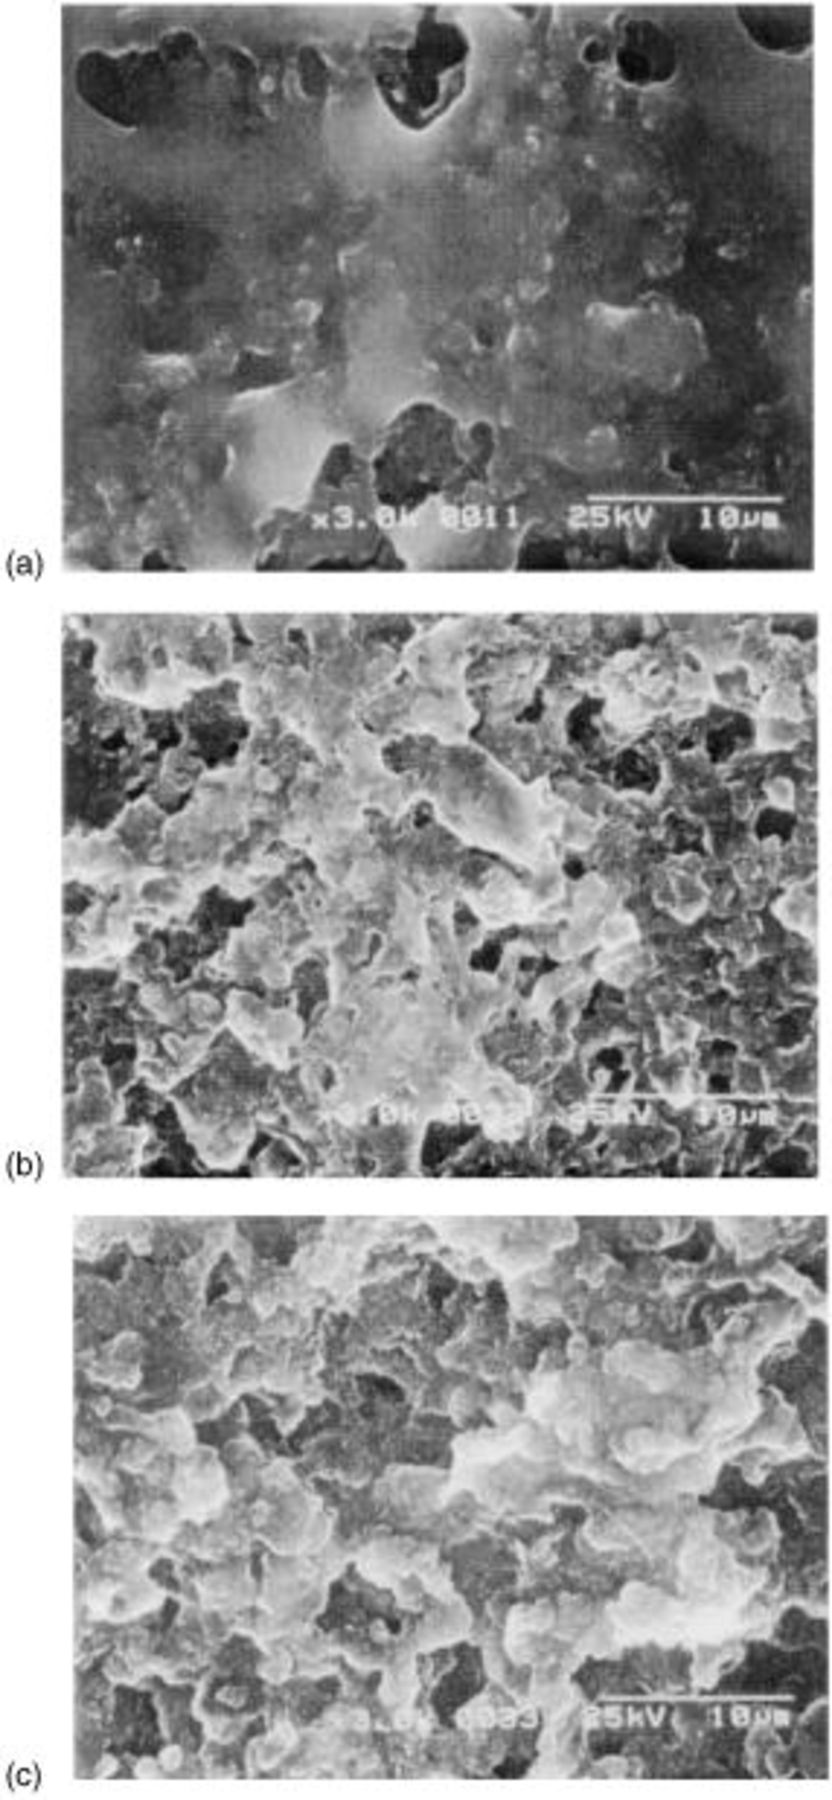
Figure 10. SEM images of the surface of the cathode after discharge (discharge rate:  charge rate:
  at (a) first cycle, (b) twentieth cycle, and (c) fiftieth cycle.
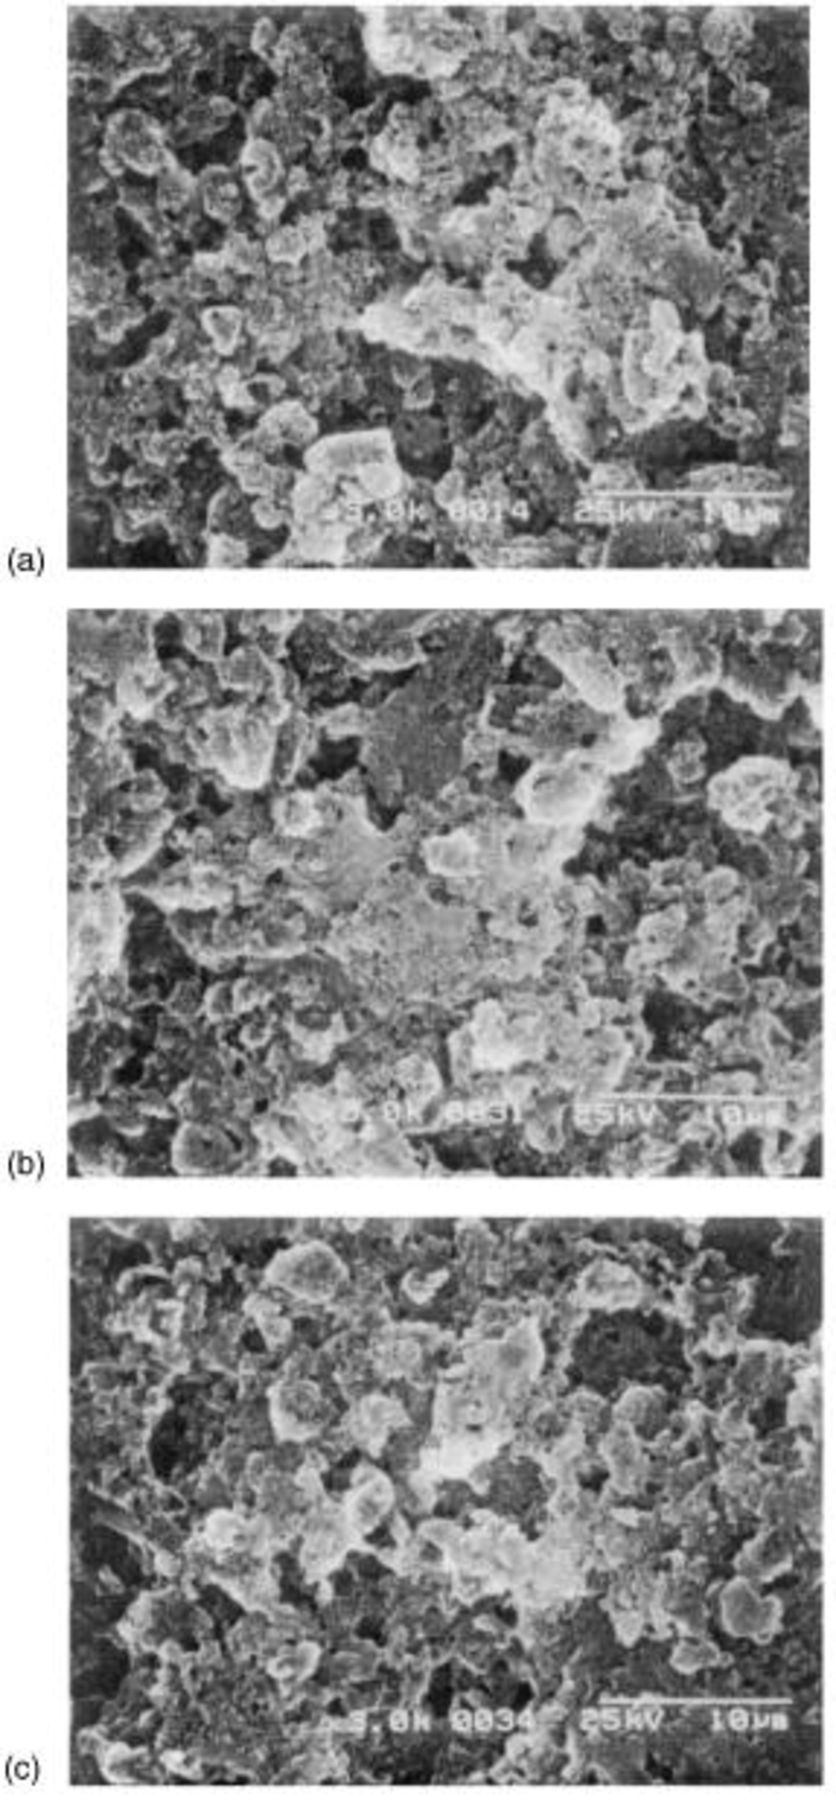
Figure 11. SEM micrograph of the surface of sulfur cathode after charge (dicharge rate:  charge rate:
  at (a) first cycle, (b) twentieth cycle, and (c) fiftieth cycle.
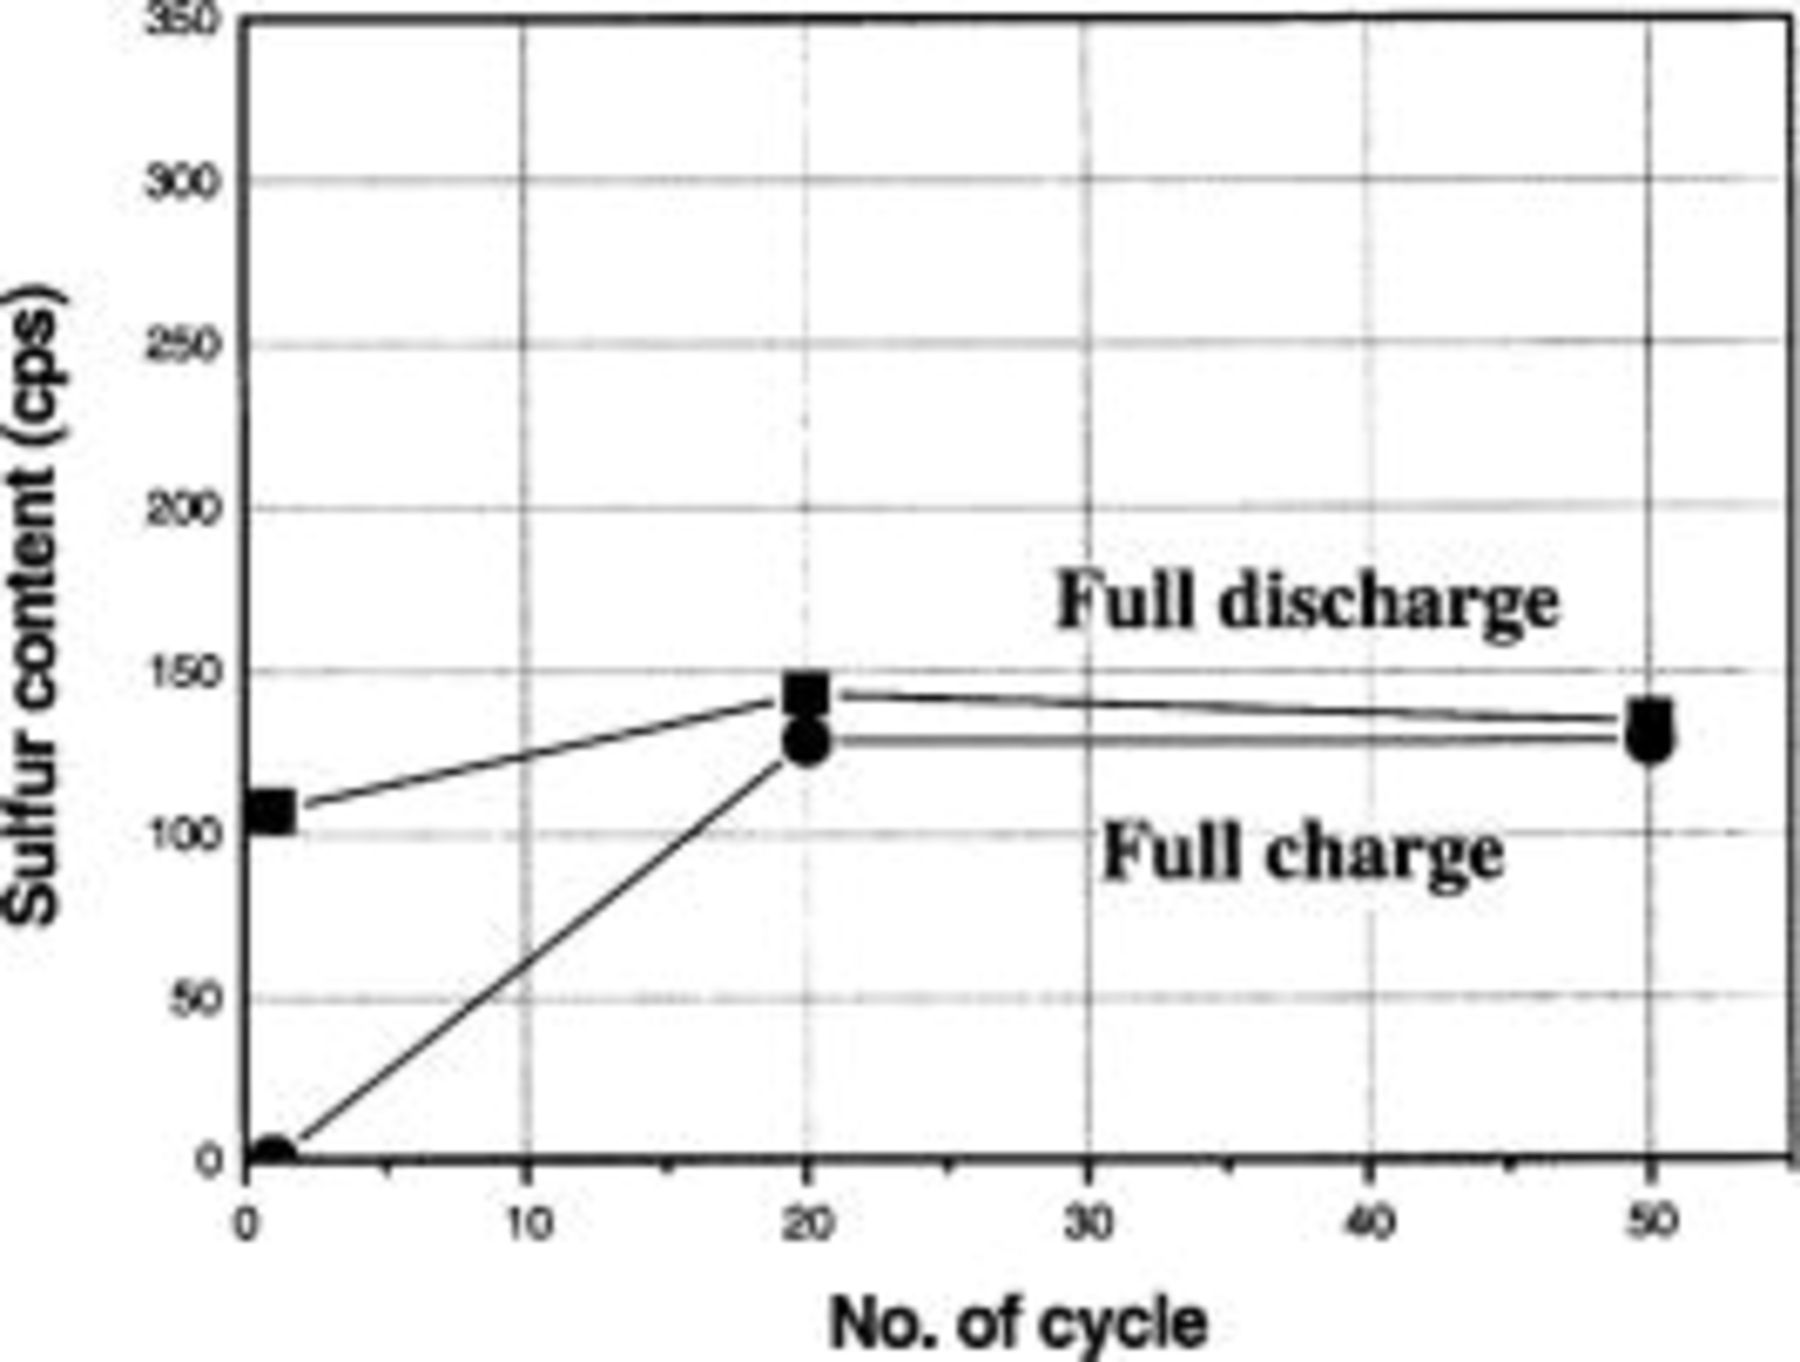
Figure 12. Relative solid sulfur compound after discharge at various cycles (discharge rate:  charge rate:
  .
.
We expect that the formation of the irreversible  be caused by the destruction of the carbon matrix by a stress generated during the deposition of
  on carbon surface. Due to the breakage of the electronic contact, the
  on the isolated carbon does not take part in electrochemical oxidation. At high discharge rate, the destruction of the carbon matrix would be severe because the
  formation is highly localized. The generation of the irreversible
  could be regarded as not only a loss of active material but also a loss of carbon matrix. With increasing the amount of the irreversible
  the available conducting surface for
  formation is decreased. As a consequence, the localization of
  formation becomes more severe with cycle, and the discharge capacity is gradually decreased.
The Ness Company, Limited, assisted in meeting the publication costs of this article.