
Abstract
 -ion is the most commonly used battery chemistry in portable applications nowadays. Accurate state-of-charge (SOC) and remaining run-time indication for portable devices is important for the user's convenience and to prolong the lifetime of batteries. A new SOC indication system, combining the electromotive force (EMF) measurement during equilibrium and current measurement and integration during charge and discharge, has been developed and implemented in a laboratory setup. During discharge, apart from simple Coulomb counting, the effect of the overpotential is also considered. Mathematical models describing the EMF and the overpotential functions for a
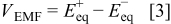
  -ion battery have been developed. These models include a variety of parameters whose values depend on the determination method and experimental conditions. In this paper the battery measurement and modeling efforts are described. The method of implementing the battery model in an SOC indication system is also described. The aim is an SOC determination within 1% inaccuracy or better under all realistic user conditions, including a wide variety of load currents and a wide temperature range. The achieved results show the effectiveness of our novel approach for improving the accuracy of the SOC indication.
Export citation and abstract BibTeX RIS
This paper describes new measurement and modeling solutions to enable accurate state of charge (SOC) indication for  -ion batteries. The SOC is defined as the percentage of the maximum possible charge that is present inside the battery.1 There are several practical methods available for SOC indication. From these, the two best known are the direct-measurement and bookkeeping methods.1–6
The direct-measurement method is based on the measurement of battery variables such as the battery voltage  , the battery impedance
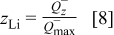
  , and the voltage relaxation time
  after application of a current step. The measured battery variable is then directly translated into an SOC value via, e.g., a function or look-up table.1 A particular method for voltage measurement is represented by the electromotive force (EMF) method that equals the sum of the equilibrium potentials of the electrodes of the battery.1 The EMF of a
  -ion battery is observed to be a good measure for a battery's SOC.1 It has been demonstrated that the EMF-SOC relationship does not change during cycling of the battery, if SOC is expressed in relative capacity.1 As is shown in this paper, the EMF can be directly translated into an SOC value using a predetermined function.
The bookkeeping method is based on measurement and integration of the current flowing into and out of the battery, often referred to as Coulomb counting.1–11 However, the battery does not behave like a linear capacitor. This implies that not all charge supplied to the battery can actually be retrieved under all conditions. Therefore, in addition to these Coulomb counting data, relevant battery behavior needs to be taken into account. For example, in the SOC indication algorithm discussed in this paper the prediction of the overpotential will also be used as input for the bookkeeping system. Due to this overpotential  , the battery voltage
  during (dis)charge is (lower)higher than the EMF (see Fig. 1).1 Especially at low SOC, due to a high overpotential the remaining charge cannot be withdrawn from the battery, because the battery voltage will drop below the end-of-discharge voltage
  defined in the portable device. This is illustrated in Fig. 1, where discharging
  starts at point
  and the battery voltage drops with an overpotential η. As a result, the battery voltage drops below
  after a time
  and the indicated remaining runtime in point
  , i.e.,
  , is zero. Most relations between battery variables and the SOC depend on the temperature
  . Therefore, the battery temperature should also be measured.

Figure 1. Schematic representation of EMF (dashed) and discharge (solid) voltage curves leading to zero remaining run time  at point
  . The horizontal axis shows the remaining run time, where
  represents a maximum remaining run-time,
  an initial discharge run time, and
  the time at which the battery is empty (
 and
and  ).
).
A new SOC indication system that eliminates the main drawbacks and combines the advantages of the direct-measurement and bookkeeping methods has been developed and tested.1–6 The purpose of the system is to inform the user of a portable device of accurate SOC and remaining run-time indications in order to provide maximum utility and to prolong the lifetime of the battery. Modeling methods for the EMF and overpotential functions have been developed. The modeling methods involve a variety of parameters whose values depend on the determination method and experimental conditions. The methods used for performing these experiments are described.
This paper is organized as follows. The next section describes the general operational mechanism of  -ion batteries and the main characteristics. Measurement and modeling methods of the EMF function are presented next. Then, overpotential measurement and modeling methods are presented. The next section focuses on the obtained simulation results. Finally, concluding remarks and future work are presented.
General operational mechanism of batteries
In its simplest definition, a battery is a device capable of converting chemical energy into electrical energy and vice versa. The chemical energy is stored in the electro-active species of the two electrodes inside the battery. The conversions occur through electrochemical reduction-oxidation (redox) or charge-transfer reactions.1 These reactions involve the exchange of electrons between electro-active species in the two electrodes through an electrical circuit external to the battery. The reactions take place at the electrode/electrolyte interfaces. When current flows through the battery, an oxidation reaction will take place at the anode and a reduction reaction at the cathode. The oxidation reaction yields electrons to the external circuit, while a reduction reaction takes up these electrons from the external circuit.
The electrolyte serves as an intermediate between the electrodes. It offers a medium for the transfer of ions. Hence, current flow is supported by electrons inside the electrodes and by ions inside the electrolyte. Externally, the current flows through the charger or load.1
 -ion battery characteristics

A schematic representation of a typical  -ion cell is shown in Fig. 2.12 The cell consists of five regions: a negative electrode current collector made of copper, a porous composite negative insertion electrode, a porous separator, a porous composite positive insertion electrode, and a positive electrode current collector made of aluminum. The composite electrodes are made of their active material particles, held together with a polyvinylidenefluoride (PVDF) binder and a suitable filler material such as carbon black to enhance the electronic conductivity.
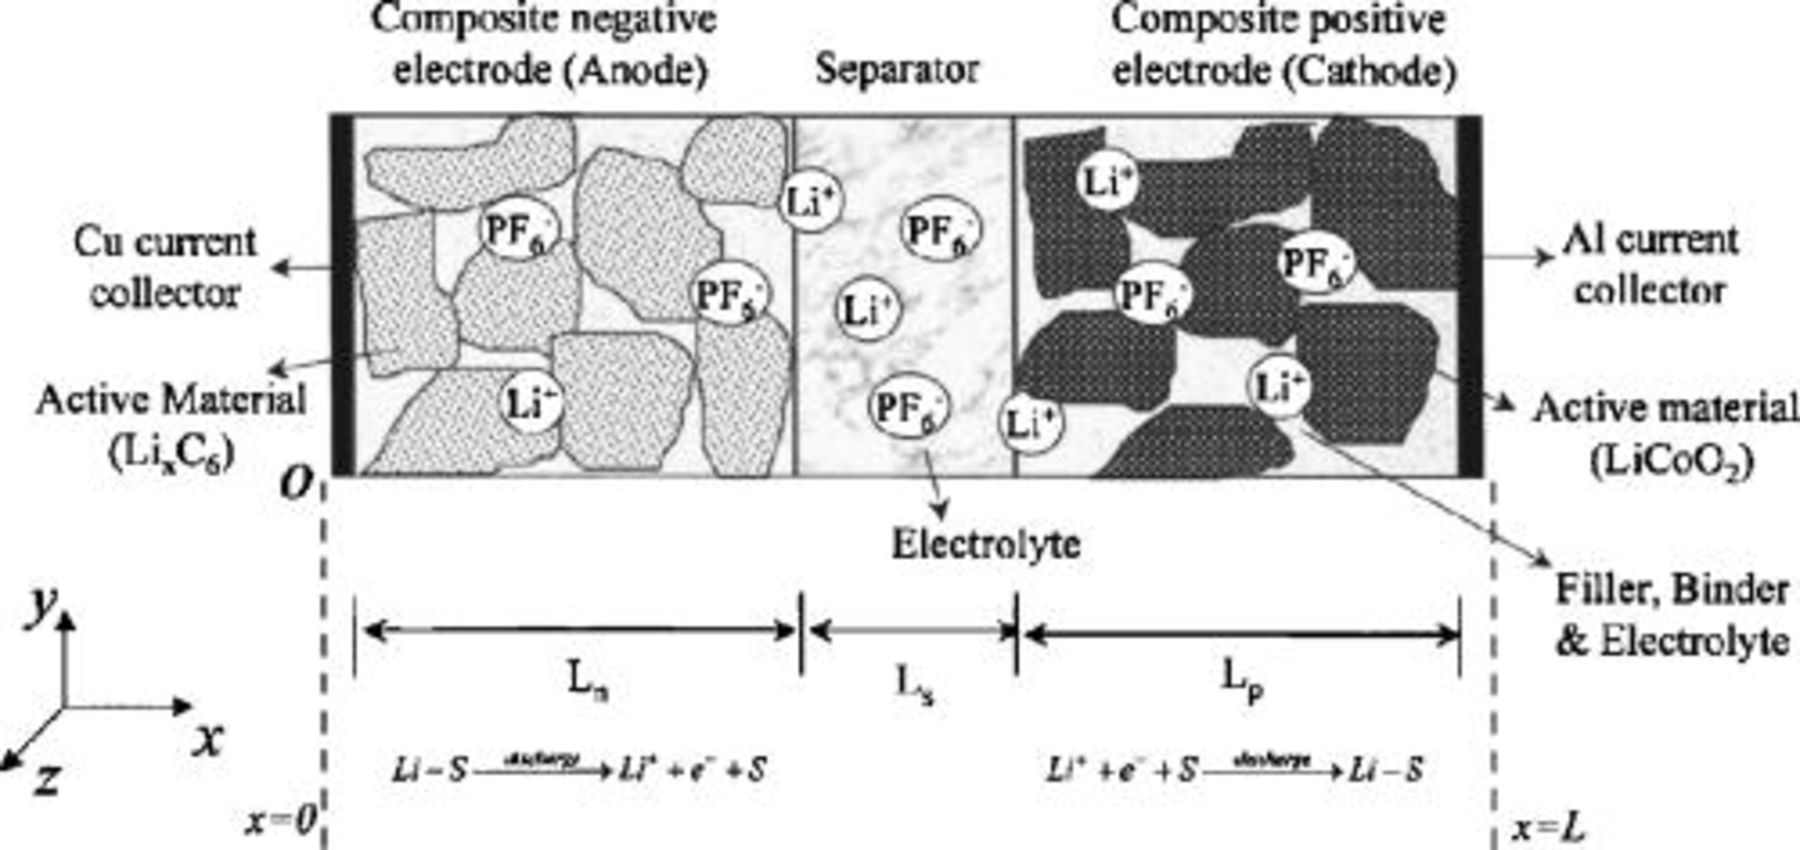
Figure 2. A schematic representation of a typical Li-ion cell. Reprinted from Journal of Power Sources, Vol. 110, P. M. Gomadam, J. W. Weidner, R. A. Dougal, and R. E. White, "Mathematical Modeling of Lithium-Ion and Nickel Battery Systems," pp. 267–284 (2002) with permission from Elsevier.12
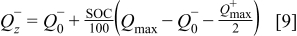
The following equations describe the charge-transfer reactions, for the  -ion battery type shown in Fig. 2
During discharge, the lithium ions deintercalate from the negative electrode particles (see Eq. 2) and enter the solution phase, while in the positive electrode region lithium ions from the solution phase intercalate into the  particles (see Eq. 1). The EMF voltage decreases during discharge, as the equilibrium potentials of the two electrodes are strong functions of the concentrations of lithium at the surface of the electrode particles. The cell is considered to have reached the end of discharge when its voltage drops to
  .12
.12
The positive electrode is generally composed of a lithium metal oxide (e.g.,  ,
,  , or
, or  ) or a combination of these
  to store the lithium ions. The negative carbon-based electrode is made of graphite or petroleum coke. The electrolyte is a salt dissolved in an organic solvent. An example of an applied salt is
  .
.
The operating voltage range of  -ion batteries is critical since over(dis)charging results in fast aging and can cause fire or even induce explosions. Therefore, an essential electronic protection circuit connected in series with the
  -ion battery is required to prevent over(dis)charging.1
Electromotive force
Mathematical models describing the EMF and the overpotential functions for a  -ion battery have been developed.1, 4 These models include a variety of parameters whose values depend on the determination method and experimental conditions. To enable accurate SOC indication the implementation of an accurate battery model is essential. The model applied in the proposed SOC indication system describes the battery EMF and overpotential behavior, both of which cannot be measured directly. The EMF and overpotential curves are derived from accurate Maccor battery tester measurements and further implemented in the battery management system (BMS) using approximation by means of mathematical functions.1–4 In addition to Coulomb counting inaccuracies, inaccuracies from the measurements for deriving the EMF and overpotential curves and from the functions approximating the derived curves will add to the SOC indication inaccuracy. The used determination and modeling methods for the EMF function is presented in this section.
EMF measurements
The EMF is the internal driving force of a battery for providing energy to a load. The battery voltage only equals the EMF when no current flows and the voltage has relaxed to its equilibrium value, i.e., the EMF.
In principle, the EMF can be calculated from thermodynamic data and the Nernst equation (or more complex equations derived thereof).1 Another method with which the EMF can be experimentally obtained is called linear interpolation. In this method the average battery voltage, calculated at the same SOC, is determined from the battery voltages during two consecutive discharge and charge cycles with the same  rate and at the same temperature. Taking the average of the charge and discharge voltage has the scope of eliminating to the greatest extent possible the presence of the overpotential and hysteresis in the EMF function.13–16 In this paper, the EMF has been determined by means of the linear interpolation method described as follows. First, the battery has been fully charged until
  at a constant
  rate. At the end of the charge cycle the SOC level has been defined to be 100%. The step of charging has been followed by a rest period of
  . After this rest period a discharge step at a constant
  rate until the battery voltage reaches
  has been applied. At the end of the discharge cycle the SOC level has been defined to be 0%. The low
  -rate value has been chosen to minimize the effect of the overpotential. The long rest steps have been chosen in order to start a new cycle always from the equilibrium state. In this way the effect of a not fully relaxed voltage is eliminated from the EMF determination. Figure 3 shows the EMF curve obtained at
  with the linear interpolation method. The US18500G3
  -ion batteries from Sony have been used throughout all experiments and simulations presented in this paper. At the time of testing the batteries were fairly new, with nine discharge-charge cycles in their history. The rated capacity of these batteries is
  .
.

Figure 3. EMF curve  obtained with the linear interpolation method at
  .
.  represents the measured battery voltage during charge and
  during discharge. The horizontal axis shows the SOC (%) normalized to the maximum capacity.
As during (dis)charge the battery voltage is (lower)higher than the EMF (see Fig. 1). The assumption of the linear interpolation method is that, at a given SOC, the overpotential during discharge and charge cycles is symmetrical. As the overpotential is time- and SOC dependent,1 in order to obtain a symmetrical overpotential the starting point in time and SOC of the experiment during the charge and discharge cycles should be the same. Figure 4 shows the charge and discharge overpotentials determined as a difference between the EMF, obtained by means of voltage relaxation as described further below, and the charge-discharge voltage. It can be concluded from Fig. 4 that the charge and discharge overpotentials are not symmetrical. This nonsymmetry is caused by a different buildup of the overpotential as function of SOC for the charge and discharge cycles. More information on the overpotential is given in the next section. Therefore, interpolation is not a preferred determination method for the EMF, because the overpotentials are not symmetrical.

Figure 4. The charge  and discharge
  overpotential obtained as the difference between the EMF and charge-discharge voltage at 0.05
  rate and
  , i.e., the same
  and
and  conditions as used in the linear interpolation method. The EMF has been experimentally determined by voltage relaxation (Ref. 1). The horizontal axis shows the SOC (%) normalized to the maximum capacity.
In another known method, the EMF is determined based on voltage relaxation.1 The battery voltage will relax to the EMF value after current interruption. This may take a long time, especially when a battery is almost empty, at low temperatures and after a high discharge current rate.17 Figure 5 illustrates what happens to the battery voltage after a discharge step. In order to guide the eye, the battery voltage during the relaxation period has been plotted as a function of logarithm of the relaxation time in Fig. 6. As can be seen in Fig. 5, the open-circuit voltage (OCV) does not coincide with the EMF voltage  of the battery during the transition process. The value of the OCV changes from
  after the current interruption to about
  after
after  . It can be observed from Fig. 6 that the OCV is constant after about
  . The voltage after
  differs by approximately
  from the voltage after
  . For this example, when it is considered that the equilibrium state has been entered after
  the inaccuracy for the SOC indication is about 4.2%; see Fig. 5.
Figure 5. Voltage relaxation after a discharge current step of 0.25  rate at 0% SOC and
  . The horizontal axis shows the relaxation time in min.
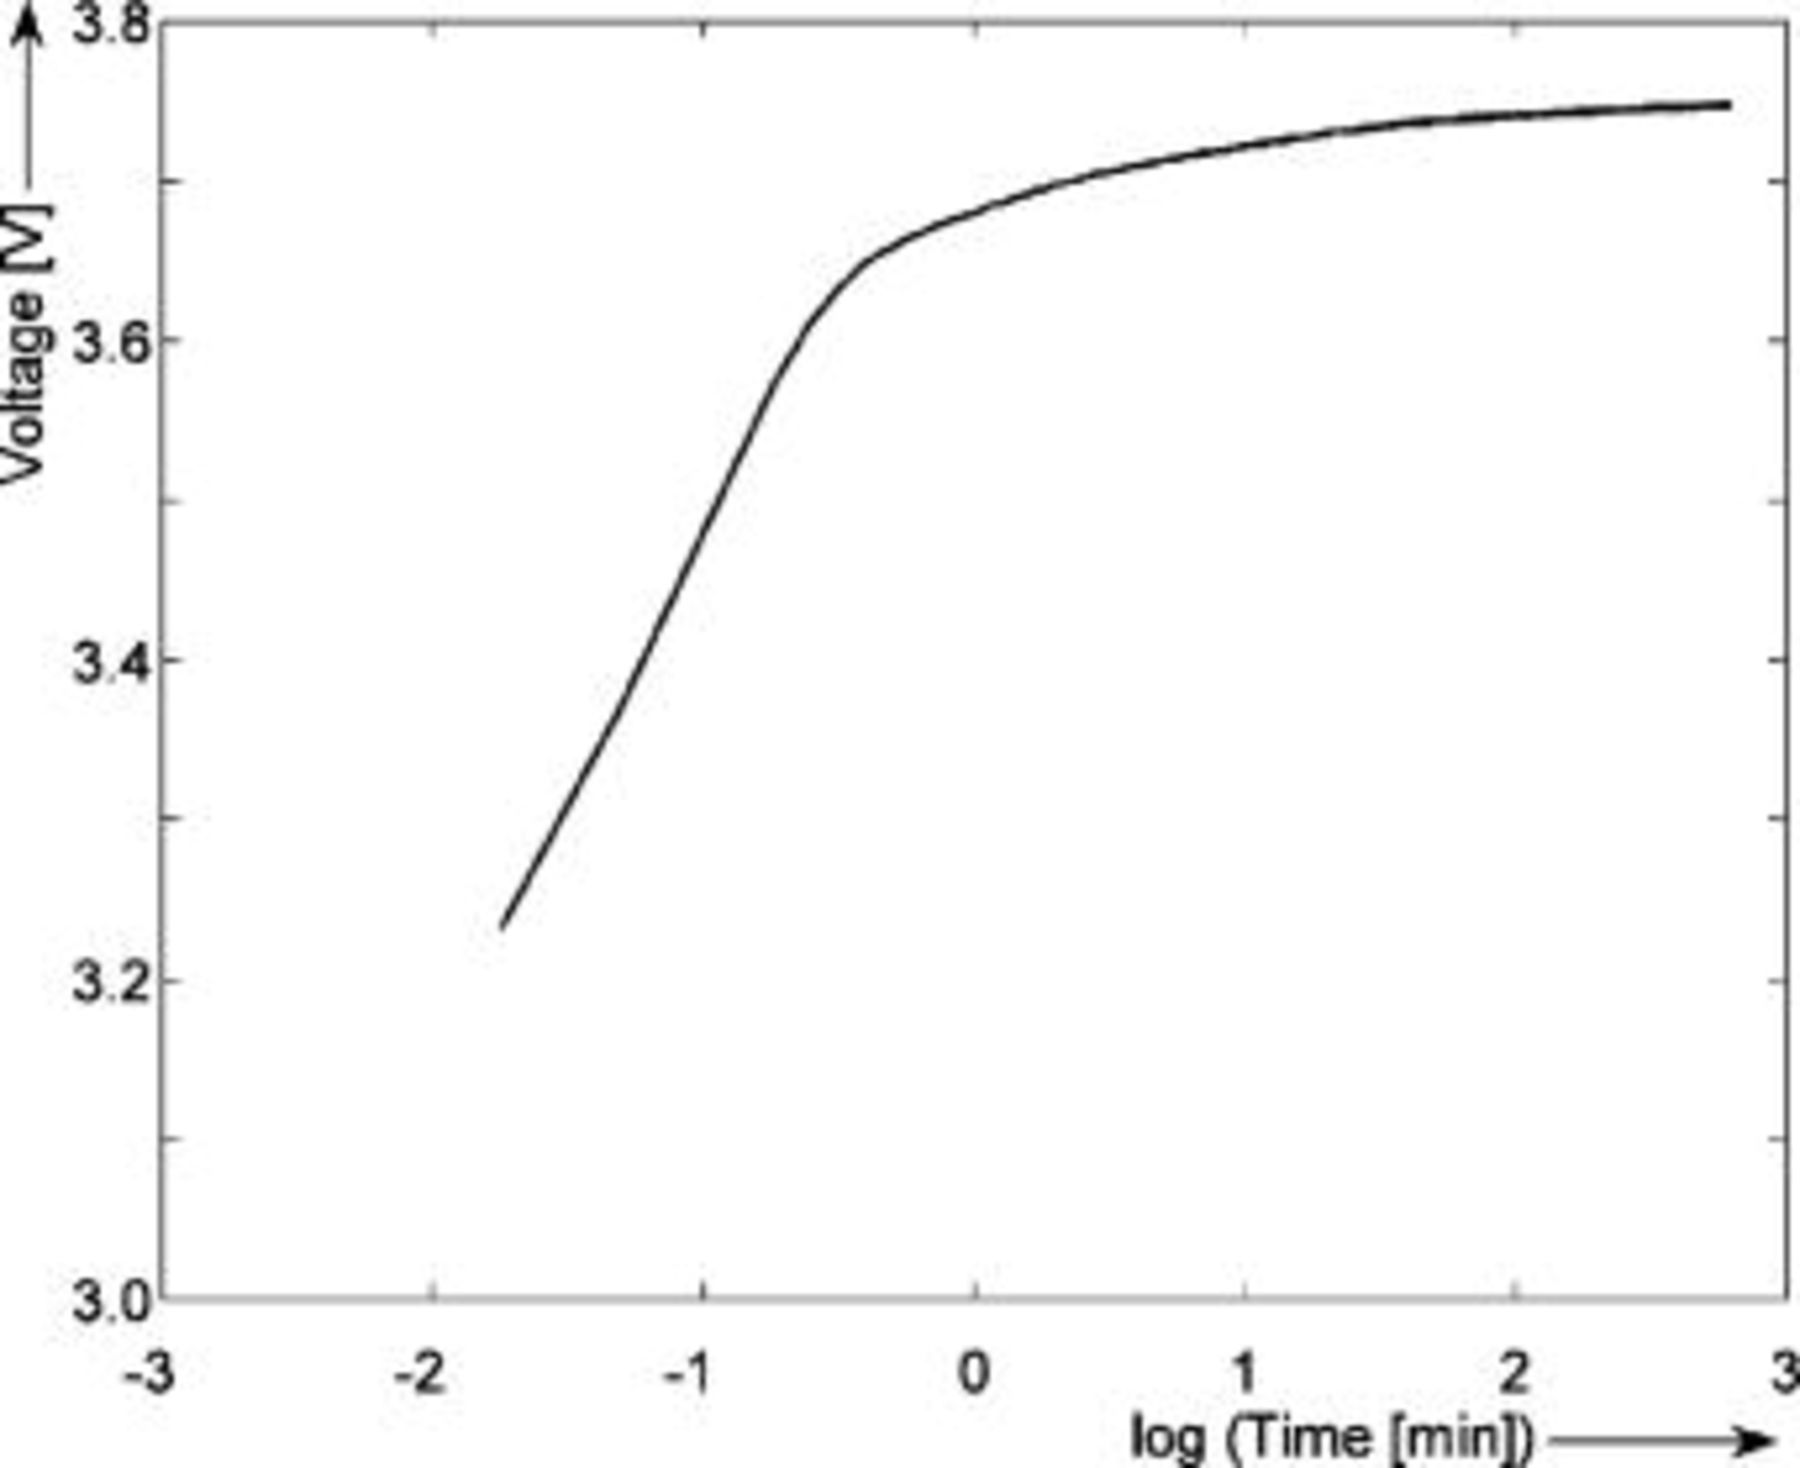
Figure 6. Voltage relaxation after a discharge current step of 
 rate at 0% SOC and
  . The horizontal axis shows the logarithm of the relaxation time
  .
.
In this paper the voltage relaxation method has been applied as follows. First, the battery has been charged at  rate in 25 steps. For each step of the experiment a limit of
  in voltage and
  in capacity has been considered. Four steps of "deep charge" at
  rate have followed. At the end of these steps the SOC level has been defined to be 100%. Each charge step has been followed by a rest period. The rest period has been chosen as a function of SOC, e.g., at low SOC long relaxation times of
  have been chosen and at higher SOC shorter relaxation times of
  have been applied. After charging, 25 discharge steps of
  each have followed at a
  rate and with a voltage limit of
  . Four steps of deep discharge at
  rate have followed. At the end of these steps the SOC level has been defined to be 0%. Each discharge step has been followed by a rest period. The rest period has been chosen as a function of SOC, e.g., at low SOC long relaxation times of
  have been chosen and at higher SOC shorter relaxation times of
  have been applied. The low
  rate of the experiments has been selected to obtain an equilibrium voltage faster. The experiment has been repeated at different
  rates and temperatures.
The 29 measured EMF points have been further fitted using a newly developed method in which the shape of the curve is also taken into consideration. As a result 20,000 fitted points have been obtained that yield measured EMF values for each 0.005% increment in SOC value. Figure 7 illustrates the measured EMF curve determined with the voltage relaxation method during the discharge cycles.
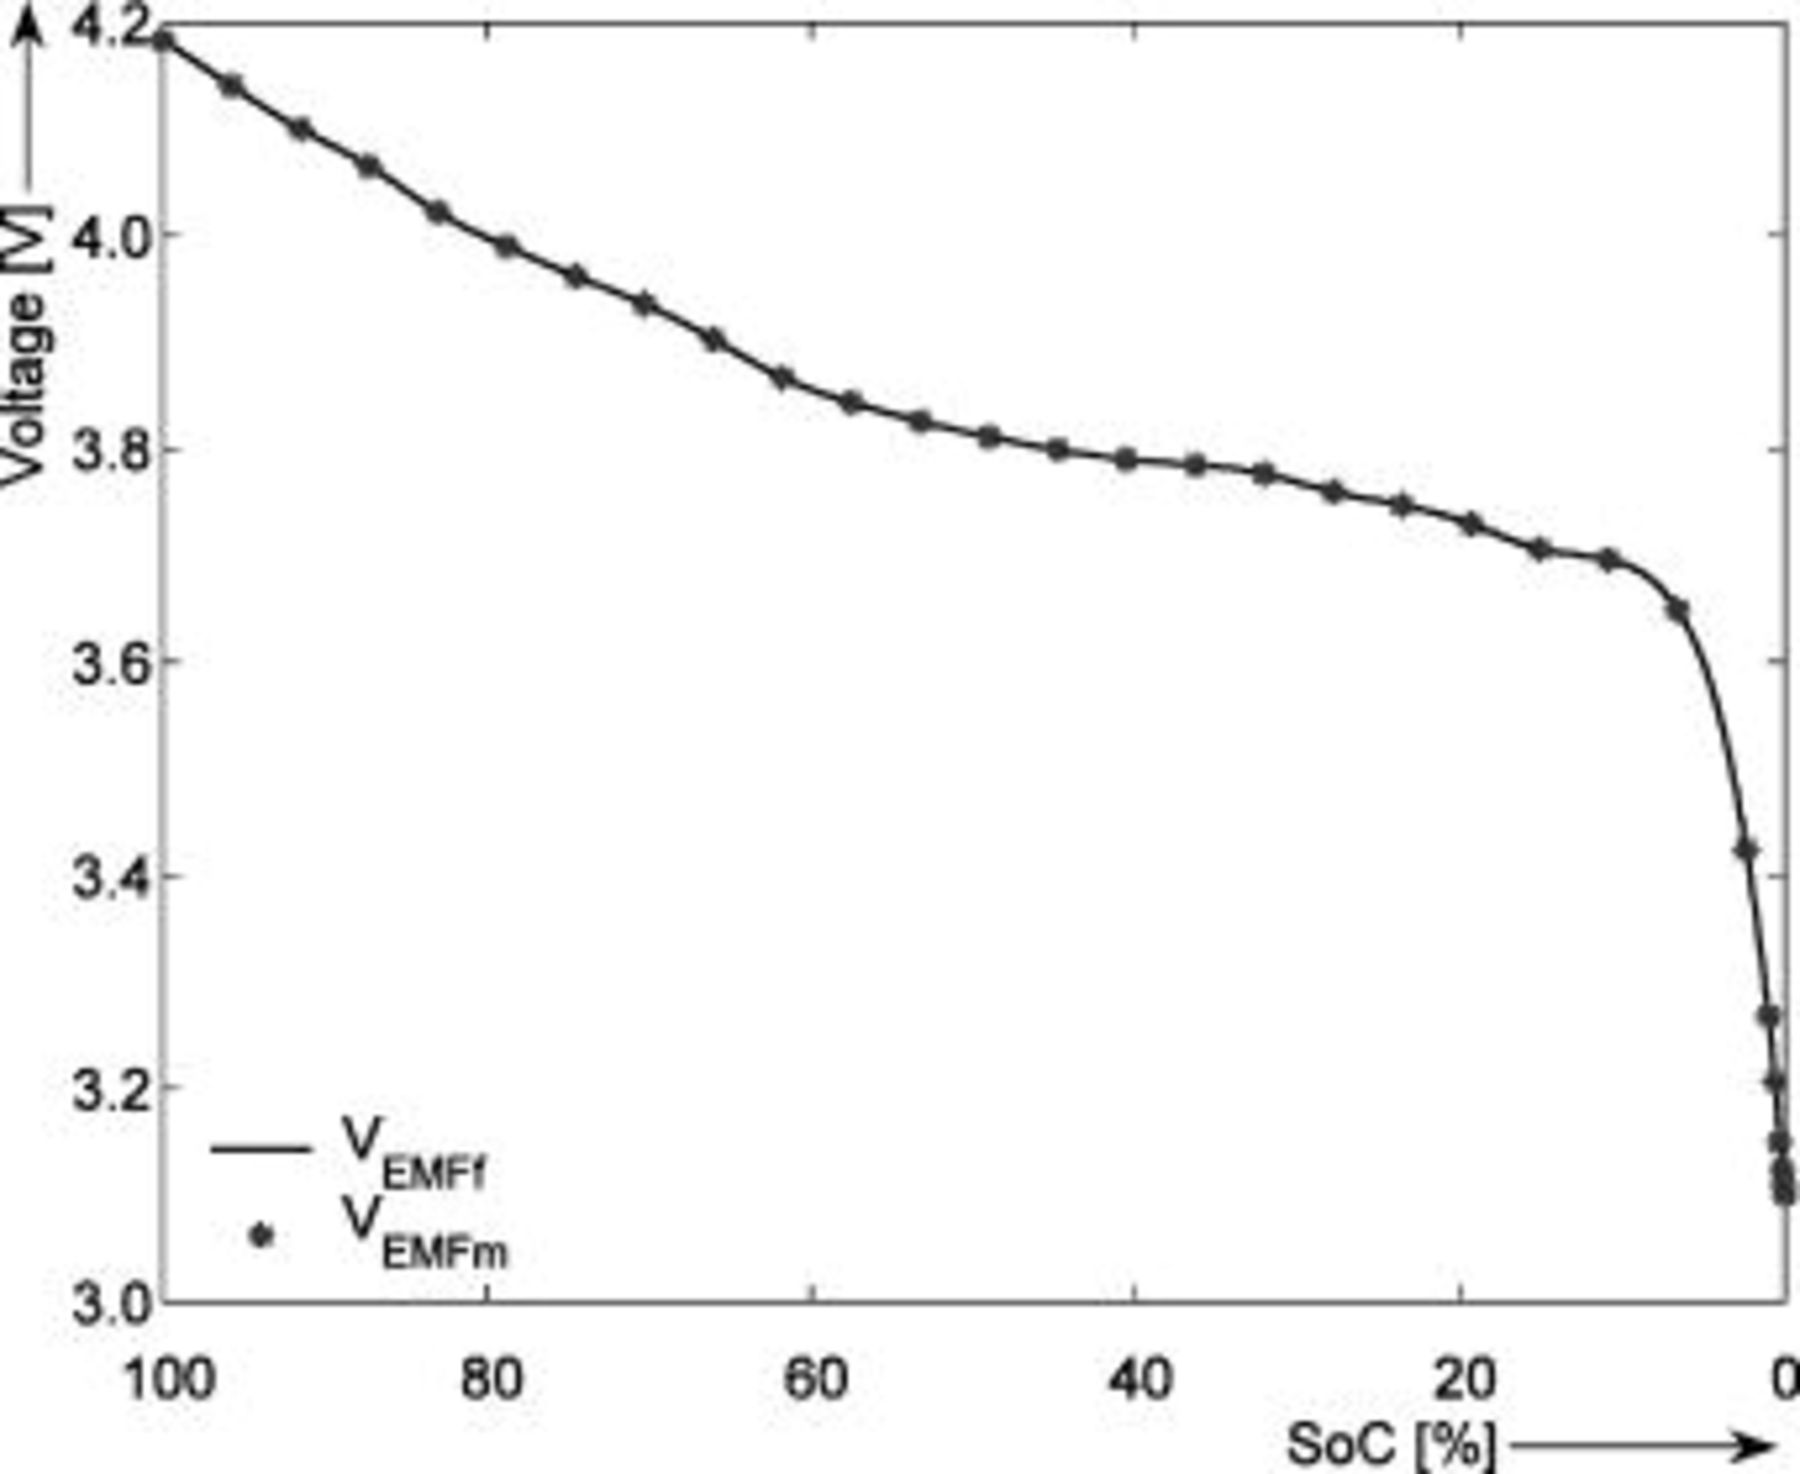
Figure 7. Measured EMF data points  and the fitted EMF curve
  obtained with the voltage relaxation method during the discharge cycles. The horizontal axis shows the SOC (%) normalized to the maximum capacity.
Figure 8 presents the EMF obtained with the voltage relaxation method as a function of temperature  during the discharge cycles. In order to guide the eye, the difference between the EMF obtained at different temperatures is plotted in Fig. 9. It can be concluded that the maximum difference between the EMF measured at
  and that measured at
  is about
  at around 4% SOC. This means that, when using the EMF without taking into consideration the temperature effect by modeling only the EMF curve at
  , the SOC indication system based on the EMF will display an SOC value of 3.6% at
  , when actually the SOC value is 4.1%. The inaccuracy, calculated as the difference between the true SOC value measured at
  and the SOC value measured at
  , will be 0.5%.18 This effect will be more pronounced at low temperatures and in the flat region of the EMF-SOC curve, where even small differences in the EMF will cause larger errors in SOC.
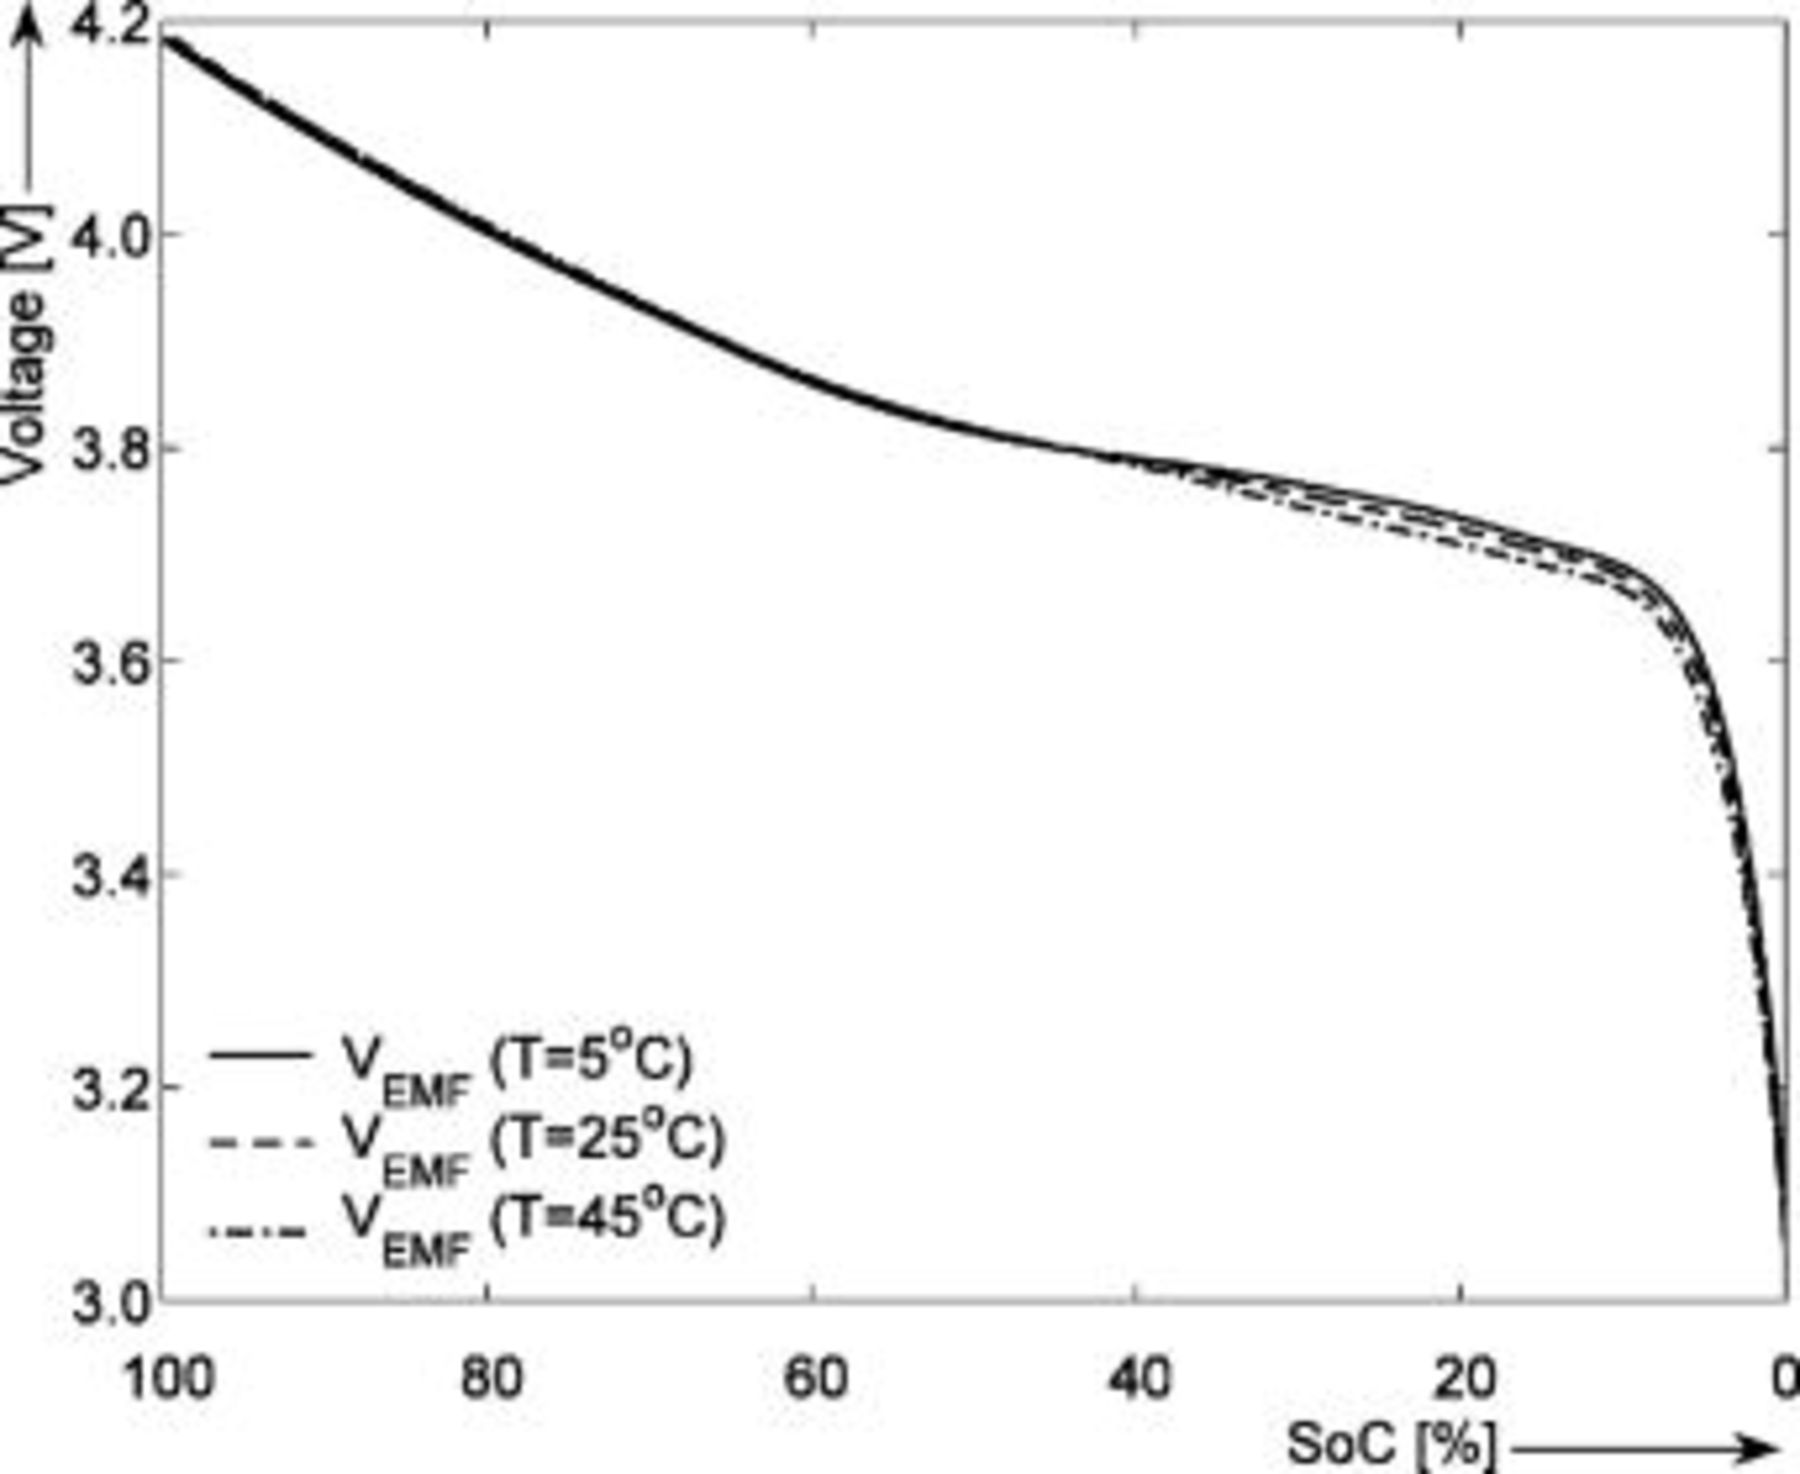
Figure 8. EMF measured by means of voltage relaxation during the discharge cycles as function of temperature. The horizontal axis shows the SOC (%) normalized to the maximum capacity.

Figure 9. EMF difference as function of temperature. The horizontal axis shows the SOC (%) normalized to the maximum capacity.
Figure 10 presents the charge-discharge EMF difference obtained with the voltage relaxation method at different temperatures. It follows from Fig. 10 that the maximum difference between the charge-discharge EMF is  at around 5% SOC at
  . This means that, when using the EMF without taking the charge-discharge EMF difference into consideration, by modeling only the charge EMF curve, the SOC indication system based on the EMF will display an SOC value of 5.1% in this case, when the actual SOC value calculated based on the discharge EMF is 6.1%. The inaccuracy will be 1% SOC. This effect will be more pronounced at low temperatures and in the flat region of the EMF-SOC curve, where even small differences in the EMF will cause larger errors in SOC.

Figure 10. The measured charge/discharge EMF difference as function of temperature  . The horizontal axis shows the SOC (%) normalized to the maximum capacity.
Figure 11 presents the charge-discharge EMF difference as a function of  rate. The charge-discharge EMF difference is consistently the same for SOC values higher than 4%. The small charge-discharge EMF difference at low SOC is explained by the different discharge
  rates used in the experiments.
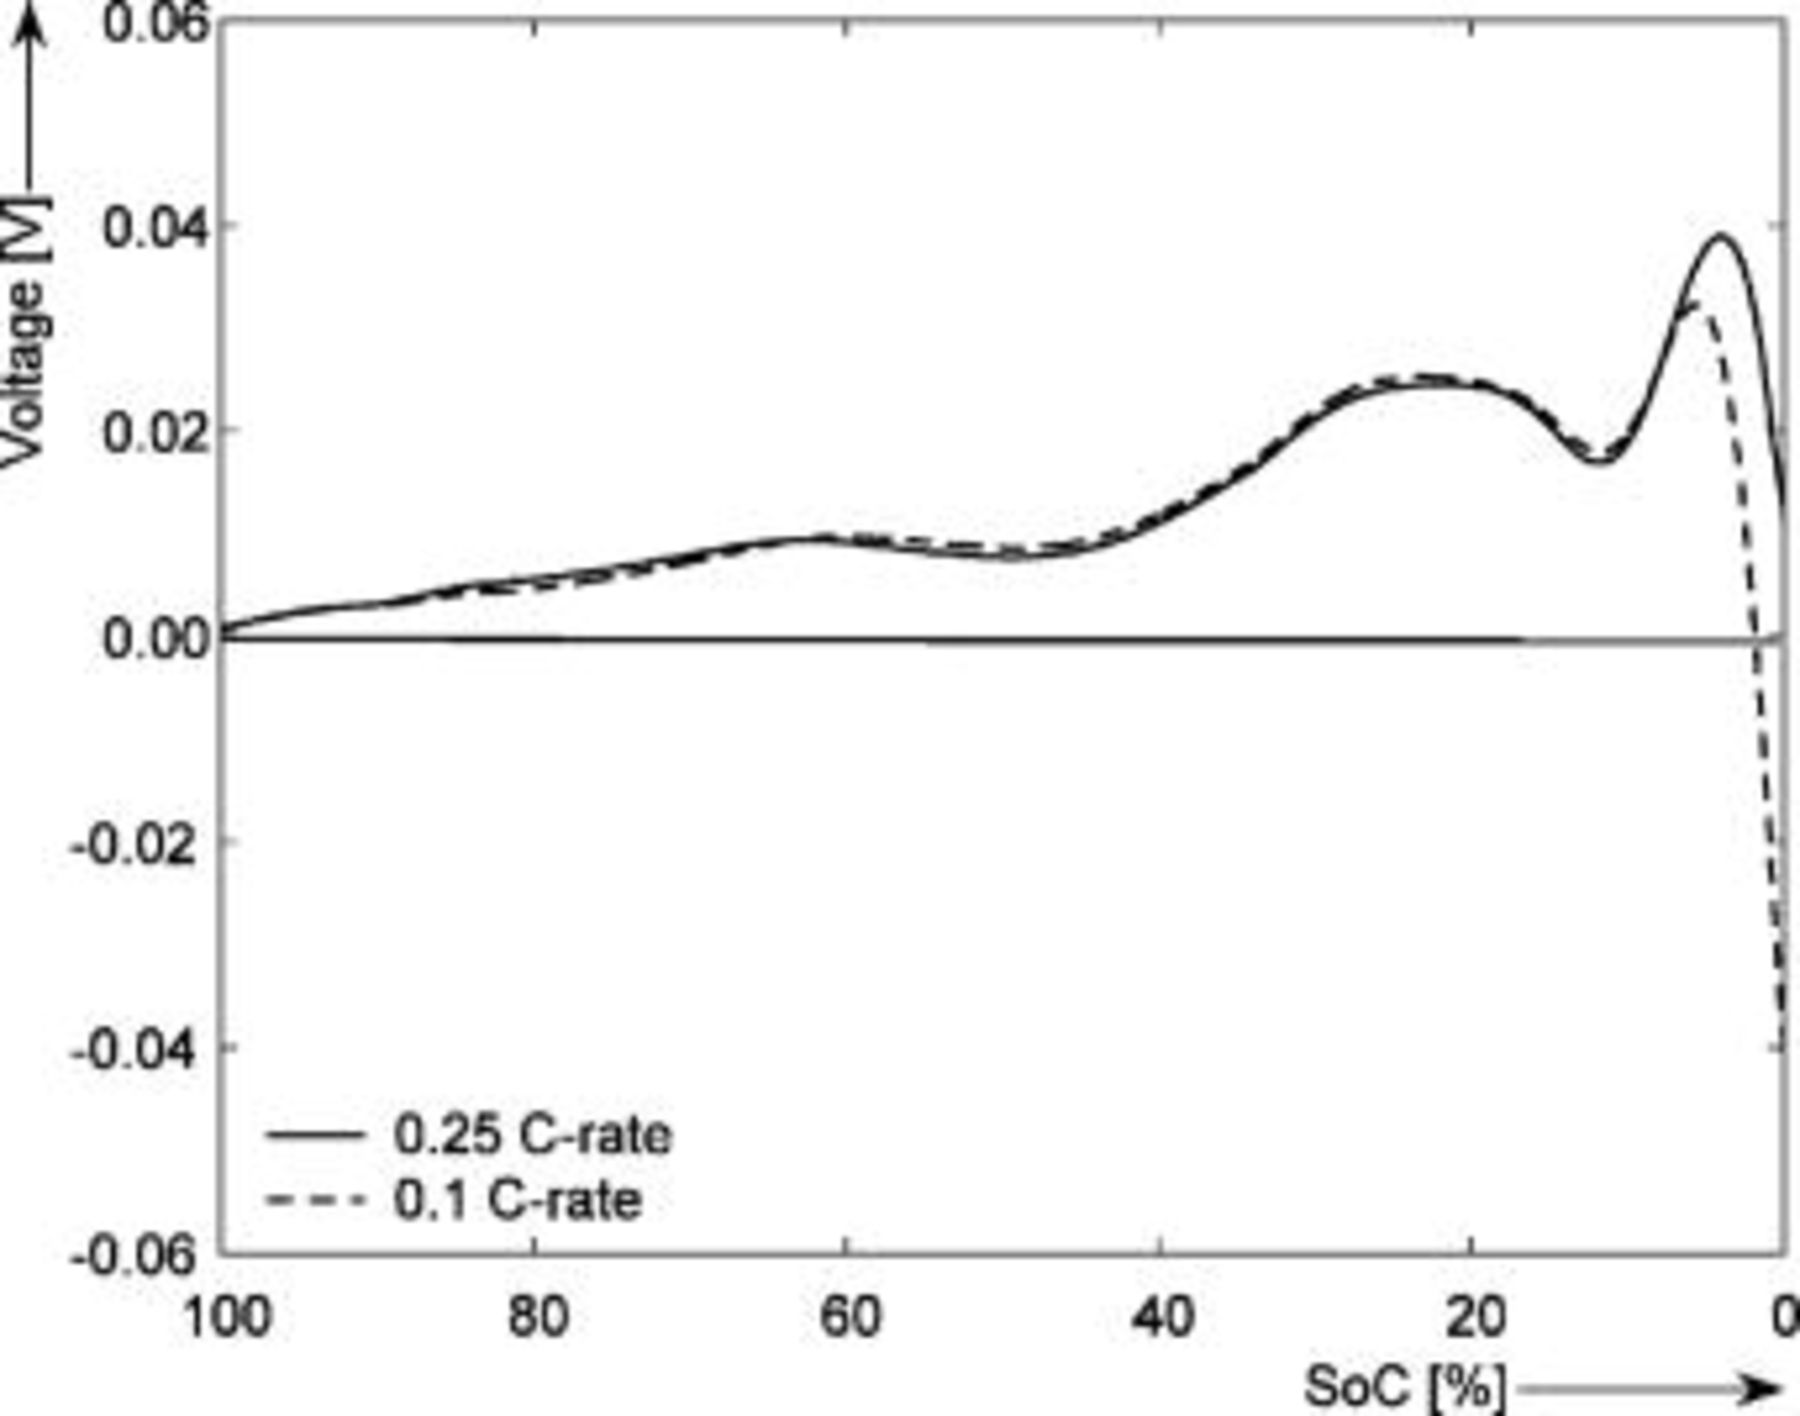
Figure 11. The measured charge/discharge EMF difference as function of  rate at
  . The horizontal axis shows the SOC (%) normalized to the maximum capacity.
In order to further investigate the charge-discharge EMF difference, two possible measurement artifacts that may have caused the occurrence of the charge-discharge EMF difference have been considered. In the first place, due to the long rest periods chosen in the voltage relaxation measurements, the self-discharge may have influenced the measured SOC-EMF values. Second, the battery voltage may not have reached the EMF equilibrium voltage at the end of the rest periods used in the voltage relaxation experiment. In order to investigate the first possible measurement artifact, two uniform self-discharge values of 3% and 6% SOC/month at  have been considered.1 For this purpose the SOC [%] values on the horizontal axis of the measured EMF curves have been corrected taking the two assumed self-discharge values into account. In order to investigate the second possible measurement artifact, a new voltage prediction model has been developed. This model predicts the EMF voltage based on the first part of the measured voltage relaxation curve within 0.2% SOC accuracy under a wide range of conditions. Figure 12 illustrates what happens with the charge-discharge EMF difference when the battery self-discharge and the predicted EMF voltage are considered.

Figure 12. The measured and calculated charge-discharge EMF difference at  when the battery self-discharge (sd) and the predicted EMF voltage
  are considered. The horizontal axis shows the SOC (%) normalized to the maximum capacity.
A first conclusion that arises from Fig. 12 is that the self-discharge is not the cause of the charge-discharge EMF difference. A second conclusion is that, by predicting the EMF voltage based on the first part of the measured voltage relaxation curve, the charge-discharge EMF difference is reduced at lower SOC. This can be explained by the fact that at low SOC (e.g., SOC lower than 25%),  rest periods have apparently not been sufficient in order to obtain an equilibrium voltage.
The remaining small EMF difference may be explained by hysteresis between the charge and discharge EMFs. There are a few documented examples of the hysteresis occurring in  -ion battery systems.19–21 These include the history-dependent equilibrium potential observed during the intercalation of lithium ions into carbon.20, 21 In these articles it is believed that the lithium atoms may bind on hydrogen-terminated edges of hexagonal carbon fragments. In this situation the capacity for the insertion of lithium is strongly dependent on the hydrogen content of the carbon materials. If the inserted lithium binds to a carbon atom, which also binds a hydrogen atom, a corresponding change to the carbon-carbon bond from
  to
to  occurs. This bonding change in the host leads large hysteresis during lithium insertion.20, 21
We do not claim to understand this complex process. The hysteresis might also be introduced by the  electrode. Tentatively it may be concluded that a possible cause for the hystereses are the phase transitions
  . For further reading on electrochemical hysteresis the reader is referred to Refs. 16, 20, 21.
EMF modeling
The physical model used for the EMF-SOC relationship is presented in this section. This EMF model is a part of the  -ion battery model presented in Ref. 22. With this model for a certain EMF and temperature the corresponding SOC can be calculated. The EMF curve, measured by means of voltage relaxation as discussed in the previous section, is approximated with a mathematical
  function in which the EMF of a
  -ion battery with intercalated electrodes is modeled as the difference in equilibrium potentials of the positive and negative electrodes, i.e.
where the equilibrium potential of the positive electrode  is given by

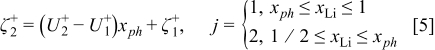
in which  is the standard redox potential of the
  electrode in [V],
  denotes the dimensionless interaction energy coefficient in the
  electrode,
  is a dimensionless constant in the
  electrode,
  the molfraction of
  ions inside the positive electrode, i.e., the SOC of the
  electrode,
  the gas constant
  ,
,  the Faraday constant
  , and
, and  the (ambient) temperature in [K]. In Eq. 5 a phase transition
  occurs at
  that results in a curvature change. According to modern literature on
  -ion batteries with a
  electrode (see, e.g., Ref. 1, 23), the main phase-transition point is located near
  , while there is also a minor one at
  . The phase transition is noticed as a change in the slope of the equilibrium potential as a function of
  . This change in the slope of the equilibrium potential is realized in the present physical model by a change in the interaction energy between the intercalated
  ions from a value
  in phase 1 to a value
  in phase 2.1 The values of the dimensionless constants
  and
and  in phases 1 and 2, respectively, are chosen so that a continuous transition is achieved from the equilibrium potential in phase 1 to that in phase 2 (see Eq. 5).
The negative electrode is modeled similarly, with only a small difference

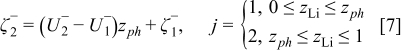
where  is the standard redox potential of the
  electrode in [V],
  denotes the dimensionless interaction energy coefficient in the
  electrode,
  is a dimensionless constant in the
  electrode, and
  is the mole fraction of the
  ions inside the negative electrode, i.e., SOC of the negative electrode. In the negative electrode a phase transition occurring around
  has been modeled. Similarly as for the positive electrode, the phase transition is noticed as a change in the slope of the equilibrium potential as a function of
  . This change in the slope of the equilibrium potential is realized in the present physical model by a change in the interaction energy between the intercalated
  ions from a value
  in phase 1 to a value
  in phase 2.1 The values of the dimensionless constants
  and
and  in phases 1 and 2, respectively, are chosen so that a continuous transition is achieved from the equilibrium potential in phase 1 to that in phase 2 (see Eq. 7). Under normal operational conditions
  will cycle between 0.5 and 1 while
  will cycle between 0 and 1.1
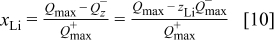
In order to model the EMF-SOC relationship in a practical SOC indication system, in addition to parameters characterizing the electrode electrochemistry, parameters related with the battery design are also requested. As schematically indicated in Fig. 13, the  -ion battery can be characterized by the following set of parameters:
  denotes the maximum capacity of the positive electrode,
  denotes the maximum capacity of the negative electrode,
  represents the amount of electrochemically active
  ions inside the battery, and
  represents the amount of
  ions inside the negative electrode in a "fully" (under standard operational conditions) discharged battery. Finally,
  denotes the charge stored in the negative electrode for a given SOC.

Figure 13. (Color online) A schematic representation of the EMF-SOC relationship parameters related with the battery design.
For a new battery the amount of the electrochemically active  ions inside the battery
  will equal the maximum capacity of the positive electrode
  . Because
  cycles between 0.5 and 1 only half of the maximum capacity of the positive electrode
  is cyclable. In this case the number of the cyclable electrochemically active
  ions is equal with
  . During the first activation cycles, a part of
  ions will remain in the negative electrode (represented by
  in Fig. 13) and another part will be consumed in the solid electrolyte interface (SEI), which is an irreversible process. The
  capacity can be explained by the Nerstian decrease of the
  electrode equilibrium voltage when its SOC is going to zero. The SEI suppresses the decomposition of the electrolyte at the electrode surface.1 For simplicity the SEI has not been illustrated in Fig. 13 and in the present physical model. As a result the value of the maximum capacity of the positive electrode
  will be larger than the amount of electrochemically active
  ions inside the battery (see Fig. 13). Given the parameters from Fig. 13 and experimentally observed SOC (%) values, the
  and
and  can be determined from
It follows from Fig. 13 that the  ions move from the cobalt-oxide electrode to the graphite electrode during charging. At the end of charging the battery, SOC is defined to be 100%. As can be concluded from Fig. 13, the
  capacity value is equal to the
  capacity value in this case. As can be calculated from Eq. 9,
  is equal with
  . It follows from Eq. 8, 10, respectively, that in this case the
  value will equal 1 and the
  value will equal
  . During discharge the
  ions move from the graphite electrode to the cobalt-oxide electrode (see Fig. 13). At the end of discharging considered under standard operational conditions, the
  capacity value is equal to the value of the
  capacity (see Fig. 13). As can be calculated from Eq. 8, 10, respectively, the
  value will be a little bit larger than 0 and the
  value will be a little bit smaller than 1 (see Fig. 13).
 and
and  can be further calculated from Eq. 4, 5 and Eq. 6, 7, respectively. However, from the EMF measurements it has been noticed that the phase transition does not take place instantaneously but in a certain interval around the phase transition points.1 In order to achieve a smooth phase transition of the change in the slope of the equilibrium potential, the following approximation is considered


where Φ denotes a standard normal cumulative distribution function and the parameters  and
and  determine the smoothness of the phase transitions.
In order to include the temperature influence in the EMF-SOC relationship, a linear dependence of each of the model parameters has been assumed according to

where  is a reference temperature (e.g.,
  ),
),  is the ambient temperature, and
  is the value of one of the EMF-SOC model parameters at temperature
  . The
. The  value is the sensitivity to temperature determined for each parameter
  .
.
Different values for the EMF-SOC model parameters can be used for the charge and discharge EMF in order to deal with the hysteresis effect. Also, when another type of  -ion battery with a different EMF-SOC curve chemistry is modeled the model can be adapted by fitting, leading to new parameter values. In this way, this model may not be only limited to the present
  -ion battery type. Taking into consideration factors like hysteresis and temperature, this presented method is considered to be the best solution for a practical EMF implementation.6 Simulation results of the mathematical EMF implementation is presented in another section.
Overpotential
The overpotential is defined as the difference between the EMF and the charge-discharge voltage of the battery. Due to this overpotential, the battery voltage during the discharge state is lower than the EMF (see Fig. 1).2 The value of the overpotential depends on the discharge current, the SOC, age, and temperature. Especially for old cells, at low temperatures and at low SOC, due to a high overpotential the remaining charge cannot be withdrawn from the battery, because the battery voltage will drop below the EOD voltage defined in the portable device (e.g.,  ); see Fig. 1. This leads to an apparent capacity loss, which at low temperatures of, e.g.,
  amounts up to more than 5%.1 Hence, a distinction should be made between available charge in the battery (i.e., SOC) and the charge that can be withdrawn from the battery under certain conditions, expressed in remaining run time. This distinction can be made by taking the overpotential development during the discharge state into account. Measurement and modeling methods for the overpotential function are presented further in this section.
Overpotential measurement
As the overpotential represents the difference between the EMF and the charge-discharge voltages, first a discharge EMF is determined using the voltage relaxation method described previously. Then, several charge-discharge cycles are performed. To derive battery overpotential under various experimental conditions, the battery has always been fully charged with the normal constant-current-constant-voltage (CCCV) charging method at  rate. In the CV mode the voltage has been kept constant at
  until the current reached a
  -rate value. At the end of the CV mode the SOC level has been defined to be 100%. Each step of charging has been followed by a rest period of about
  . After this rest period a discharge step has been applied until the battery voltage reached
  at different constant
  rates of 0.1, 0.25, 0.5, and 1, respectively. Each step of discharge has been followed by a rest period of
  and by a deep discharge at
  rate. After this deep discharge step a rest period of
  has been applied. The long rest steps have been chosen in order to start a new cycle always from an equilibrium voltage. In this way the effect of a not fully relaxed voltage is eliminated from the overpotential determination. The above-described overpotential measurement method has been carried out at 5, 25, and
  , respectively. Figure 14 shows the overpotential curves obtained at
  for discharge. All the overpotential curves have been calculated as a difference, at the same SOC and temperature, between the determined EMF using the voltage relaxation method and the measured discharge curves using the constant-current method described earlier in this section.
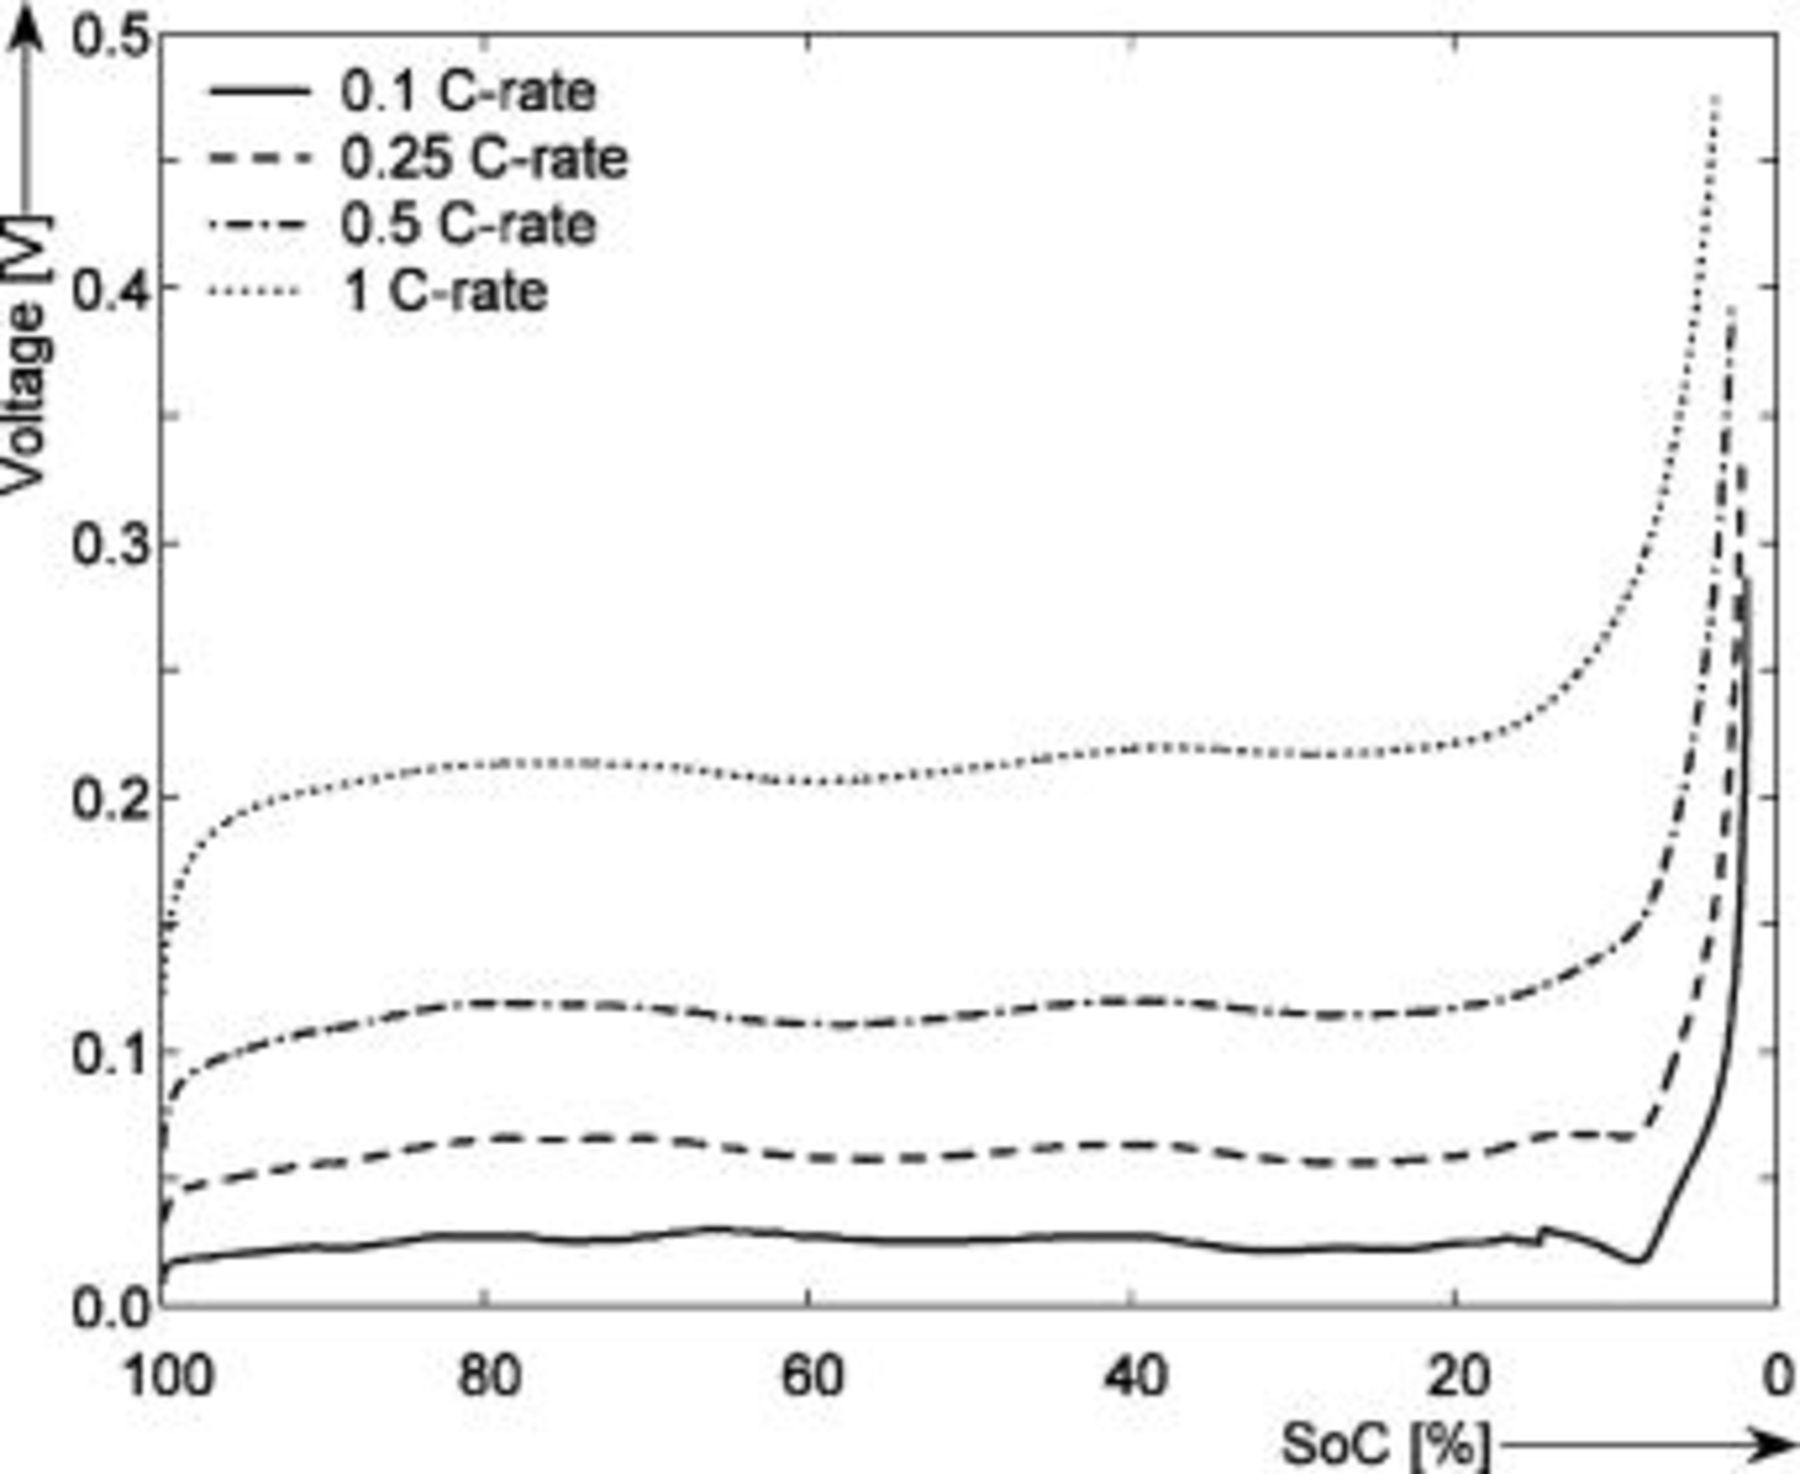
Figure 14. Overpotential curves for different  rates obtained at
  during discharge. The horizontal axis shows the SOC (%) normalized to the maximum capacity.
It can be concluded from Fig. 14 that a maximum overpotential of around  is obtained at 1
  rate and 3.8% SOC. This means that when using just the Coulomb counting method without taking into consideration the overpotential effect, the SOC indication system will display in this case 3.8% of the battery capacity.
Figure 15 presents the battery overpotential obtained with the above-described measurement method at three different temperatures during discharging cycles at  rate. It follows from Fig. 15 that a maximum difference, between the overpotential measured at
  and that measured at
  , is
, is  at around 5.9% SOC. This means that when using the overpotential without taking into consideration the temperature effect by modeling only the overpotential curve at
  , the SOC indication system will calculate an overpotential value of
  at
at  , when actually the overpotential value is
  . The inaccuracy, calculated as the difference between the true overpotential value measured at
  and the overpotential value measured at
  , will be
  .18 Due to this overpotential, the battery voltage will drop below
  and the battery appears to be empty for a user.1 Because the overpotential increases for old cells and at low temperatures (see also Fig. 15) the inaccuracy in these situations will be higher.1 Therefore, accurate overpotential modeling is needed under these conditions.

Figure 15. Overpotential curves for different temperatures obtained at  rate during discharge. The horizontal axis shows the SOC (%) normalized to the maximum capacity.
Overpotential modeling
In this section an overpotential equation inferred from physical models previously developed is presented.1, 24 The overpotential, in which the ohmic, kinetic, diffusion overpotential, and the increase of the diffusion overpotential when the battery becomes empty are considered, is modeled as follows

where  for discharge,
  for charge,
  ,
,  , denote the contributions of the "ohmic" and "kinetic" resistance,
  and
and  , denote the contributions of the "diffusion" resistance,
  is a constant,
  denotes the diffusion time constant,
  (dimensionless), and
  are parameters related with the magnitude of the diffusion overpotential,
  and
and  , denote the amount of the energy that cannot be obtained from the battery when the current
  increases,
  denotes the charge present in the battery at the time
 and
and  numerically. Finally,
  is a time constant associated with the increase in overpotential in an almost empty battery in (s).1 Simulation results of the mathematical overpotential implementation are presented next.
Results
The results of the mathematical implementation of the EMF and overpotential functions in the SOC system are presented in this section. The Sony US18500G3  -ion battery has been used throughout the experiments. The EMF equations described previously need to be fitted to a measured EMF curve.
Figure 16 shows that the modeled EMF curve used in the system reveals a good fit with the measured curve obtained with the Maccor battery tester at all temperatures. It can be concluded that the maximum error in SOC,  , is obtained at
  and at around 16% SOC. This 1.2% SOC error corresponds to a
  capacity value, which can still be removed from the battery. As can be calculated from
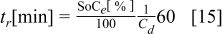
for a new battery at a  rate mean discharge current
  , this implies around
  of remaining run time,
  . However, in most of the cases the SOC error is lower than 0.9% so it can be concluded that the produced error due to the EMF implementation using the model presented will generally provide us enough accuracy in order to achieve a final accuracy of
  or better of the remaining run-time indication. The EMF model parameters values used in the simulations illustrated in Fig. 16 are summarized in Table I. Column one gives the symbol of the EMF model parameter. The value and the unit of the EMF model parameters are given in columns two and three, respectively. The
  and
and  parameters are derived from Eq. 5, 7, respectively.
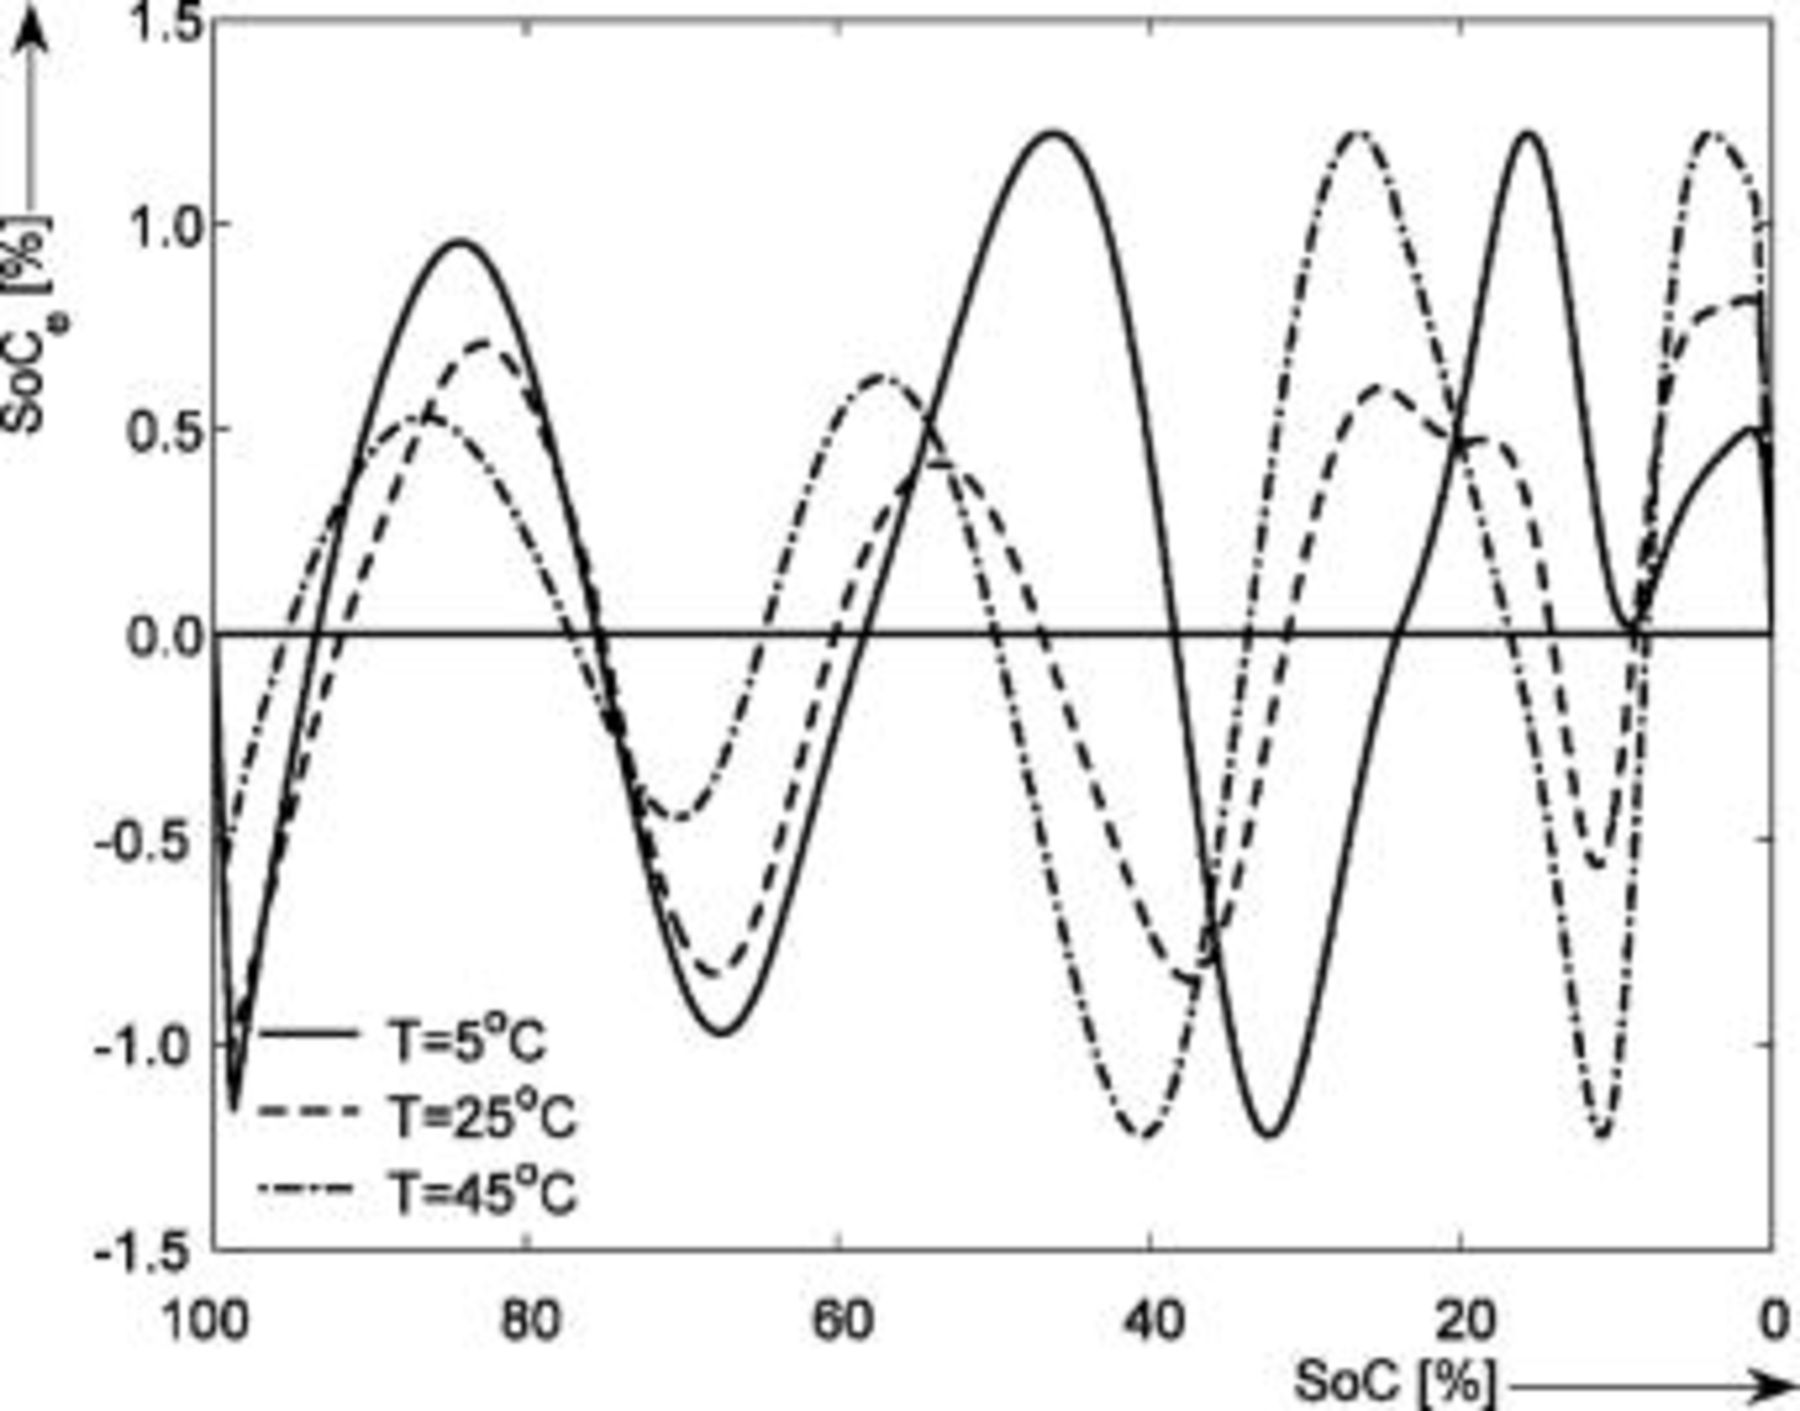
Figure 16. Accuracy of the SOC indication using the measured EMF curve vs the fitted EMF curve at 5, 25, and  . The horizontal axis shows the SOC (%) normalized to the maximum capacity.
Table I. The battery EMF model parameter values.
| Parameter | Value | Unit |
|---|---|---|

|

| (1) |

|

|

|

|

| (1) |

|

|

|

|

| (1) |

|

|

|

|

| (1) |

|

|

|

| 0.00 | (1) |

|

|

|

|
| (1) |

|

|

|

|

| (1) |

|

|

|

|

| (1) |

|

|

|

|

| (1) |

|
|

|

|

| (1) |

|

|

|

|

| (V) |

|

|

|

| 1.00 | (1) |

|

| (1) |

|

| (1) |

|

| (1) |

|

|

|
aSee Eq. 13. bParameter set to zero by identification condition. cOnly the  difference is identifiable from the battery EMF retrieved by means of the voltage relaxation measurement method described in this paper. The
  and
and  can be separately identified from voltage relaxation measurements applied for individual electrodes. In this paper such an experiment has not been considered; therefore, the
  difference has been considered as an estimable parameter. dThe
  parameter has not been identifiable from the battery EMF retrieved by means of the voltage relaxation measurement method described in this paper. In this case the
  has not been estimated but normalized to be 1. The other
  -related parameters are interpreted as fractions from the
  value. As a result all those parameters are dimensionless.
During the discharge state, apart from simple Coulomb counting, also the effect of the overpotential is considered. Based on the mathematical implementation of the overpotential described previously, in which the ohmic, kinetic, diffusion overpotential, and the increase of the diffusion overpotential when the battery becomes empty are considered, and the measured EMF, the measured and fitted overpotential at four different discharge current rates and at  as a function of the relative SOC are illustrated in Fig. 17. In order to guide the eye, the difference between the measured and fitted overpotential at four different discharge currents as a function of the relative SOC is plotted in Fig. 18.


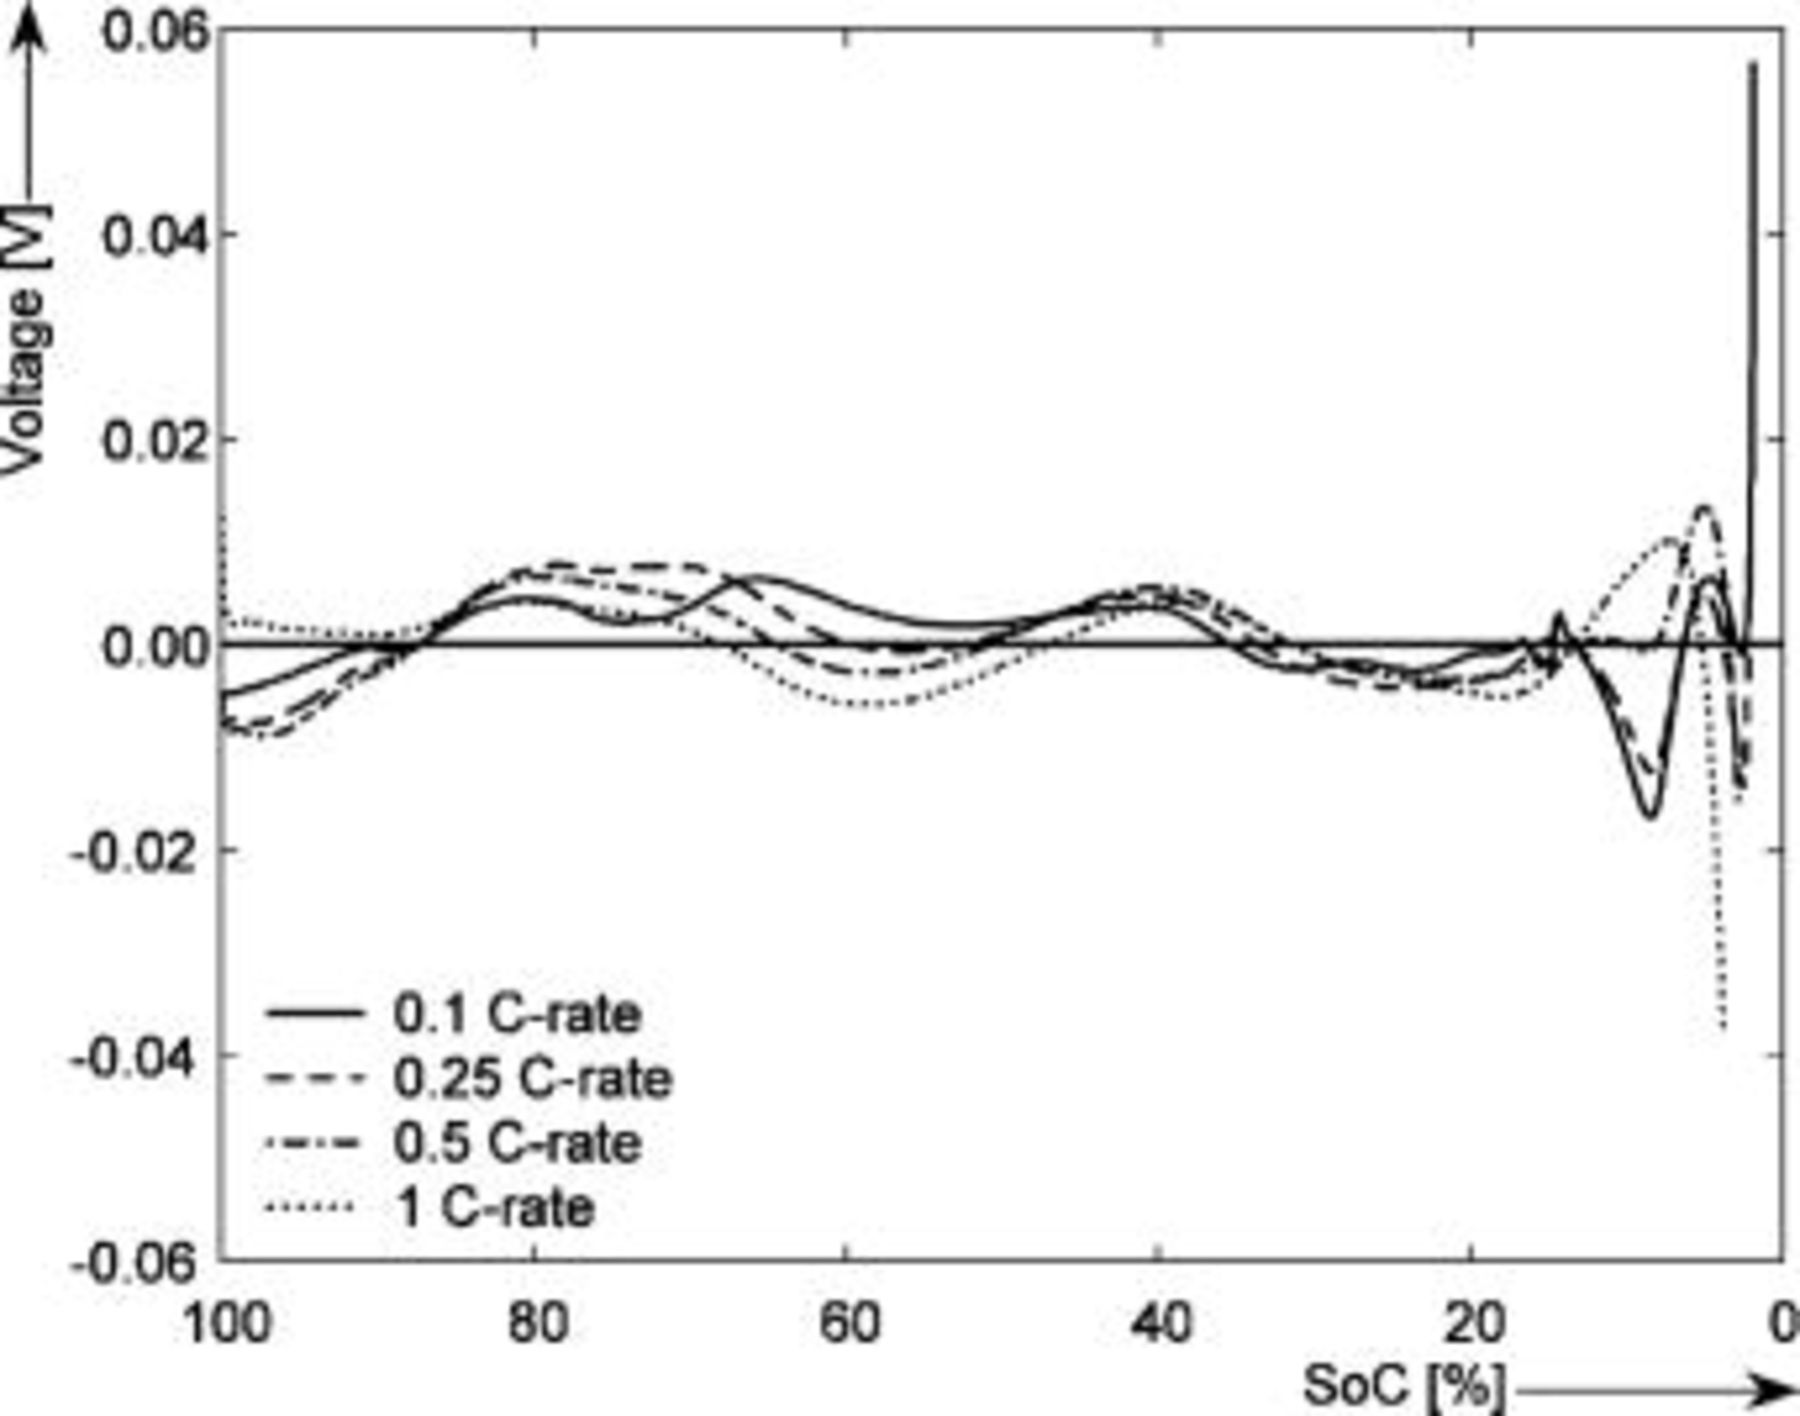
Figure 18. Accuracy of the fitted overpotential curves versus the overpotential measured with the Maccor battery tester at  . The horizontal axis shows the SOC (%) normalized to the maximum capacity.
It can be concluded from Fig. 17 and 18, respectively, that the maximum difference between the measured and the fitted overpotential is obtained for the  rate discharge current at low SOC. In this situation, at 1.85% SOC the obtained difference has a value of around
  . This voltage error corresponds to a low capacity value (
 or
or  ), which still can be removed from the battery. Even for a new battery, at
  and at a low mean discharge rate (e.g.
  rate) this means that the SOC system will indicate
  more remaining run time than in the real case (see Eq. 15). In the majority of the cases a very good fit (under
  difference) between the two curves is obtained.
Based on the mathematical implementation of the overpotential described previously, the overpotentials measured at four discharge  -rate currents have been fitted at 5, 25, and
  , respectively. Figure 19 presents the measured and fitted battery overpotential at three different temperatures during discharge at
  rate. In order to guide the eye, the difference between the measured and fitted overpotential at three temperatures and at
  rate as a function of the relative SOC is plotted in Fig. 20. It follows from Fig. 19 and 20 that the maximum difference retrieved at low SOC between the measured and the fitted overpotential is obtained at
  . Accurate overpotential modeling at low SOC is needed because the remaining run time is calculated under this condition. In this situation, at 1.82% SOC the obtained overpotential difference had a value of
  . This overpotential difference corresponds to a low capacity value (
 or
or  ), which still can be removed from the battery. Even for a new battery and at 0.25 discharging
  rate this means that the SOC system will indicate
  more remaining run time than in the real case (see Eq. 15). In the majority of the cases a very good fit (under
  difference) between the two curves is obtained.
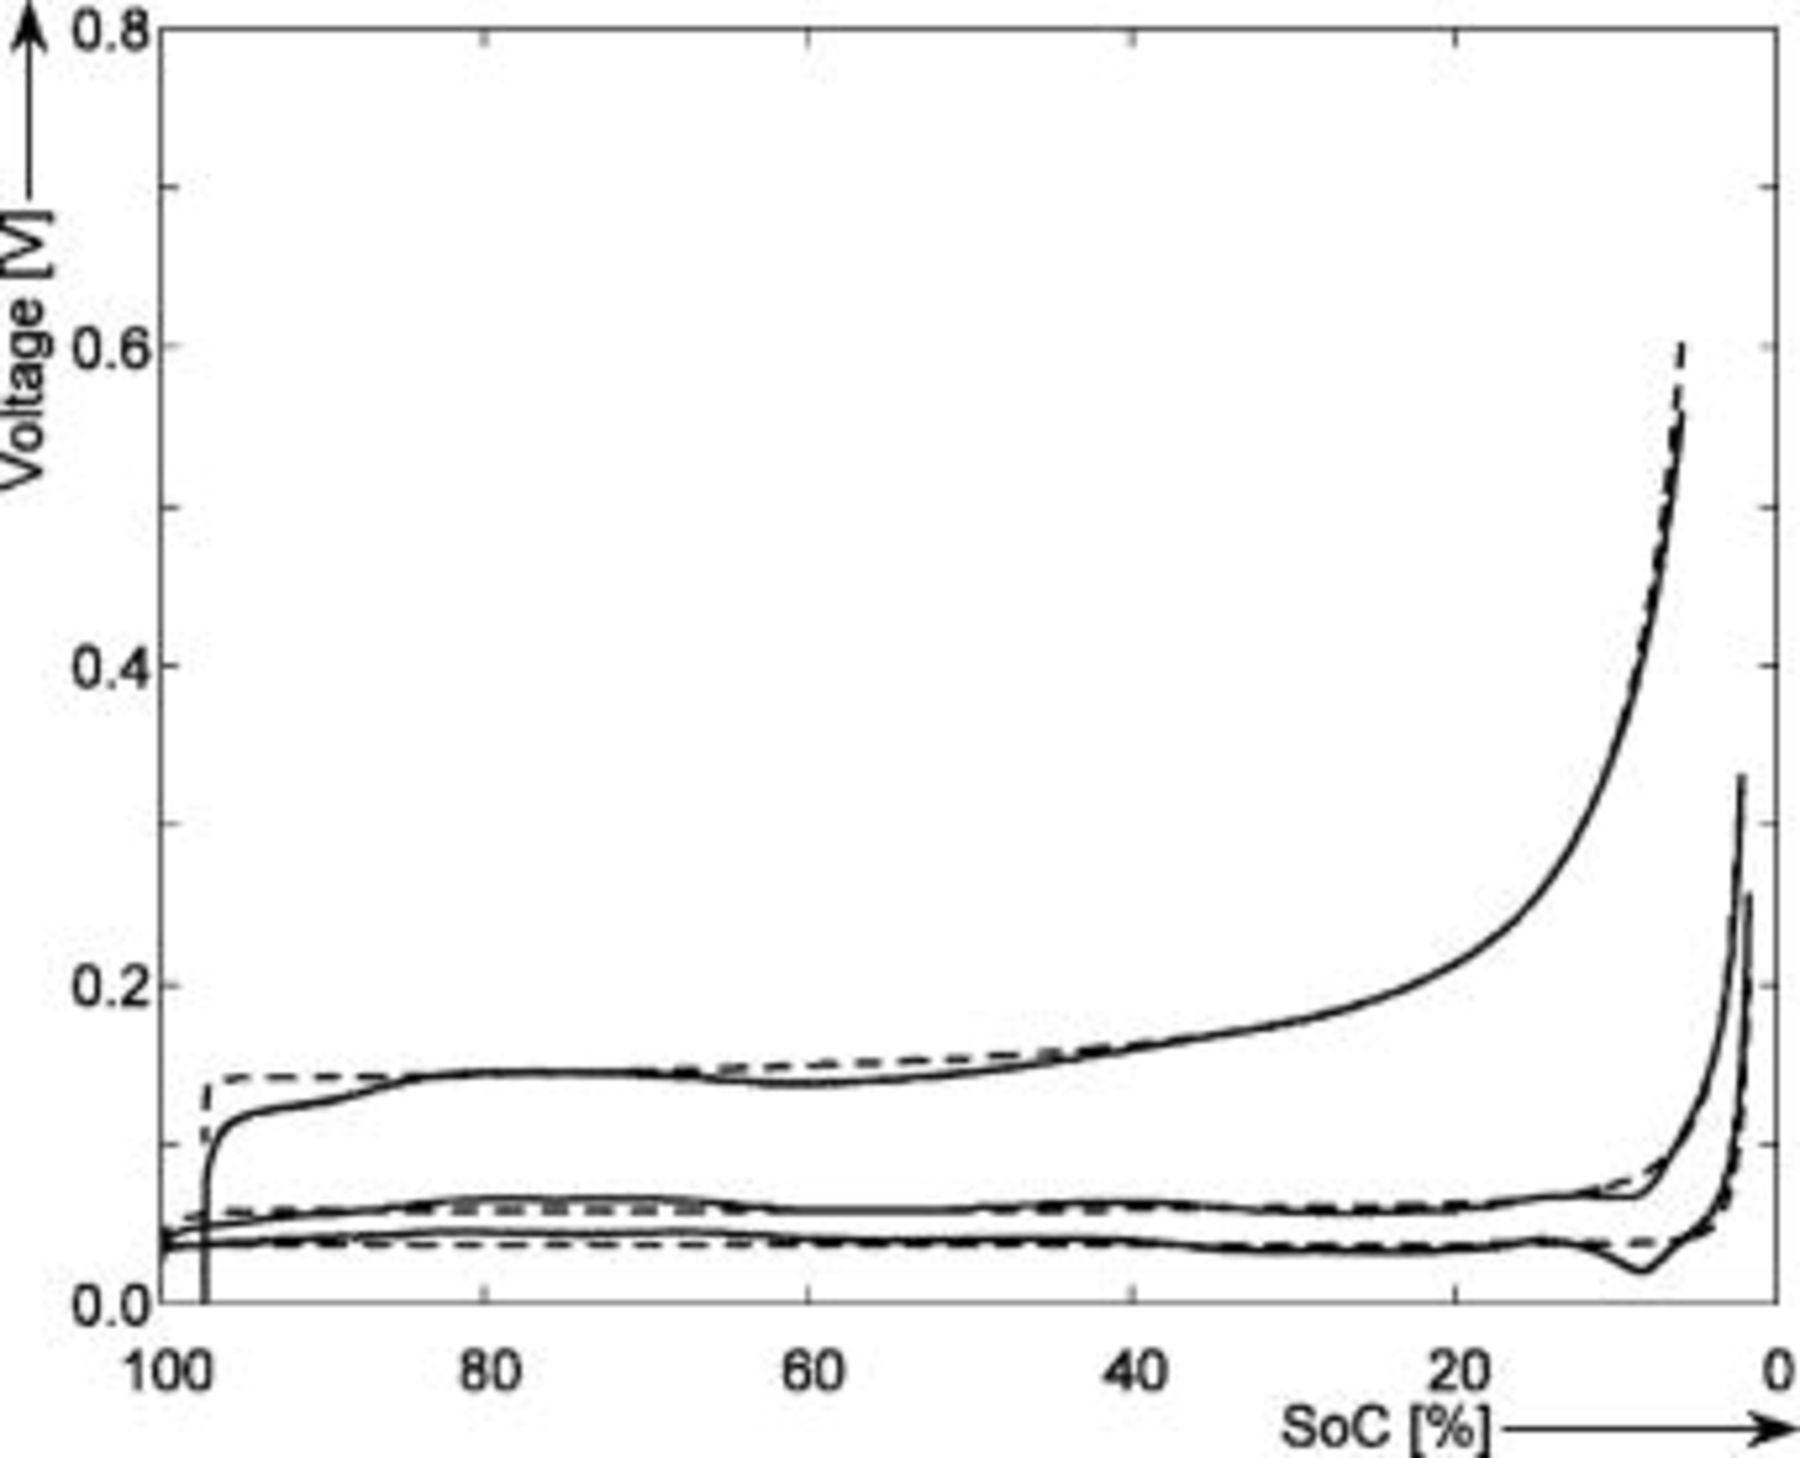


Figure 20. Accuracy of the fitted overpotential curves versus the overpotential measured with the Maccor battery tester at  rate. The horizontal axis shows the SOC (%) normalized to the maximum capacity.
It can be concluded that the produced error by the overpotential implementation will generally provide us enough accuracy in order to achieve a final accuracy of  of the remaining run-time indication. The overpotential model parameters values determined independently from the
  rate and used in the simulations illustrated in Fig. 17, 18, 19 and 20, respectively, are summarized in Table II. Column one gives the symbol of the overpotential model parameters. The values of the overpotential model parameters retrieved at 5, 25, and
  , respectively, are given in columns two, three, and four, respectively. Column five denotes the unit of the overpotential model parameters.
Table II. The battery overpotential model parameter values retrieved at three temperatures.
| Parameter |

|

|

| Unit |
|---|---|---|---|---|

|

|

|

|

|

|
|
|
|

|

|

|

|

|

|

|
|
|
| (V) |

| 1.00 | 1.00 | 1.00 |

|

|

| 1.05 |

|

|

|

|

|

|

|

|

|

|

| (J) |

| 1.00 | 1.00 | 1.00 |

|

| 0.00 |

|

| (s) |

| 1.37 | 1.81 | 3.27 | (1) |

|

|

|

| (A) |
Conclusions
Measurement and modeling methods for the EMF and overpotential functions have been presented for  -ion batteries. These functions are used as input for an accurate SOC charge algorithm, which calculates the SOC in percentage, as well as the remaining run time for portable applications.
Two EMF determination methods have been compared. Out of these, the voltage relaxation method is recommended for the EMF determination. The effects of the temperature and hysteresis on the EMF-SOC curve and the influences on the SOC indication accuracy have been introduced. A mathematical model for the EMF-SOC relationship that also takes the temperature into consideration has been presented.
The main drawback of the EMF method is that it does not provide continuous indication of the SOC. Therefore, the SOC algorithm also uses Coulomb counting and overpotential prediction. As has been shown in this paper, good fitting results of EMF and overpotential functions have been obtained. These results give a prediction of the EMF always better than 1.2% SOC and a prediction of the overpotential always better than 0.9% SOC.
In the near future, adaptive solutions used to improve the SOC indication by including aging and temperature effects and spread in both battery and user behavior is investigated.
University Twente assisted in meeting the publication costs of this article.