
Abstract
The anodic film generated in acid electrolytes on high-purity aluminum shows a porous morphology, formed by the packing of approximately hexagonal cells of alumina, containing a centrally located cylindrical pore. Conversely, during anodizing of an AA2024 T3 alloy, the presence of alloying elements, both in solid solution and as second-phase material, influences the filming behavior, with a less regular film morphology developed above the aluminum alloy matrix, and characteristic morphologies generated above and in the zone of influence of second-phase particles. Further, the anodizing behavior of the alloying elements is determined by the applied potential. In this work, the anodizing behavior of AA2024 T3 commercial alloy in sulfuric acid electrolyte has been characterized. Specifically, phenomena related to the oxidation of the second-phase particles have been separated from those associated with the oxidation of the copper-containing aluminum matrix. This has used electrochemical data obtained under potentiostatic and potentiodynamic conditions for the AA2024 T3 alloy, high-purity aluminum, and model Al–Cu alloys, which have been correlated with detailed examination of plan and sectional views of the anodized substrates.
Export citation and abstract BibTeX RIS
AA2024 T3 aluminum alloy contains mainly copper and magnesium as alloying elements that are present in solid solution within the matrix grains, and in second-phase material which develops during solidification and aging. The θ  and
and 
 phases,1 of dimensions in the micrometer range and above, represent the main constituent particles in the alloy system, with other particles, containing Fe, Mn and Si,1–3 variously present. When the alloy surface is exposed to the ambient atmosphere, an oxide film a few nanometers thick develops that protects the underlying alloy from further oxidation. However, in the presence of moisture or aqueous electrolyte, the relatively thin air-formed film is insufficient to prevent microgalvanic coupling between second-phase material and the adjacent aluminum matrix, and corrosion processes can be initiated.
During anodizing, a long-standing surface finishing treatment for improving the durability of aerospace alloys, alloying elements modify the relatively regular porous anodic film morphology developed on high-purity aluminum. Anodizing of various alloys, with and without second-phase material, has been examined,2, 3 with behavior depending on the bulk alloy composition; further, locally, the anodic oxidation of second-phase particles results in film morphologies that depend on the specific particle and its anodic oxidation rate relative to that of the adjacent matrix. Concerning the behavior of the aluminum alloy matrix, alloying elements with less negative Gibbs free energy per equivalent for oxide formation than aluminum normally enrich at the alloy/film interface by preferential oxidation of aluminum,4–7 and, after a critical enrichment level is attained, oxidation of the alloying element proceeds at the alloy/film interface. Habazaki et al.8 suggested that alloying with transition metals generally generates flaws in barrier-type anodic films. These flaws arise from the generation of oxygen-filled voids within the film that, at sufficient gas pressure, rupture the anodic film; consequent access of the electrolyte to the alloy/film interface and subsequent reanodizing results in healing of the film and the development of local regions of altered morphology. Liu et al.9 studied the anodizing behavior of a model  alloy, prepared by magnetron sputtering, in ammonium pentaborate electrolyte. For this highly alloyed material, magnesium was immediately co-oxidized with aluminum and later, after sufficient enrichment at the alloy/film interface, copper was oxidized. The incorporation of copper ions in the alumina film was associated with oxygen gas generation within film regions close to the alloy/film interface, as observed for model binary alloys of reduced copper content.10
The influence of copper on porous anodic film formation has been studied extensively due to its importance in structural commercial alloys.11–13 Iglesias-Rubianes et al.14 associated the presence of copper species in the anodic oxide with oxygen evolution during anodizing in acid media. Further, cyclic oxidation processes, associated with copper-rich regions at the alloy/film interface, were considered to be responsible for the generation of a porous film morphology with significant lateral porosity, in addition to pores that pass normal to the macroscopic alloy surface.
Here, the role of copper in solid solution and in second-phase material during the anodizing of model and practical aluminum alloys has been examined to understand the contributions to the macroscopic and local filming behavior. An acid anodizing medium, sulfuric acid, has been employed because of its relevance in development of environmentally compliant electrolytes.
Experimental
Anodizing was undertaken on high-purity aluminum (99.99% wt), AA2024 T3 aluminum alloy, and a model  Cu solid solution alloy. Prior to anodizing, individual specimens were degreased in acetone, rinsed in deionized water, and dried in a cold air stream. Degreasing was followed by etching in 10 wt % sodium hydroxide solution at
  for 60 and 30 s for high-purity aluminum and copper-containing alloys, respectively. After etching, smut present on the specimen surface was removed by immersion in 30% nitric acid for 30 s at room temperature. Anodizing was carried out in stirred 0.46 M sulfuric acid and 0.1 M ammonium pentaborate electrolytes, using a three-electrode cell with the specimen as the working electrode, a graphite counter electrode, and a saturated calomel reference electrode. After anodizing, plan views and sections of the substrates were examined using AMRAY 1810 and ZEISS ULTRA 55 scanning electron microscopes, with secondary electron and backscattered electron detectors available. Anodic films, attached to the alloy substrates, were observed by transmission electron microscopy of ultramicrotomed sections using a JEOL JEM-2000FXII. For ultramicrotomy, the specimens were trimmed initially with a glass knife, and final sections, of nominal thickness of 15 nm, were generated with a diamond knife in the usual manner.15
Results
Linear polarization behavior
Linear anodic polarization was performed on individual specimens of high-purity aluminum from the open-circuit potential (OCP) to 40 V (saturated calomel electrode, SCE) in 0.1 M ammonium pentaborate at voltage sweep rates from 3 to 24 V/min. Figure 1 shows the resulting current density vs potential ( ) response; at the commencement of polarization, a rapid increase of the current density was observed, over a few tens of millivolts, that was followed by a steady or plateau region. At increased sweep rates, a current density overshoot was evident prior to achieving the plateau current density; the plateau current density increased approximately linearly with an increase of the sweep rate at a value of
  .
.
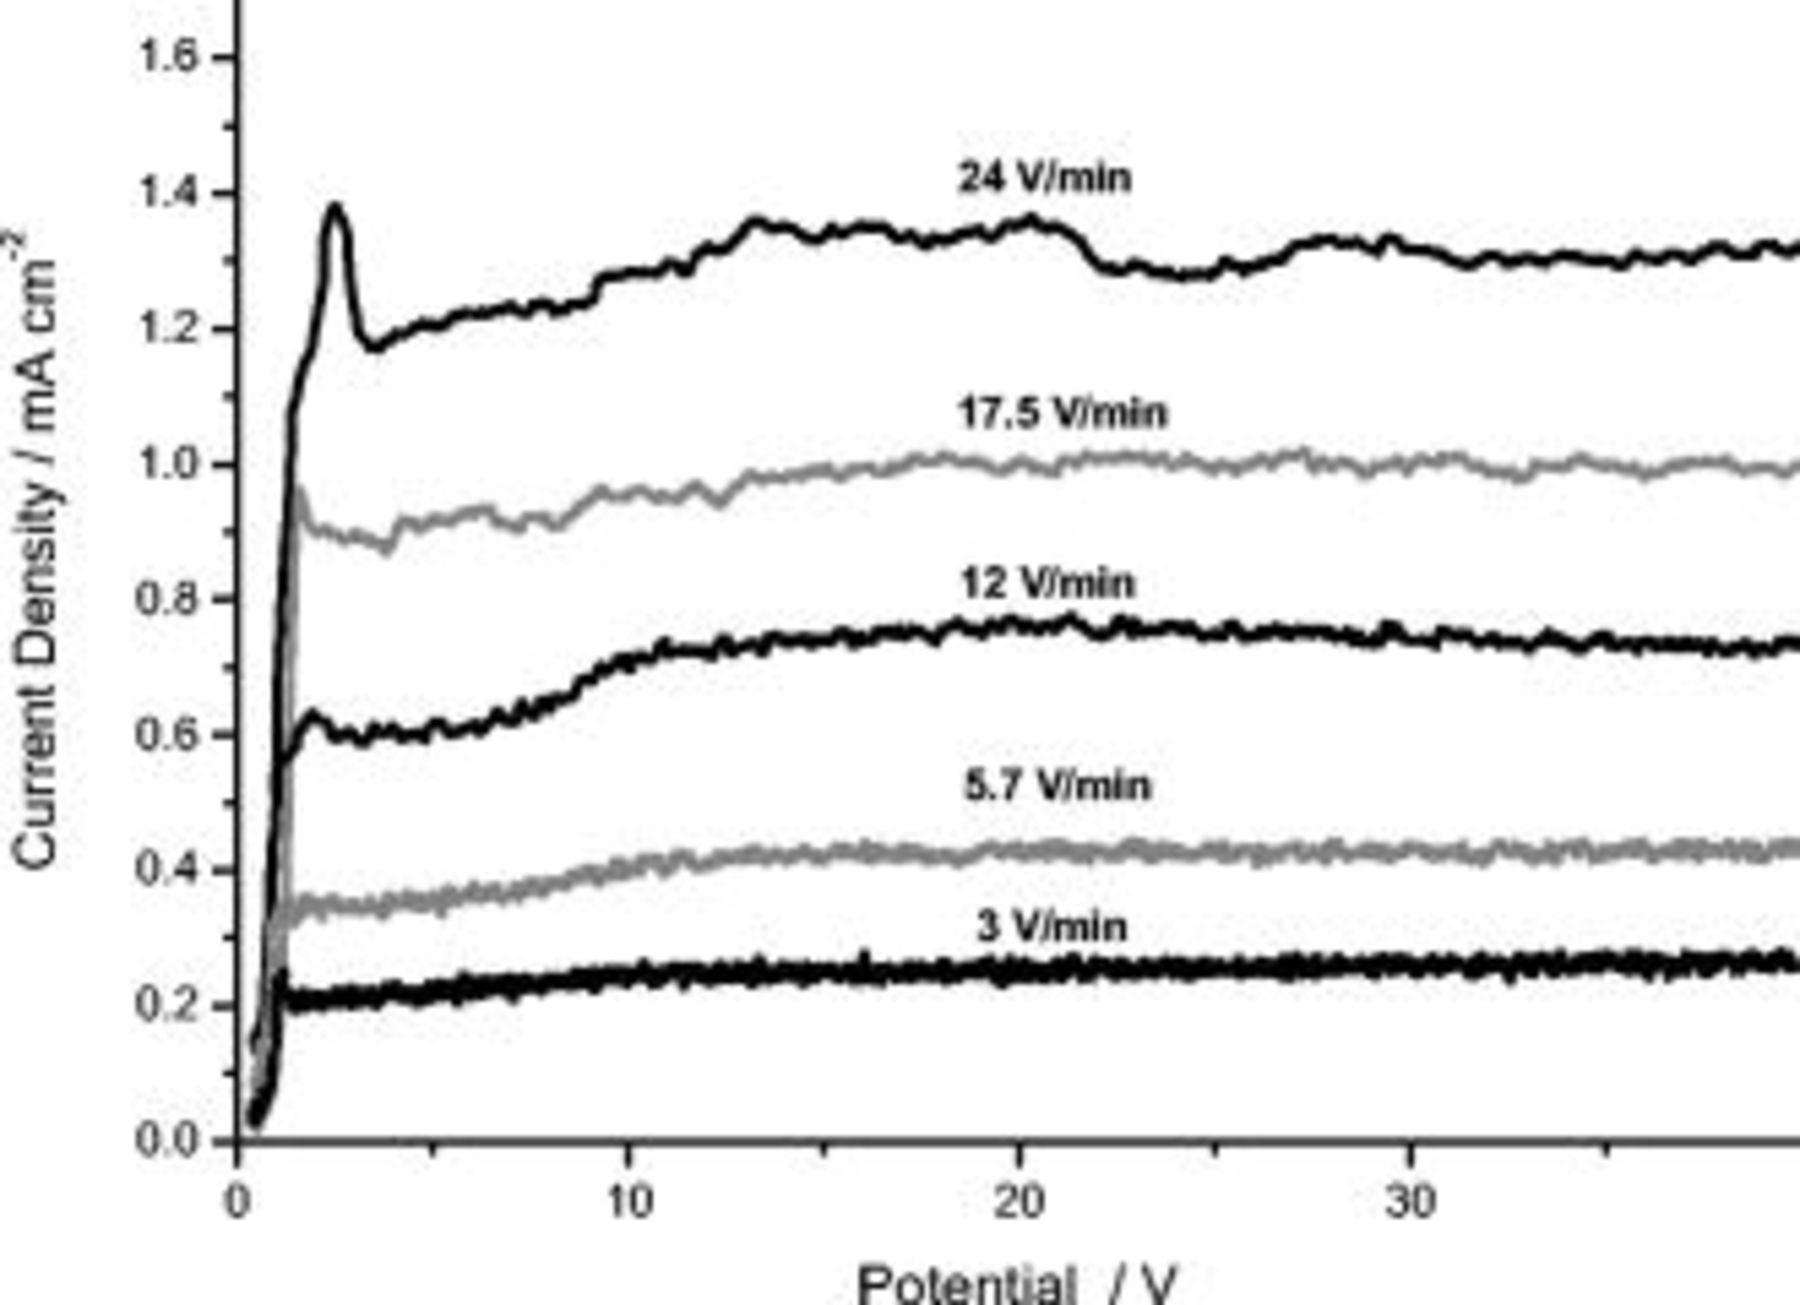
Figure 1.
 behavior during anodizing of high-purity aluminum in 0.1 M ammonium pentaborate electrolyte at room temperature at different sweep rates.
Linear anodic polarization, from the OCP to 14 V (SCE), was also undertaken in 0.46 M sulfuric acid at voltage sweep rates between 0.45 and 14 V/min. The resulting  responses reveal that the current density increased rapidly at the commencement of anodizing over a few tens of millivolts (Fig. 2). Subsequently, the current density remained unchanged in a plateau region that extended over several volts; with a further increase of the potential, the anodic current density increased progressively with time. The plateau current density and its associated potential range, increased with the voltage sweep rate. Conversely, the current density was not significantly influenced by the sweep rate in the region of progressive current rise. As for polarization in the pentaborate electrolyte, the plateau current density increased linearly with the sweep rate, displaying a slope of
  . This increased value for polarization in the acid electrolyte immediately suggests a decreased efficiency, to about 50%, of initial film formation compared with anodizing in near-neutral electrolytes.
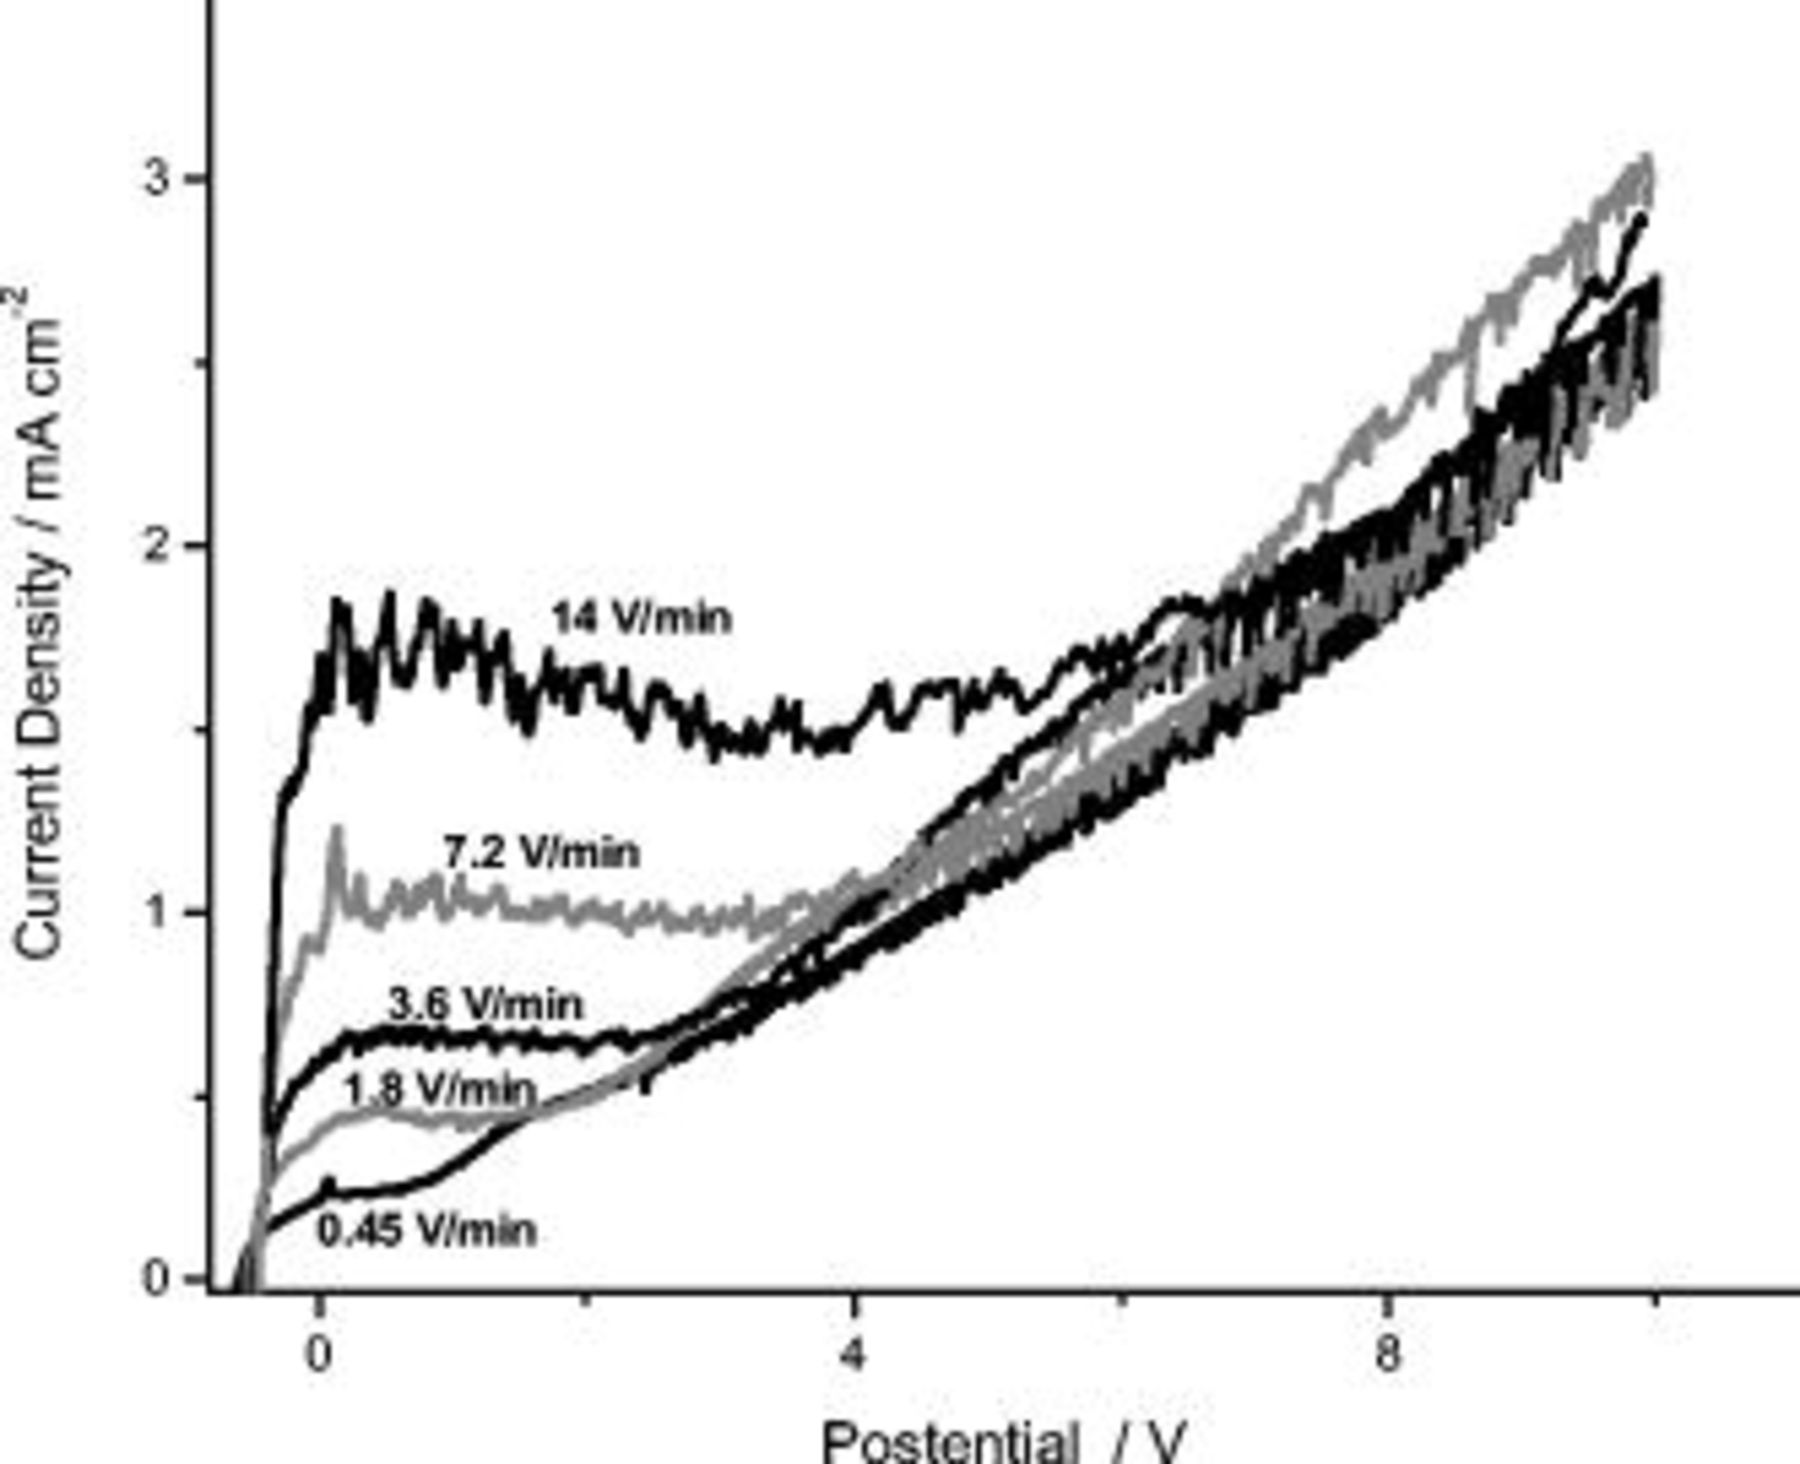
Figure 2.
 behavior during anodizing of high purity aluminum at room temperature in 0.46 M sulfuric acid electrolyte at different sweep rates.
Linear anodic polarization of the AA2024 T3 alloy in sulfuric acid under similar conditions to high-purity aluminum reveals markedly different  responses (Fig. 3). Thus, for the alloy, over the voltage range of polarization, two peaks were observed; the first peak was located in the potential region close to the OCP, with a maximum at about 0 V (SCE), and the second peak was positioned in the potential region between 2.5 and 8 V (SCE). Concerning the first peak, little or no dependence of the shape on the sweep rate was revealed. For the second peak, the potential at which the peak commenced was not affected by the sweep rate, but the peak terminated at increased potentials with an increase of the sweep rate. The charge associated with the second peak was estimated by plotting for each potentiodynamic curve in the current density vs time (
 form) and drawing a straight background line between the point representing the current density measured at 2.5 V (SCE) and the first point after the peak where the current density increased with time (potential). The charge associated with the peaks was then calculated by integrating the difference between the measured
  curve and the background line, between the set points. The charge associated with the peak varied between
  at 0.25 V/min and
  at 5 V/min.
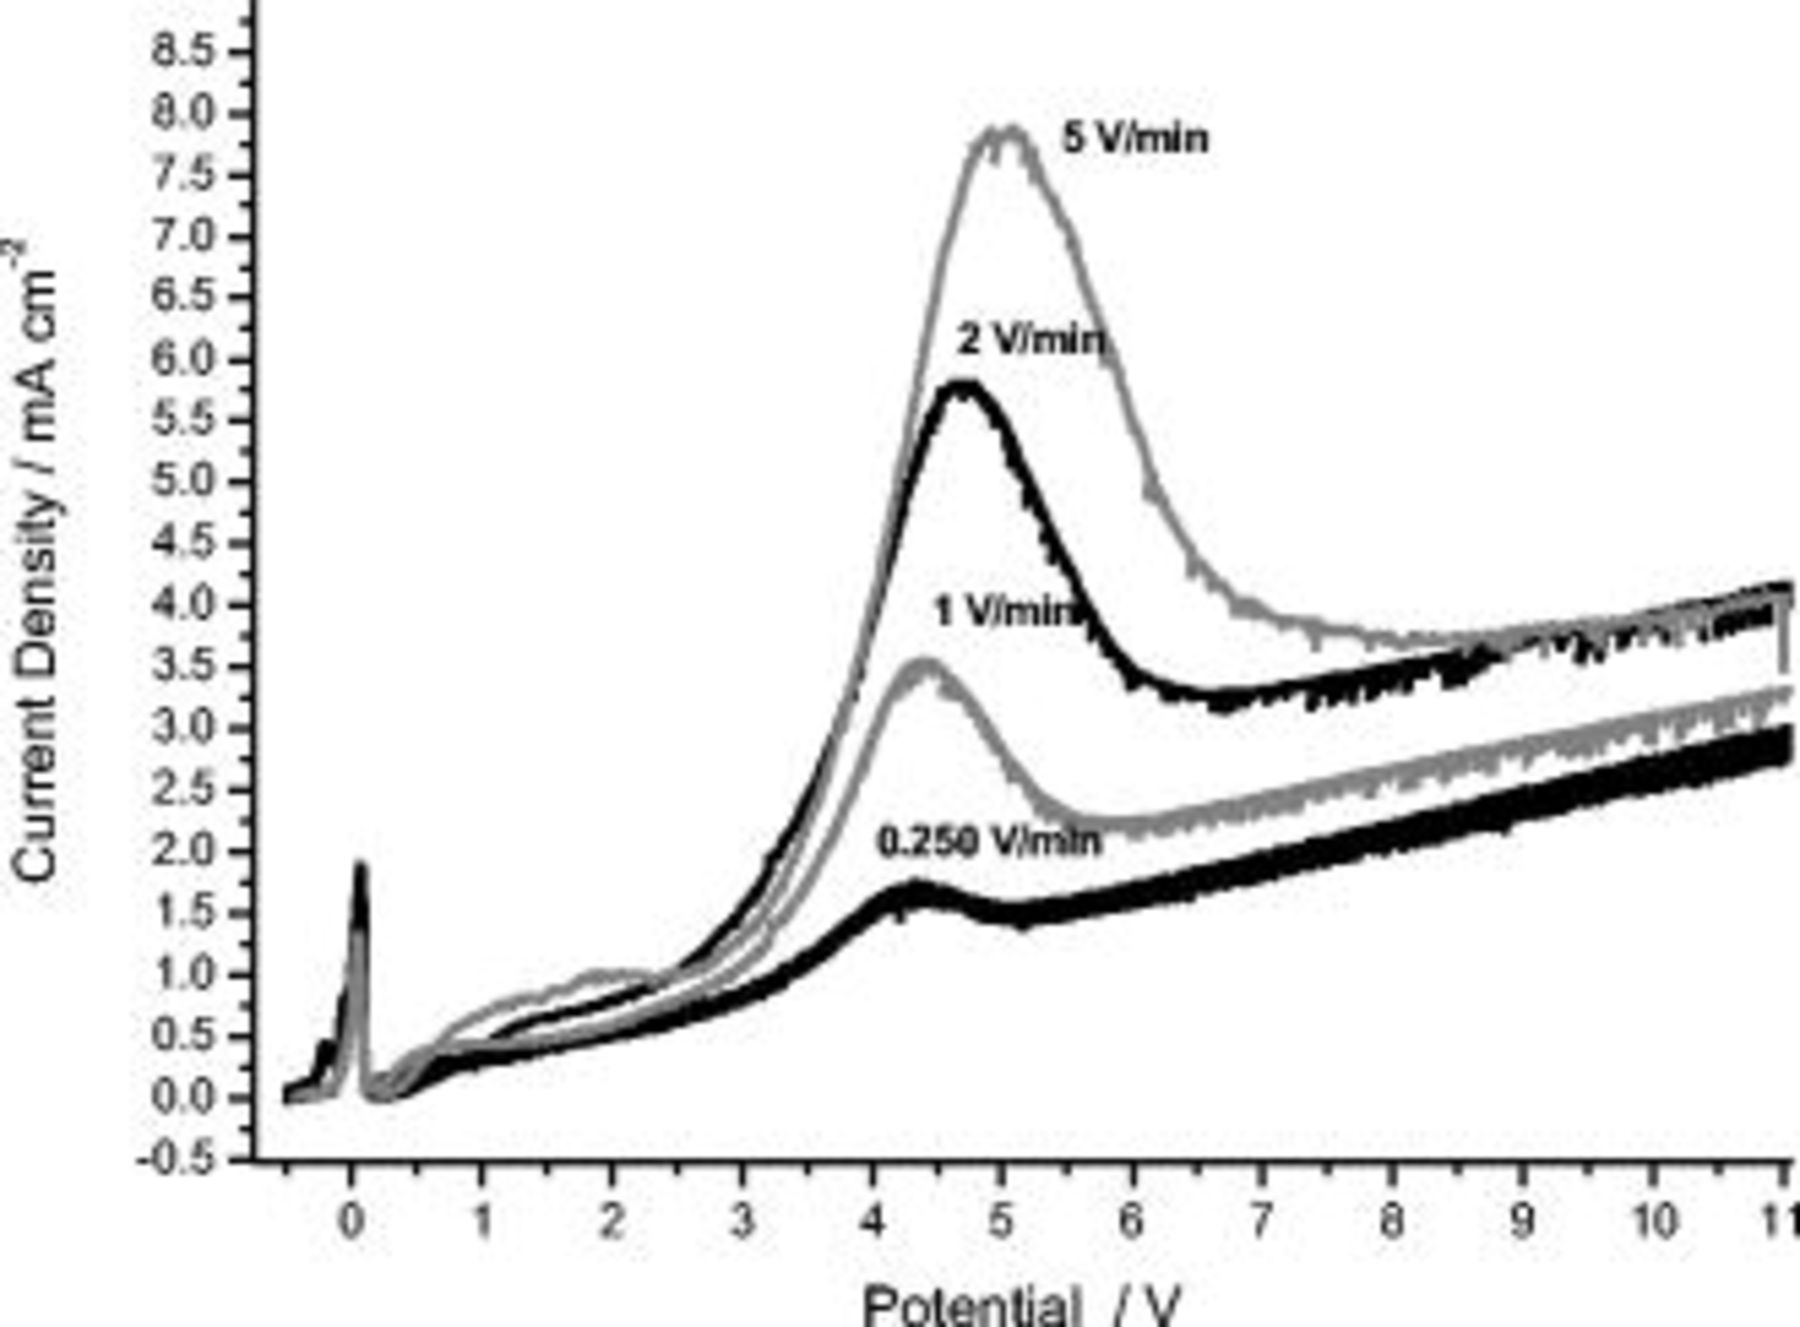
Figure 3.
 behavior during anodizing of the AA2024 T3 alloy at room temperature in 0.46 M sulfuric acid electrolyte at different sweep rates.
Beyond the second peak, an approximately linear dependence of the current density on the applied voltage was evident; the current density also increased with the sweep rate up to 2 V/min. Oxygen evolution from the alloy specimen was observed from the early stages of anodizing, unlike the behavior of high-purity aluminum.
To consider further the possible influence of alloy microstructure on the  response and peaks displayed during polarization of the AA2024 T3 aluminum alloy, individual specimens of the binary Al–Cu 0.5 wt % alloy were polarized under potentiodynamic conditions at a sweep rate of 1 V/min. The typical behavior for the solid solution alloy is displayed in Fig. 4, with the current density increasing rapidly over a few tens of millivolts from the commencement of polarization and, subsequently, remaining unchanged in a plateau that persisted over an extended potential region. Beyond the plateau, the current density increased with potential. Significantly, the current density peaks associated with polarization of the AA2024 T3 aluminum alloy were not displayed for the binary alloy with copper in solid solution.
Figure 4.
 behavior during anodizing of the
  Cu alloy at 1 V/min in 0.46 M sulfuric acid electrolyte at room temperature.
Potentiostatic polarization behavior
To investigate the effect of potential on anodizing under steady conditions, the AA2024 T3 aluminum alloy was anodized at constant potentials in the range 1–12 V (SCE) in 0.46 M sulfuric acid, with the resultant current density/time behavior recorded (Fig. 5). Generally, the responses showed an initial current density surge that was followed by a decrease to a minimum and an increase to a steady or plateau current density. However, differences in the responses were evident for polarization at voltages up to 4 V and at 5 V and above. At potentials up to 4 V, a minimum in the current density was evident during the early transient behavior, and the steady current density was reached rapidly. Conversely, the responses generated during polarization at potentials of 5 V and above did not show such minima, with the current density after the initial surge decreasing gradually to a steady value. At 5 V and above, the duration of the early transient prior to achieving the steady current density was significantly longer than for polarization at reduced potentials. Further, for polarization at potentials of 5 V and above, oscillations in the current density were resolved during the initial transient behavior. More generally, the behavior is typical of anodizing aluminum alloys in acid electrolytes, with the initial surge associated with nonuniform film growth and the steady current density region associated with relatively uniform thickening of the porous anodic film. Additionally, as expected, the steady current density increased with an increase of the anodizing potential.
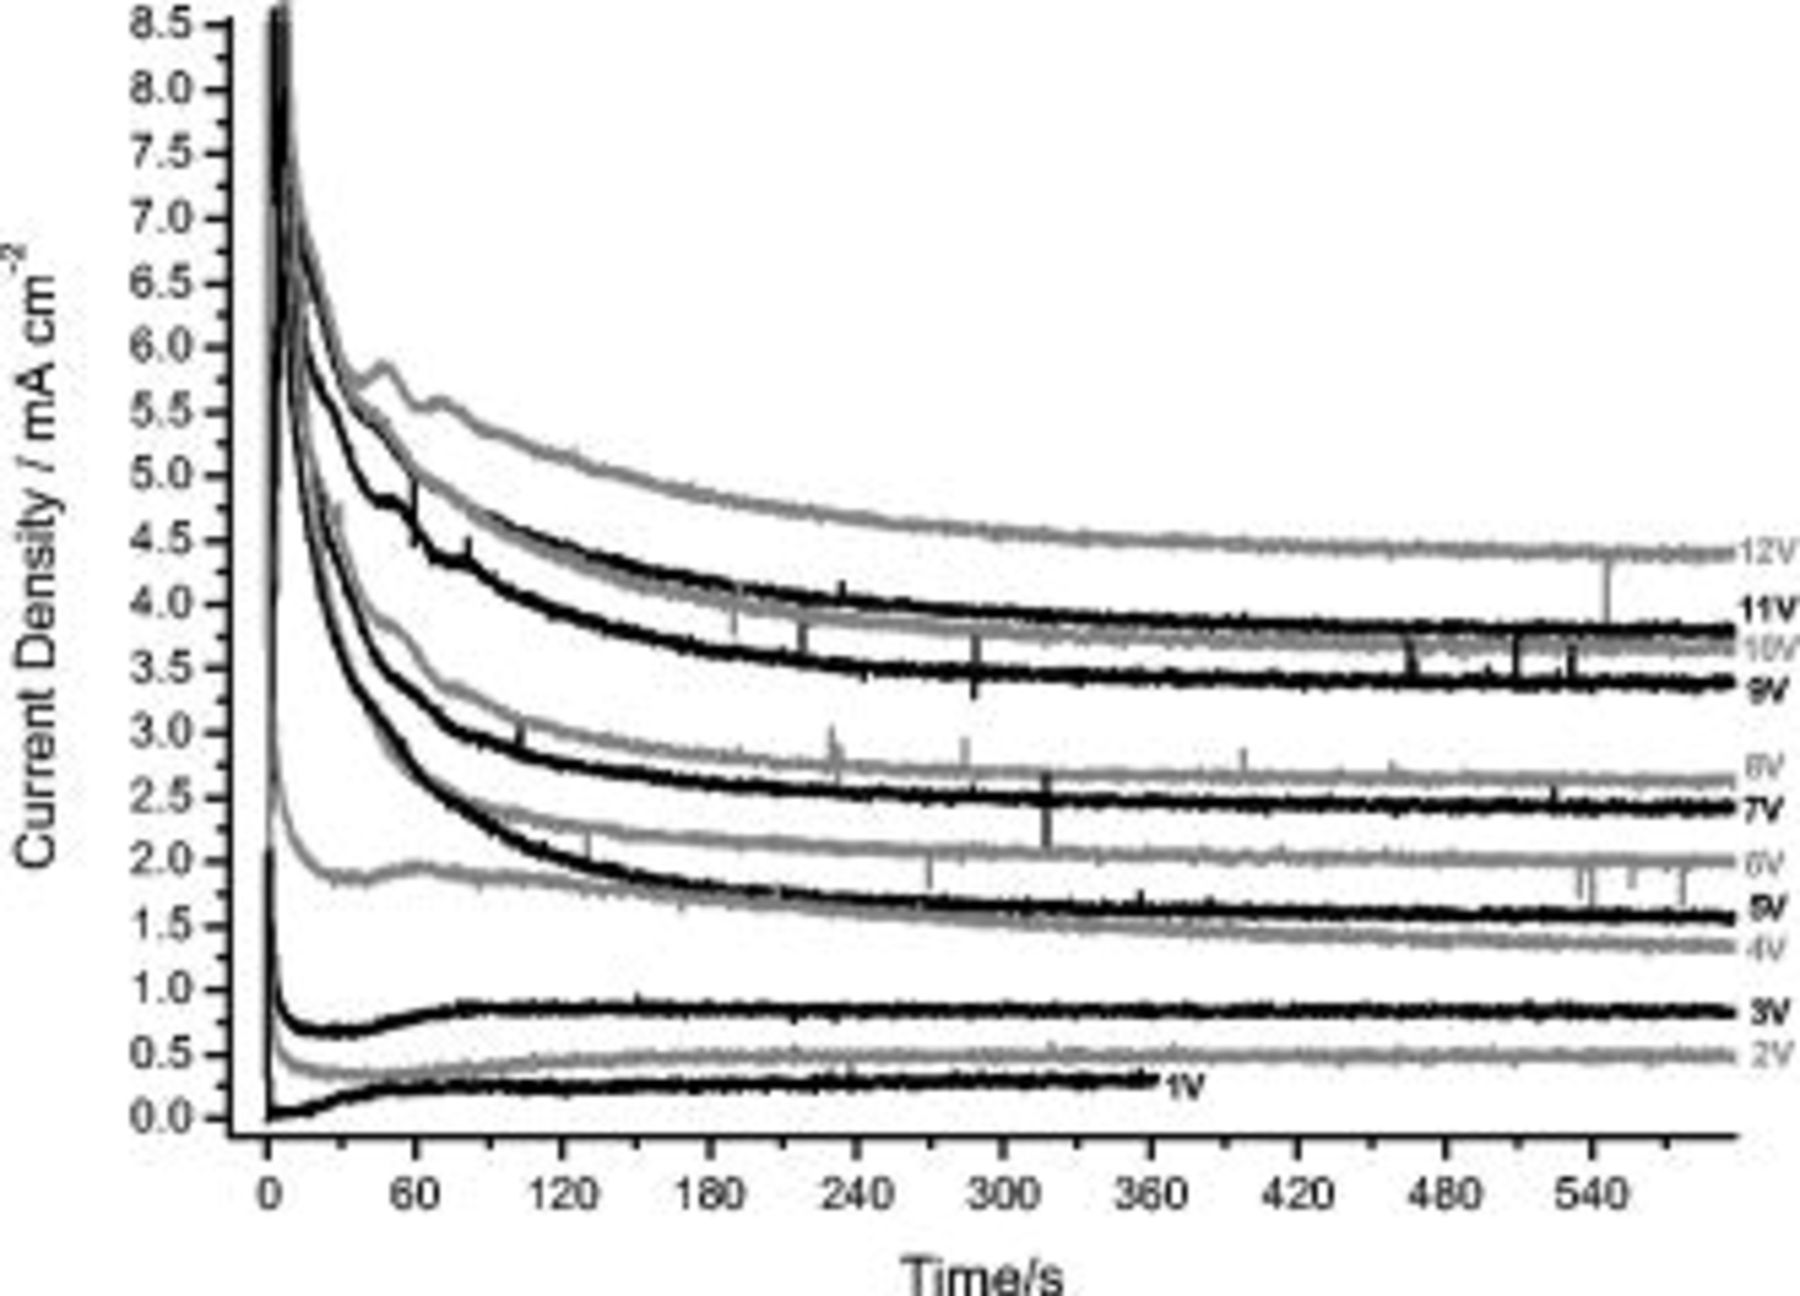
Figure 5.
 behavior during anodizing of the AA2024 T3 alloy in 0.46 M sulfuric acid electrolyte under potentiostatic conditions at potentials between 1 and 12 V (SCE).
The potentiostatic behavior of the binary  at Cu alloy revealed an initial current density surge that was followed by a short transient before the current density achieved a steady value that increased with the applied potential (Fig. 6). The early behavior of the binary alloy is significantly different than that for the AA2024 T3 alloy. For the practical alloy, the duration of the early current transient increased with applied potential whereas, for the model alloy, the duration of the transient decreased with applied potential. Further, no variation in the rate of current density decrease with time immediately after the maximum current density was observed for the model alloy on changing the applied potential. For the AA2024 T3 alloy, an increase of the anodizing potential mainly resulted in a change in the shape of the
  curves in the transition region between 4 and 5 V (SCE).
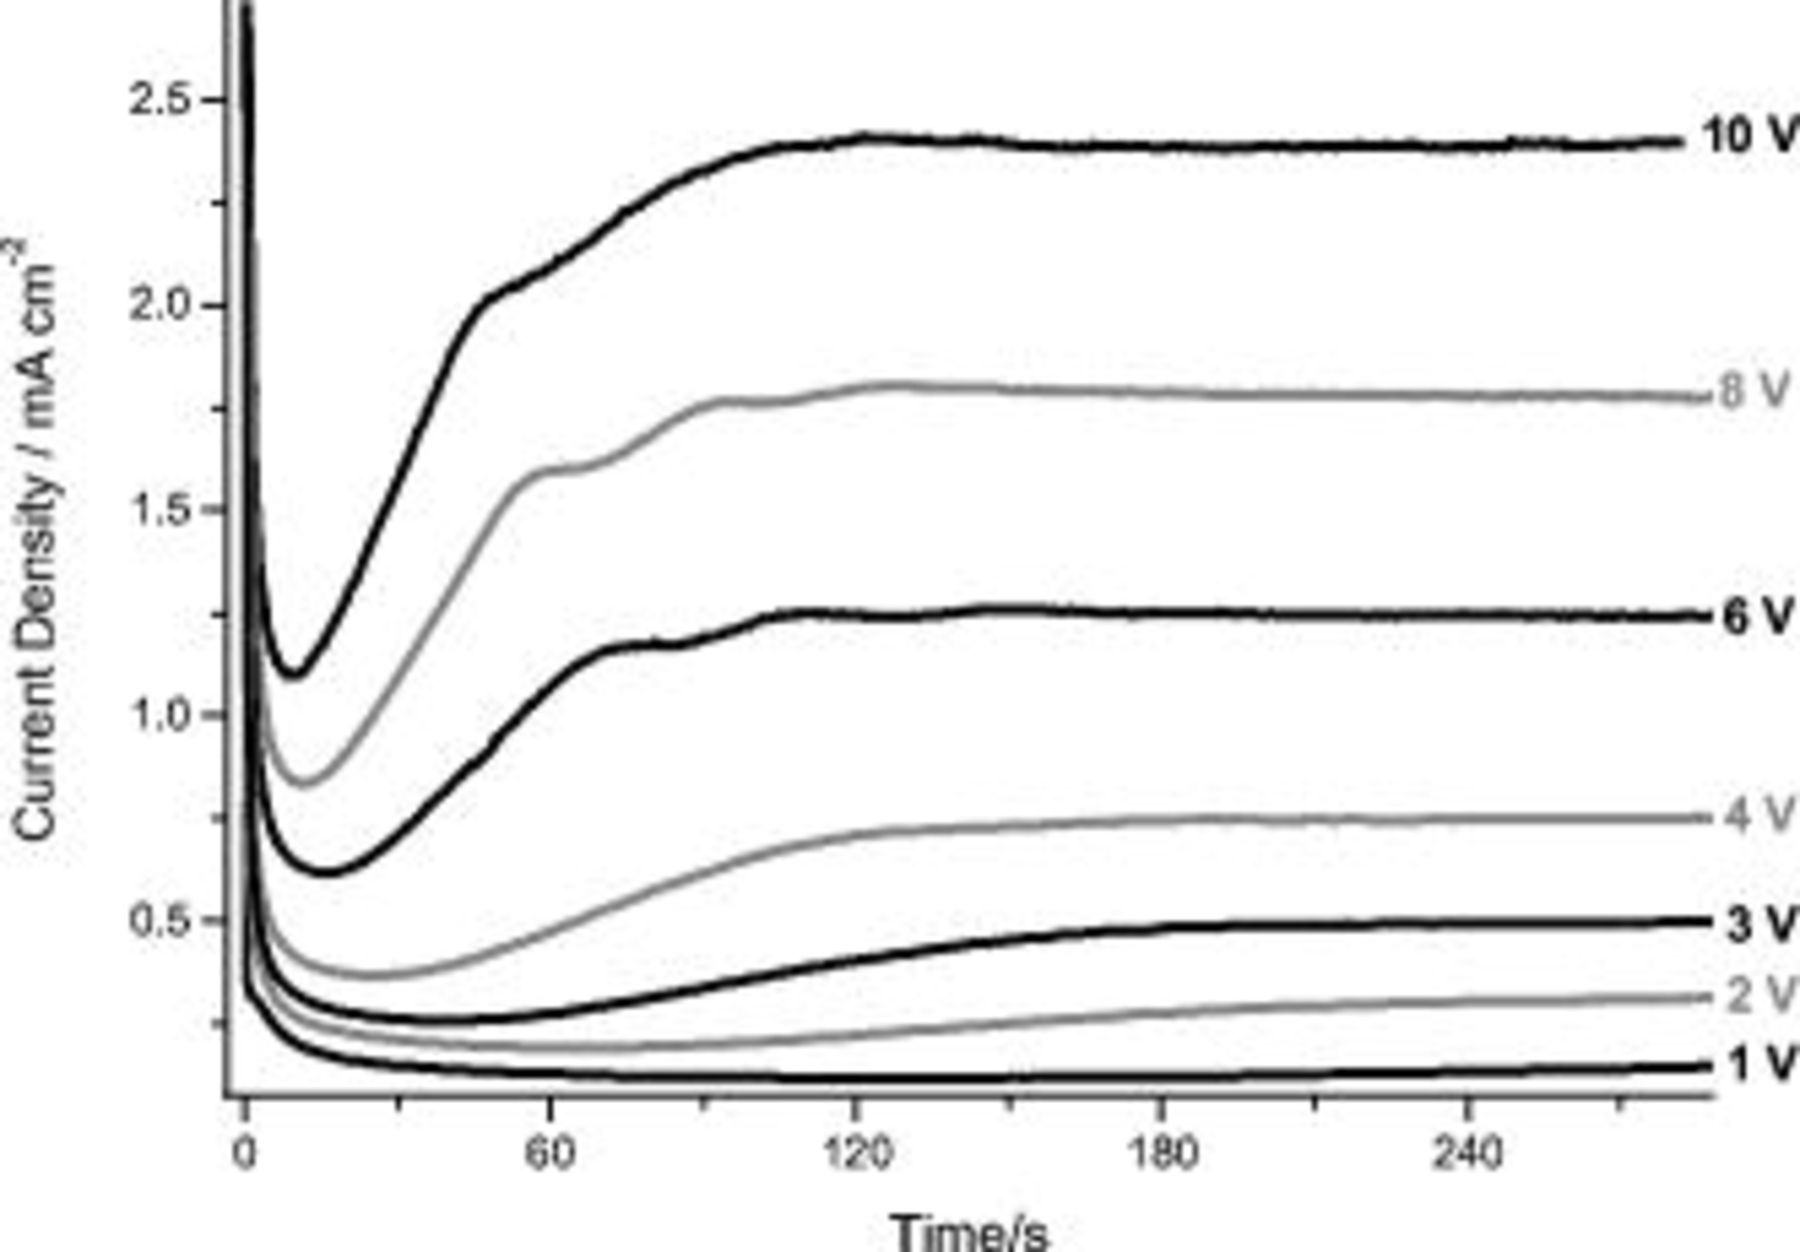
Figure 6.
 behavior during anodizing of the Al-
 Cu alloy in 0.46 M sulfuric acid electrolyte at potentials between 1 and 10 V (SCE).
Scanning electron microscopy
To gain insight into the filming behavior of the macroscopic surface and local behavior at second-phase particles, an individual AA2024 T3 aluminum alloy was anodically polarized to selected potentials at a sweep rate of 1 V/min from the OCP to 12 V (SCE). A representative area of interest was marked on the initially etched and desmutted alloy surface and then observed by scanning electron microscopy after subsequent polarization to 0.2, 1.5, 6, and 12 V (SCE) (Fig. 7).
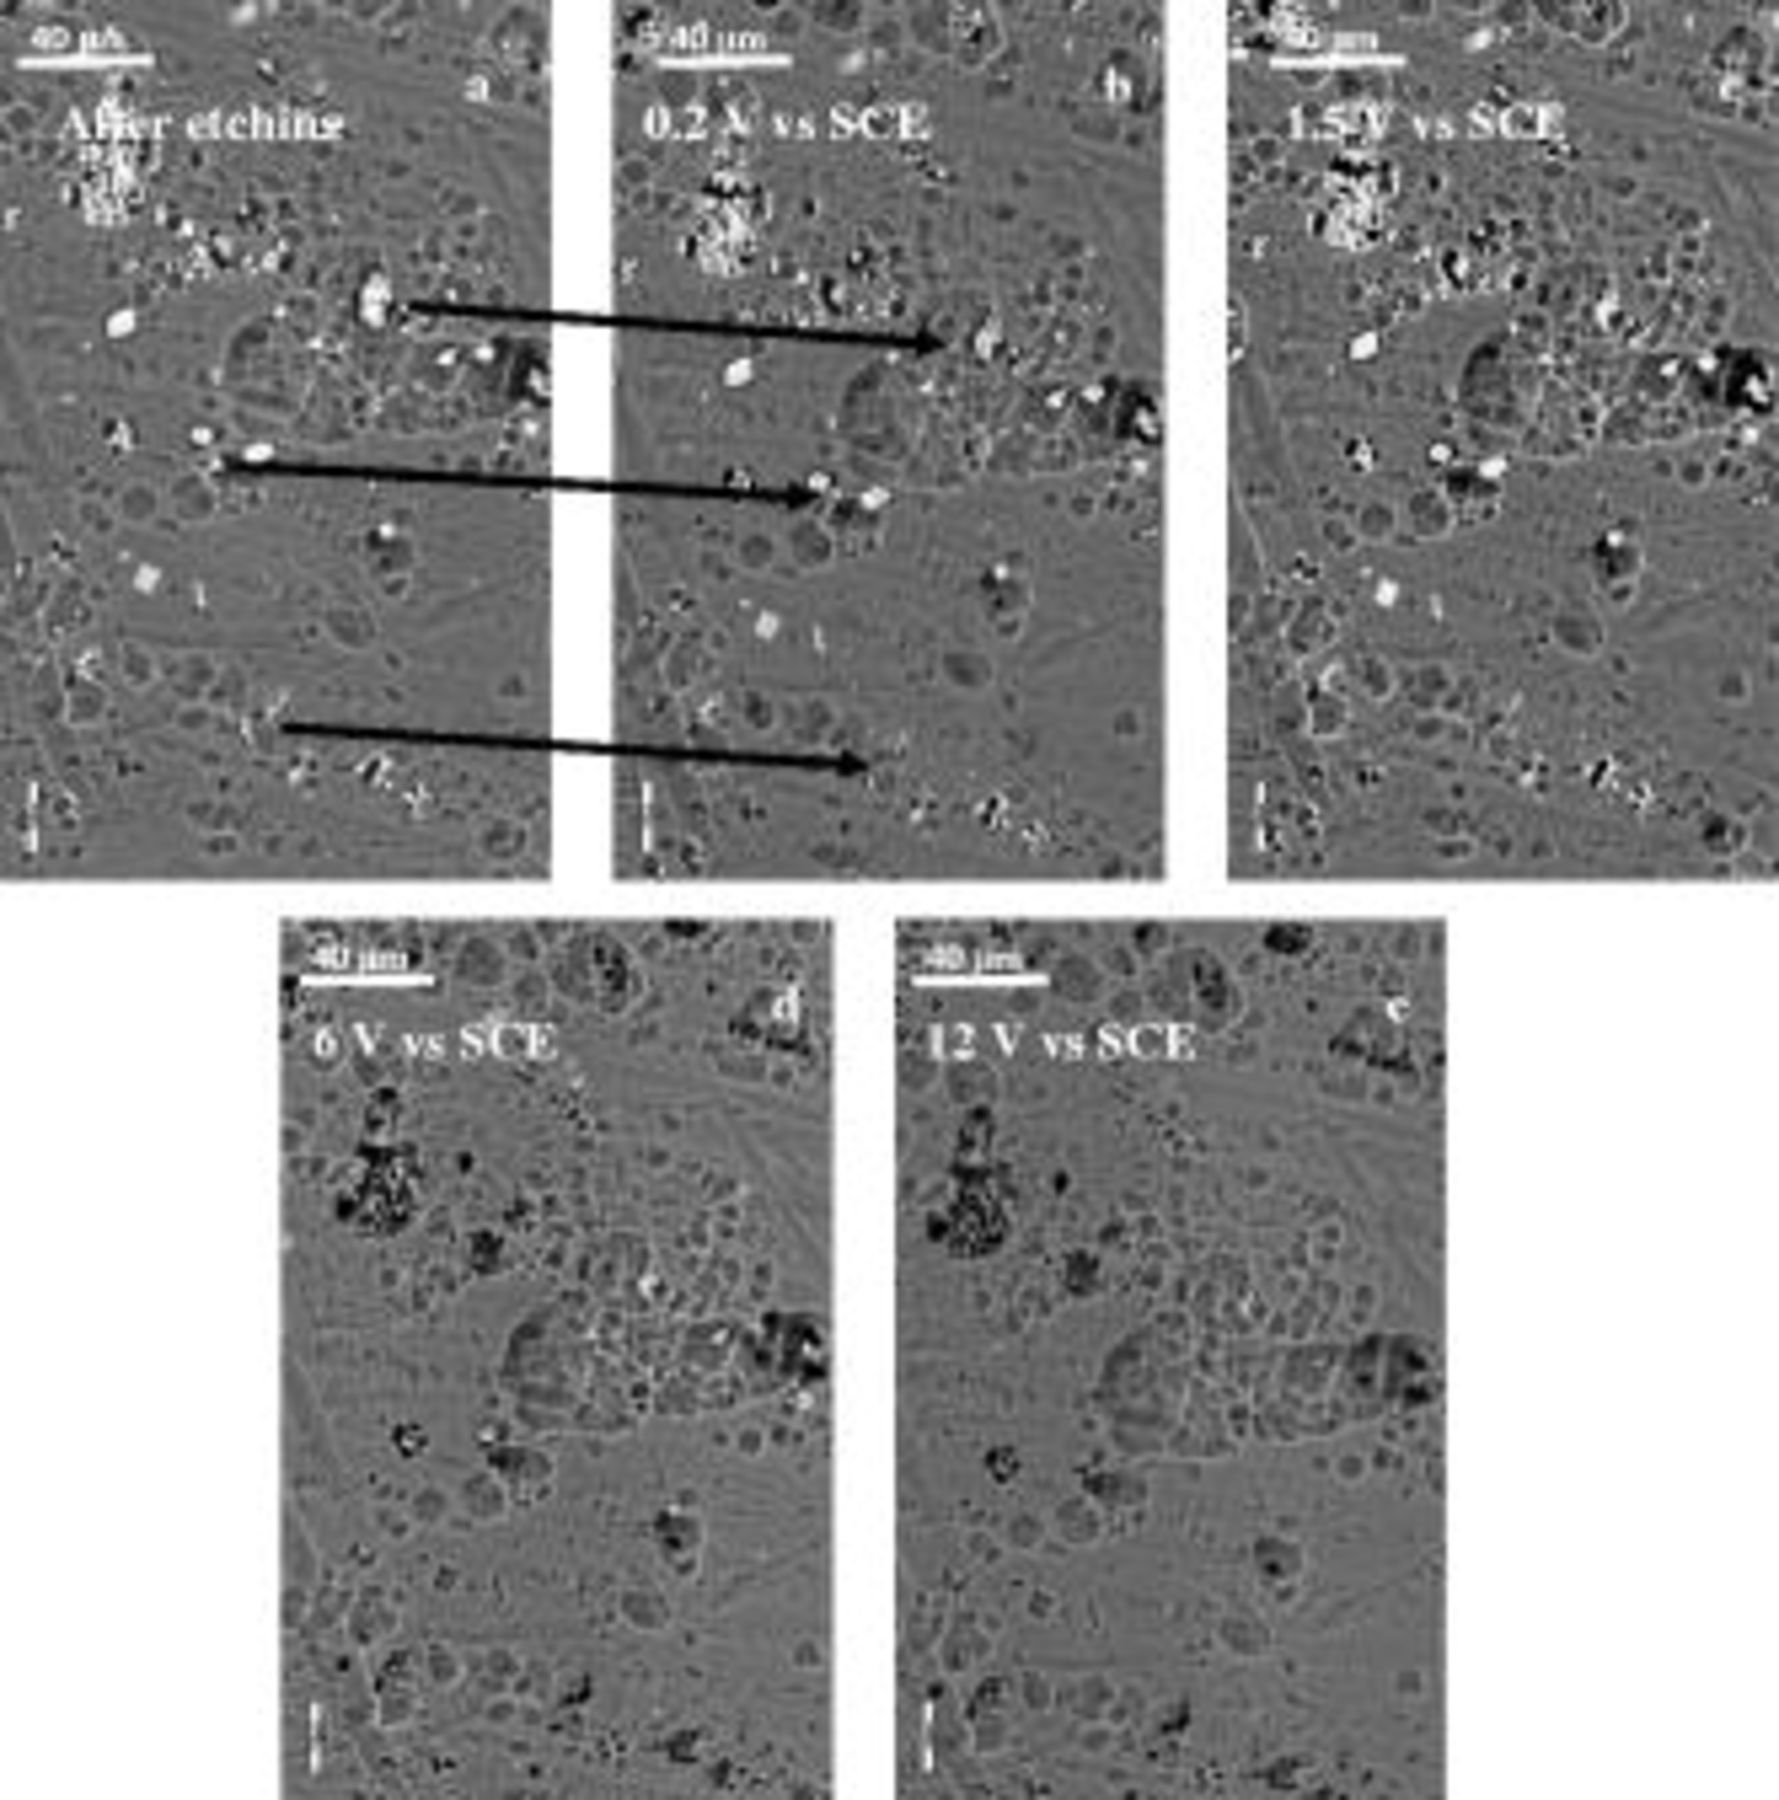
Figure 7. Scanning electron micrographs of the etched and desmutted AA2024 T3 alloy surface after anodizing under potentiodynamic condition from 0 V vs OCP to 12 V vs SCE in 0.46 M sulfuric acid electrolyte at room temperature: (a) etched and desmutted alloy, (b) after polarization to 0.2 V, (c) after polarization to 1.5 V, (d) after polarization to 6 V, and (e) after polarization to 12 V.
The etched surface revealed the typical scalloped appearance over the macroscopic alloy surface (Fig. 7a): within the field of view, various second-phase particles were also displayed. The second-phase particles covered approximately 1.3% of the total alloy surface. After the first step of polarization to 0.2 V (SCE), the majority of the second-phase particles appeared unchanged at a relatively low magnification (Fig. 7b), although cavities were generated close to groupings of second-phase particles. Further scrutiny revealed that some particles had reduced in size or were no longer evident, as shown by the arrows in Fig. 7. Between 0.2 and 1.5 V (SCE), the remaining particles appeared largely unchanged but, at 6 V, most of the particles were no longer evident (Fig. 7c and 7d, respectively). At 12 V (SCE), the second-phase particles were completely oxidized or removed (Fig. 7e). No other significant effects of the applied potential on the overall surface appearance were evident.
Selected AA2024 T3 alloy specimens were also examined by scanning electron microscopy after anodizing at different constant potentials in the range 1–6 V. From Fig. 8, it is evident that, after anodizing at low potentials, the distribution of second-phase particles remained relatively unchanged, covering approximately 1.5% of the alloy surface; however, for anodizing at increased potentials, the second-phase particles have largely disappeared. Thus, at a relatively low magnification, the majority of the second-phase particles remained essentially unchanged for anodizing at potentials below 2 V (Fig. 8a and 8b), although cavities similar to those observed under potentiodynamic conditions were revealed. At 3 V (SCE), the number and dimension of the cavities increased (Fig. 8c), indicating zones of increasing anodic activity, although the majority of the second-phase particles remained on the alloy surface. At 4 V and above, no second-phase particles were revealed after an anodizing duration of 600 s (Fig. 8d, 8e and 8f). The macroscopic appearance of the alloy surface was not significantly modified by the anodizing conditions.
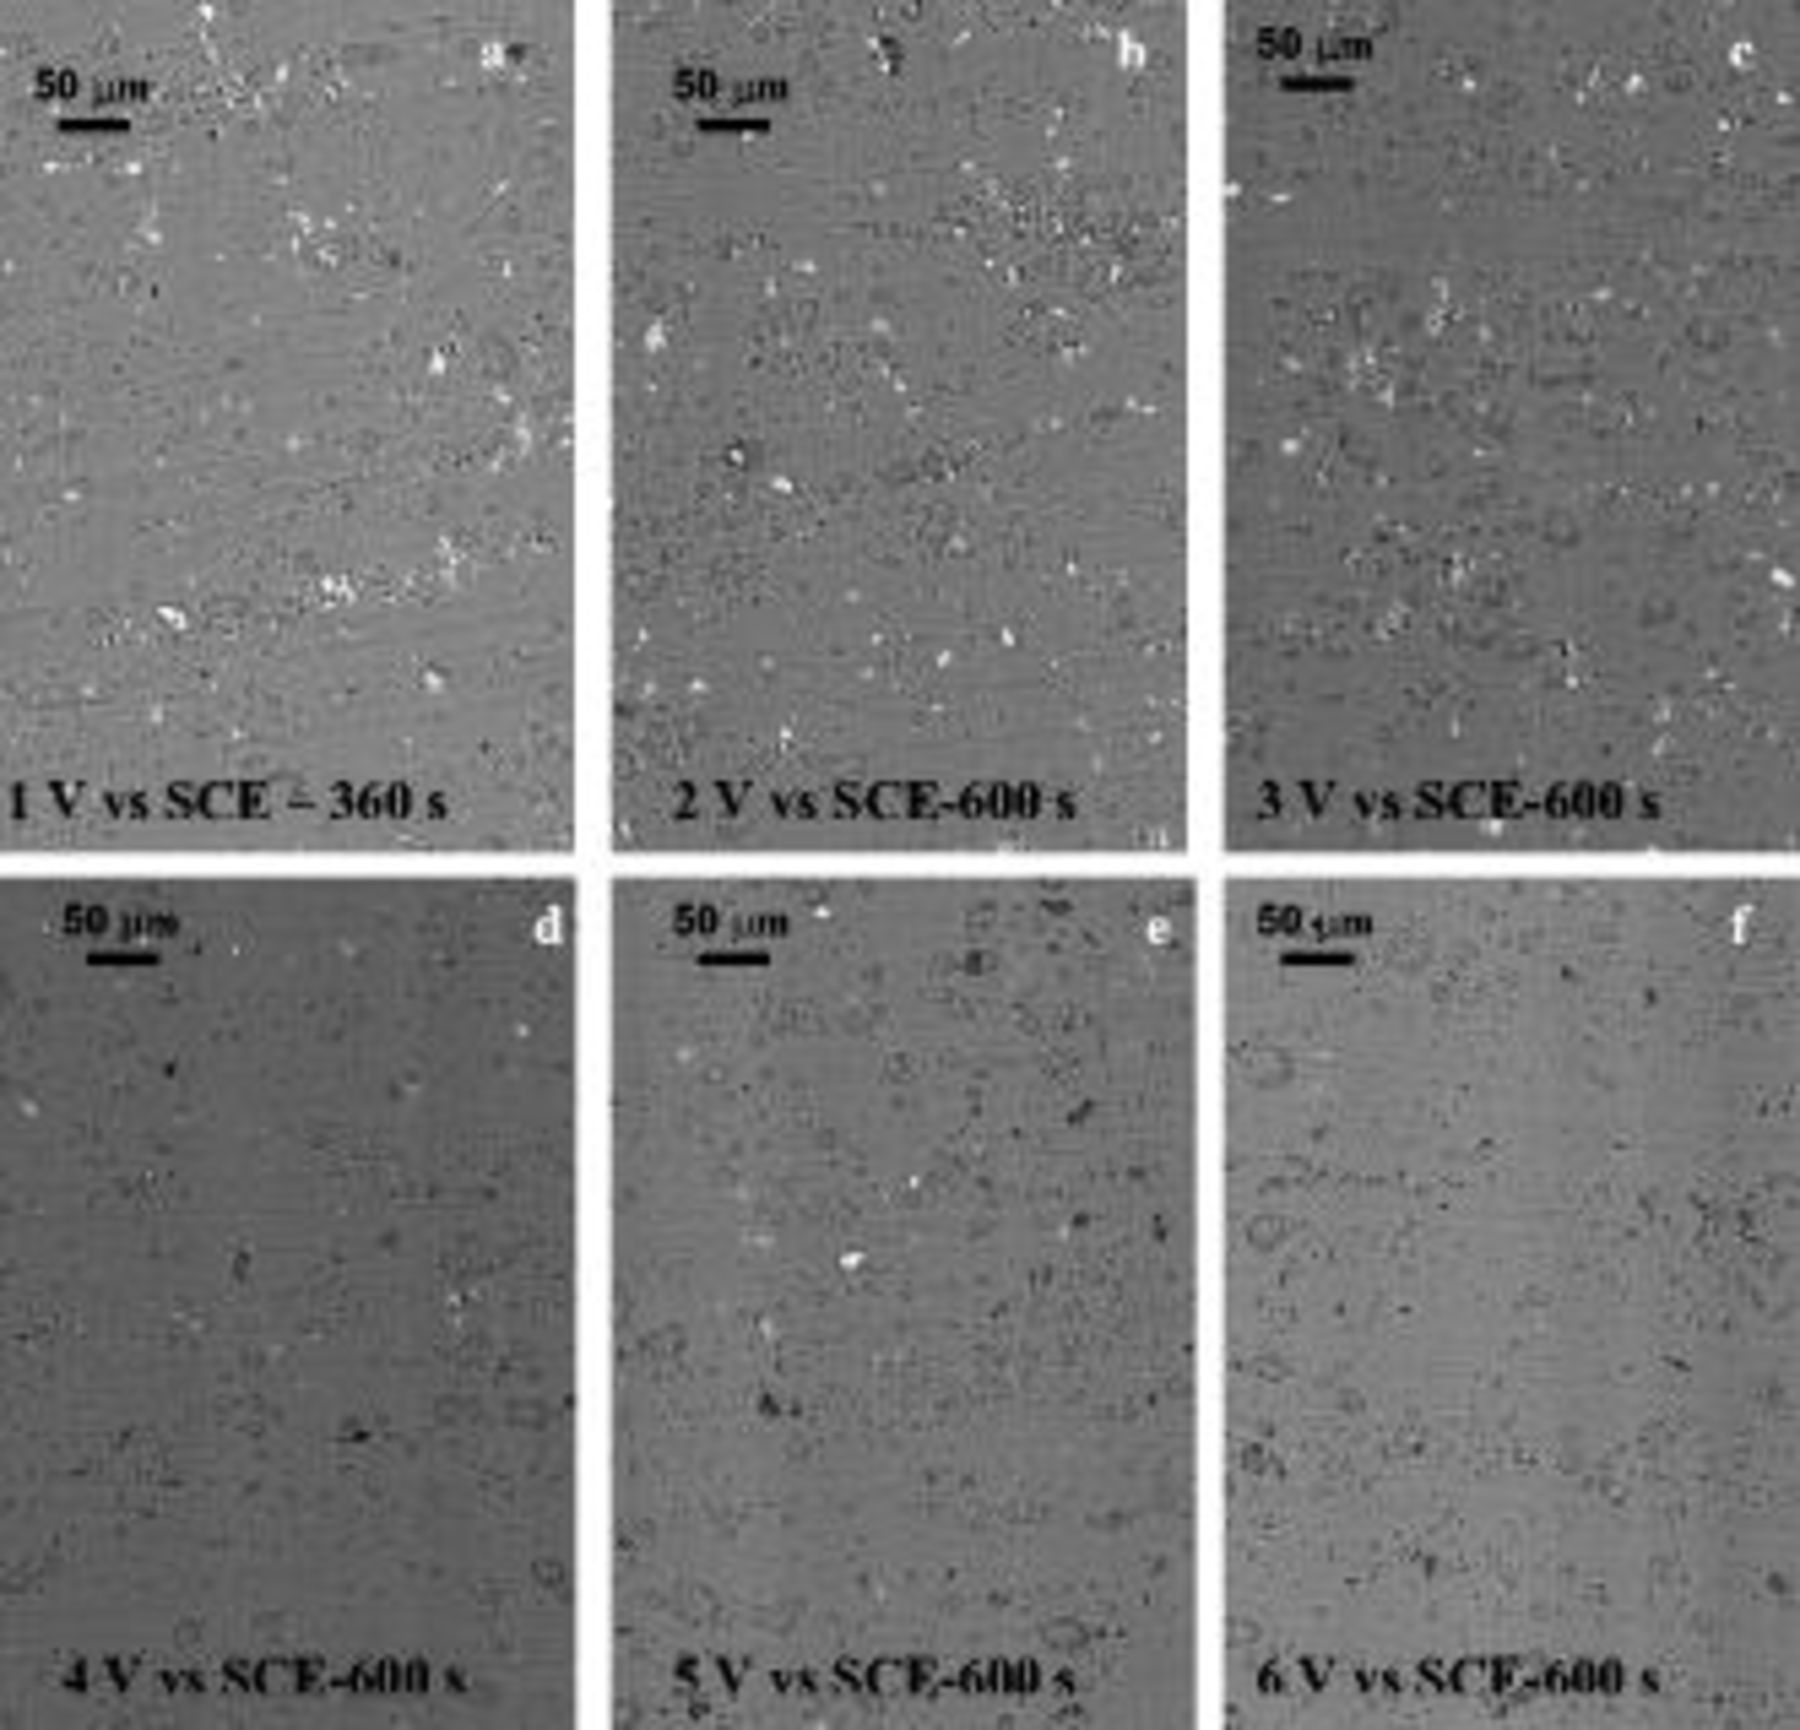
Figure 8. Scanning electron micrographs of the surface of AA2024 T3 alloy after anodizing under potentiostatic conditions in 0.46 M sulfuric acid electrolyte at room temperature at different voltages: (a) at 1 V for 360 s, (b) at 2 V for 600 s, (c) at 3 V for 600 s, (d) at 4 V for 600 s, (e) at 5 V for 600 s, and (f) at 6 V for 600 s.
Following the previous experiment, selected specimens were examined by high-resolution scanning electron microscopy with the surface of the etched and desmutted specimen shown in Fig. 9a. Figure 9b displays the surface of a similar specimen after anodizing under potentiodynamic conditions at a sweep rate of 1 V/min from the OCP to 0.2 V (SCE). The micrograph confirms that anodizing generated a relatively small number of cavities in the alloy surface, indicated by the arrows.

Figure 9. Scanning electron micrographs of the AA2024 T3 alloy surface: (a) after etching and desmutting, (b) after (a) with subsequent potentiodynamic anodizing from the OCP to 0.2 V (SCE) in 0.46 M sulfuric acid electrolyte.
Observation of the cavities at increased magnification (Fig. 10) disclosed regions where groups of second-phase particles of different compositions are located. After anodizing to 0.2 V (SCE), specific particles appear to be preferentially dissolved. Energy-dispersive X-ray analysis (EDX) of the remaining particles revealed Al:Cu ratios close to 1, and the presence of negligible yields of magnesium, suggesting that the cavities were generated by preferential dissolution of particles of high magnesium content ( phase), enabled by the high solubility of magnesium oxide in the acid electrolyte. The high anodic activity of the
  phase at reduced potential was also indicated in a work by Liu et al. , where a model
  phase, prepared by magnetron sputtering, was anodized in dilute sodium hydroxide solution.7
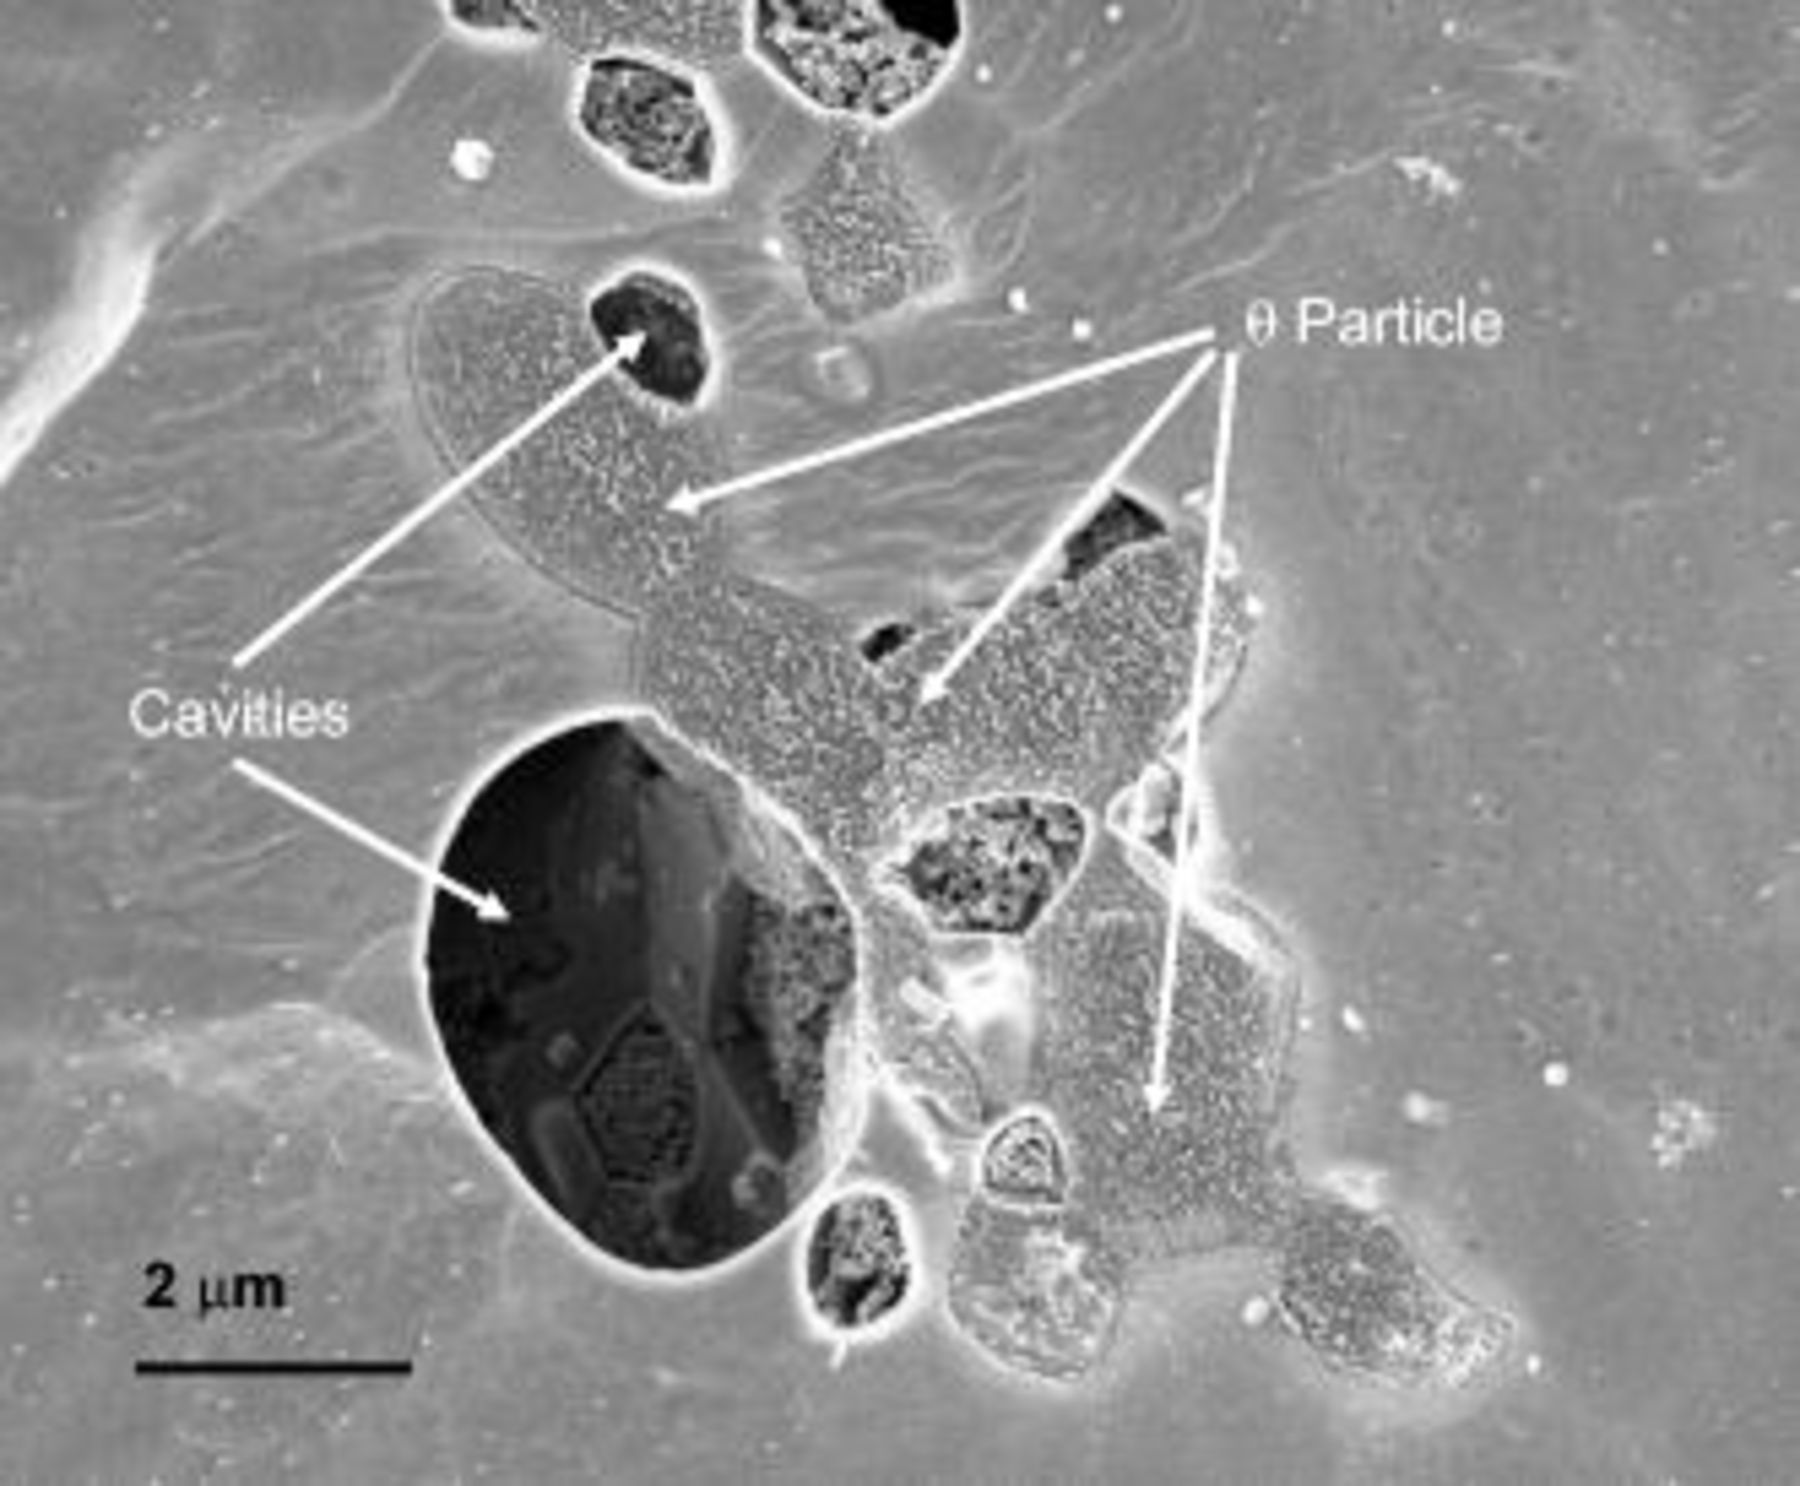
Figure 10. Scanning electron micrographs of the alloy surface after potentiodynamic anodizing from the OCP to 0.2 V (SCE) in 0.46 M sulfuric acid electrolyte .
To investigate the behavior of the second-phase particles with low magnesium (primarily θ phase), two specimens were anodized for a constant charge of  at 2 and 8 V (SCE), respectively, and examined in sections by scanning electron microscopy. Anodizing at 2 V (SCE) resulted in the growth of about 120 nm of anodic oxide above the aluminum matrix, with a comparatively reduced effect on the second-phase material. In the cross section of Fig. 11 an unoxidized θ phase particle is shown with the surrounding alloy matrix; the scanning electron microscope image of Fig. 11a, acquired by secondary electron detector, discloses the relatively thick oxide generated above the alloy matrix but no oxide above the θ particle. The IN LENS detector (Fig. 11b) also revealed the presence of the copper-rich layer at the metal/film interface, with some incorporation of copper into the anodic film. Conversely, anodizing at 8 V (SCE) for the same charge passed (Fig. 12), resulted in the growth of only 50 nm of oxide above the macroscopic aluminum surface, due to the preferential oxidation of the second-phase material.
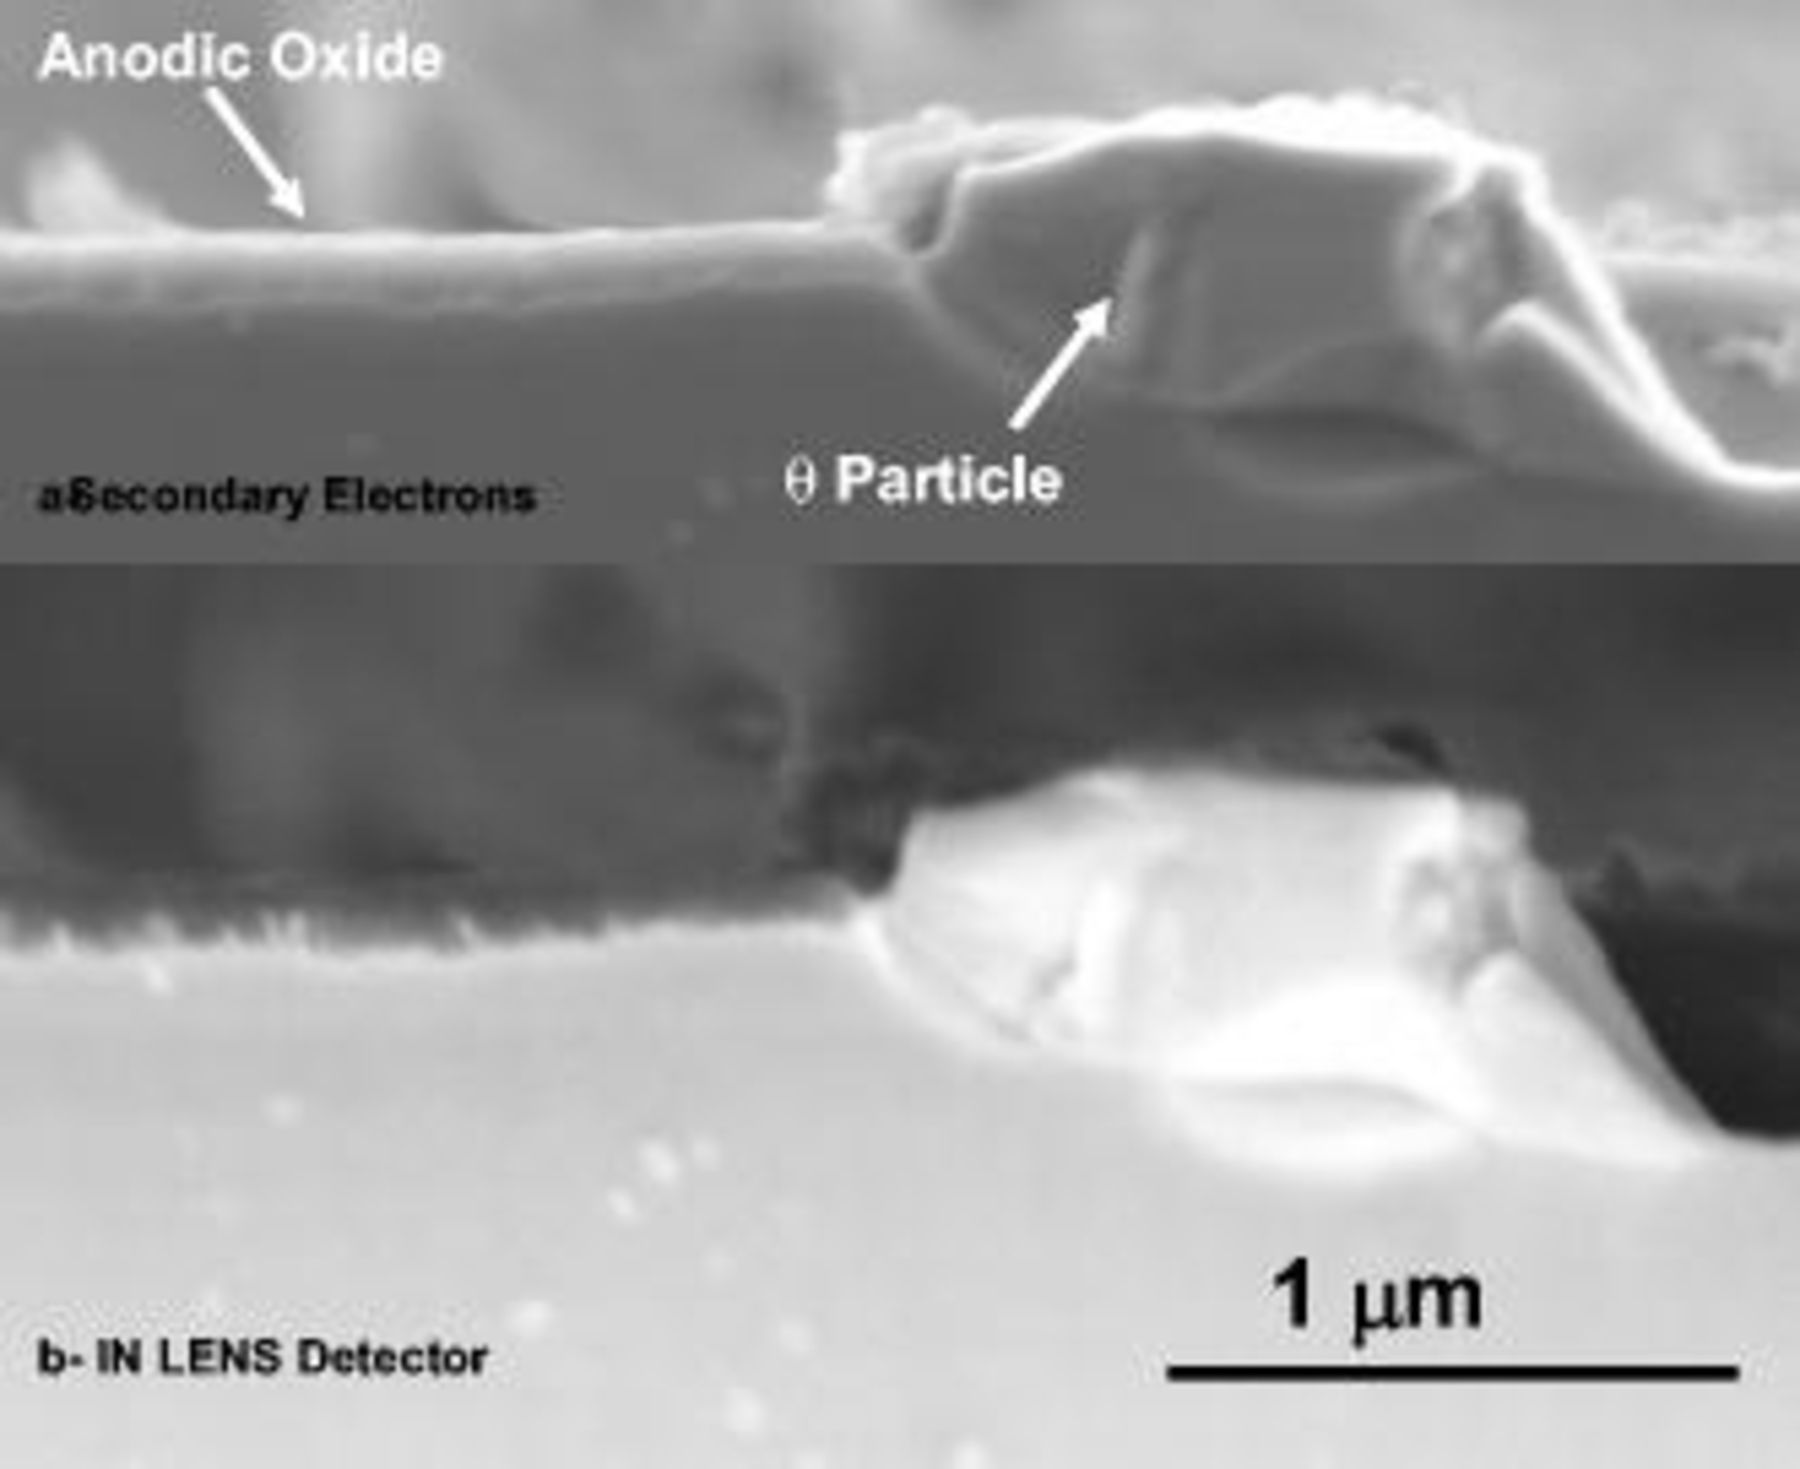
Figure 11. Scanning electron micrograph of a section of the alloy after anodizing at 2 V (SCE) for a charge of  in 0.46 M sulfuric acid electrolyte.
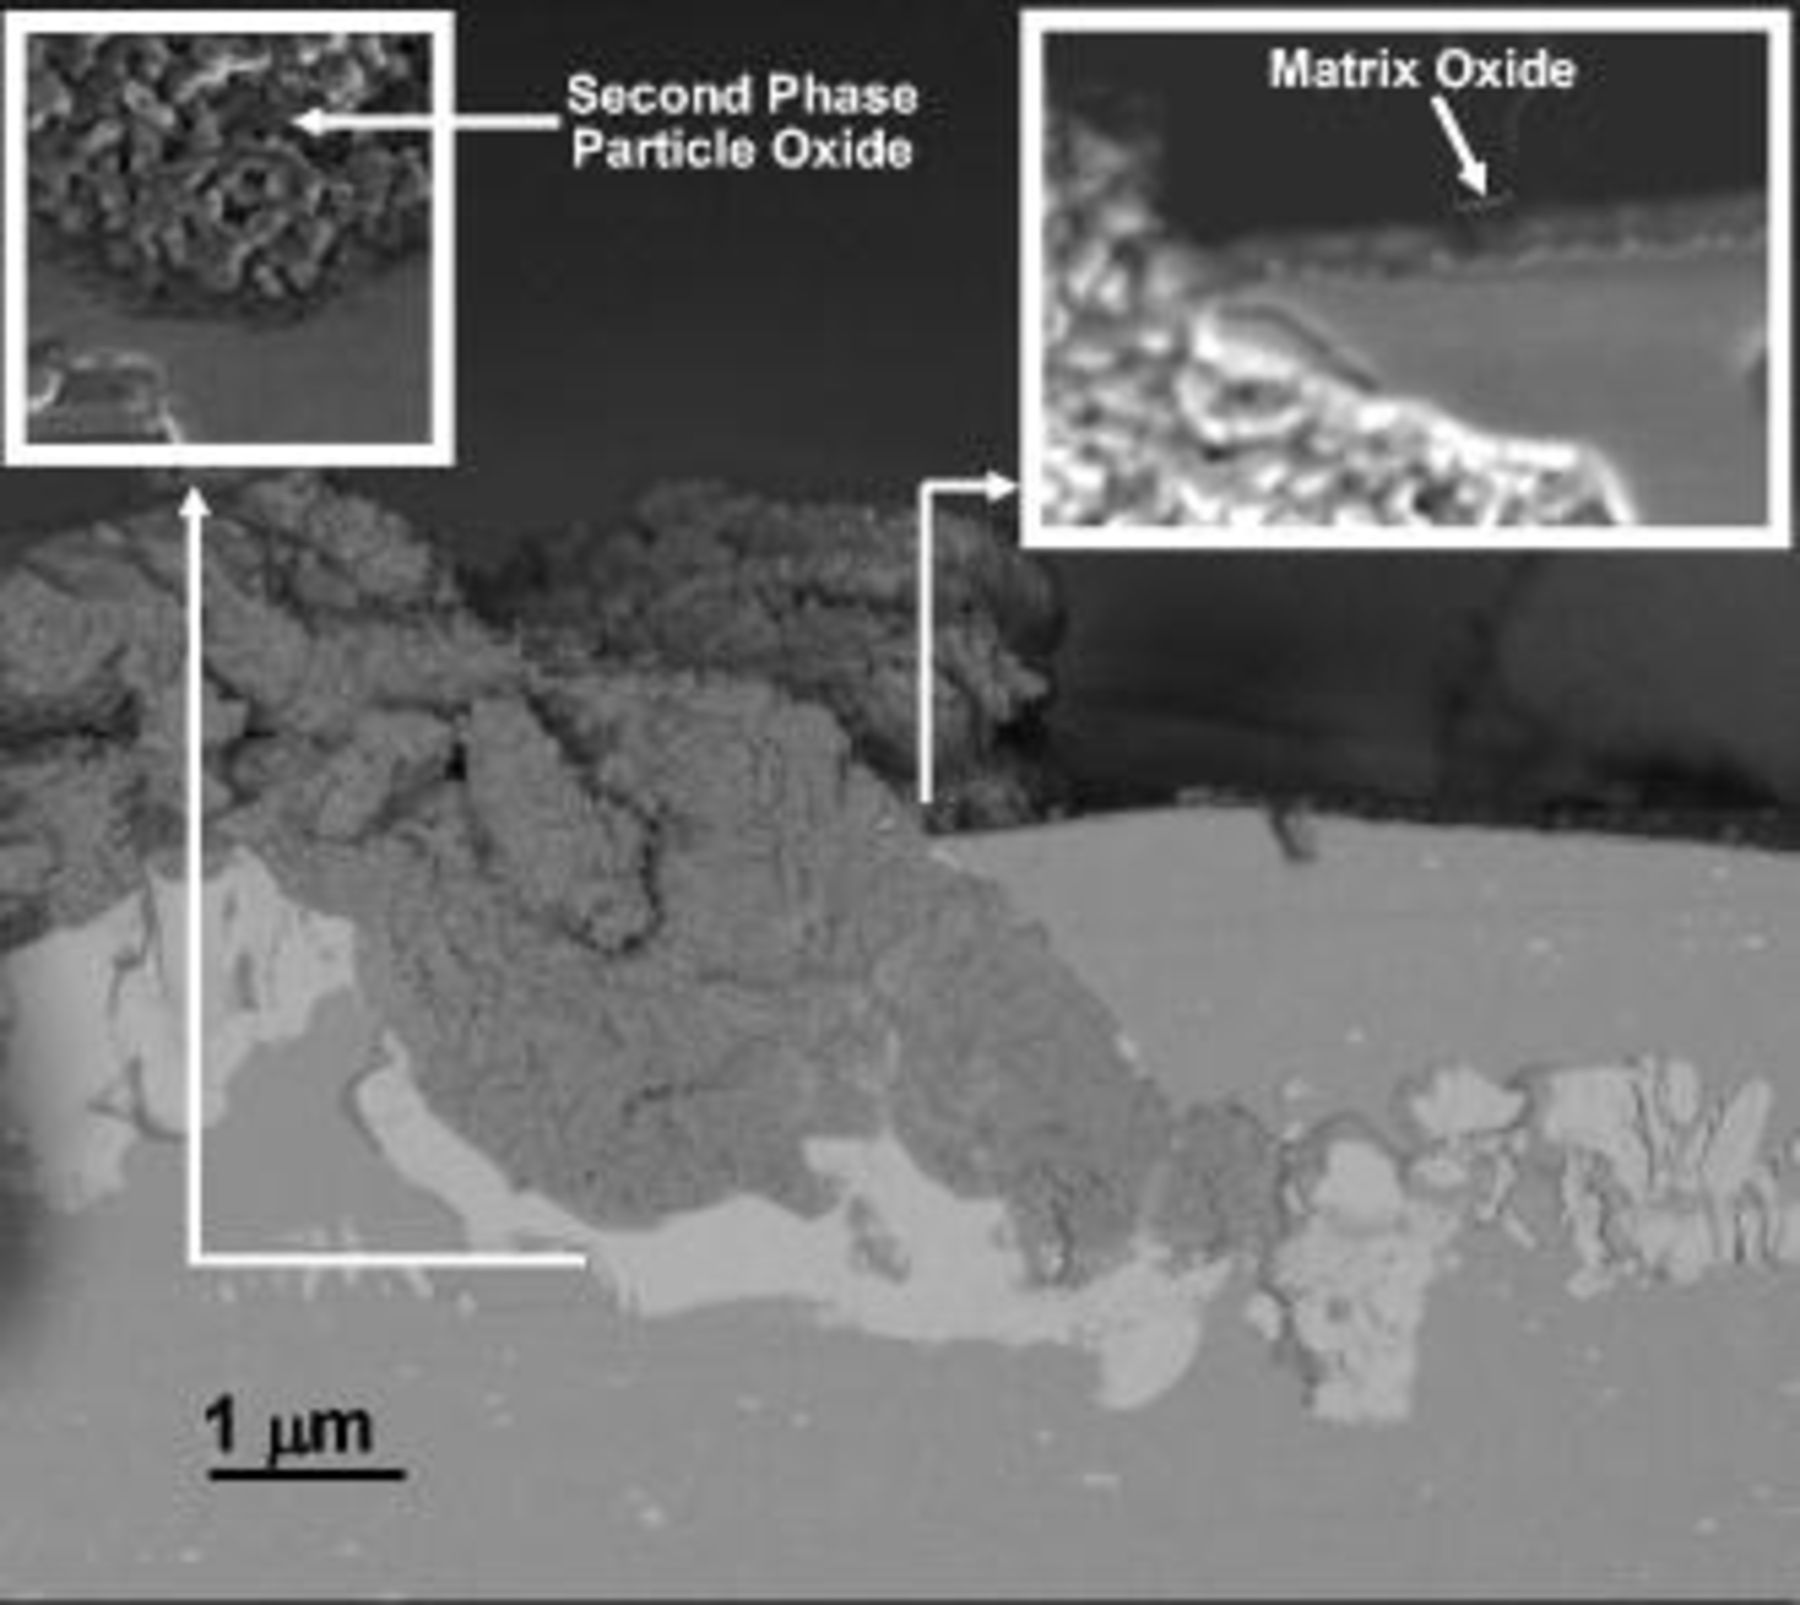
Figure 12. Scanning electron micrograph of a section of the alloy after anodizing at 8 V (SCE) for a charge of  in 0.46 M sulfuric acid electrolyte.
Transmission electron microscopy
It is recognized that the porous anodic film morphology is dependent on the applied potential.16 Thus, if the potential is continuously increased with time (typical of linear polarization), the anodic film parameters will change across the film thickness, with a fine-featured morphology displayed in the outer film regions that are generated at a reduced potential. Conversely, a coarser morphology is anticipated in the inner film regions that are associated with anodizing at increased potentials. For the AA2024 T3 aluminum alloy, polarized under potentiodynamic conditions to increasing potentials at 1 V/min, the transmission electron micrograph of an ultramicrotomed section (Fig. 13a) confirms the contrasting morphologies across the film thickness. A relatively fine, porous anodic film morphology is displayed in the outer film regions; additionally, individual pores traverse the associated film thickness with little deviation through pore cessation or branching. This appearance is in marked contrast with the coarser morphology of the inner film regions; here, interrupted pores and a layered appearance are evident. For comparison, the etched and desmutted alloy was also anodized at 14.4 V (SCE) in the same solution. A layered morphology was observed (Fig. 13b) and, as expected, no significant changes in morphology were revealed in traversing the film thickness from the film/electrolyte interface to the alloy/film interface; the latter region revealed the barrier layer beneath the major pores that penetrates the alloy in a hemispherical manner.
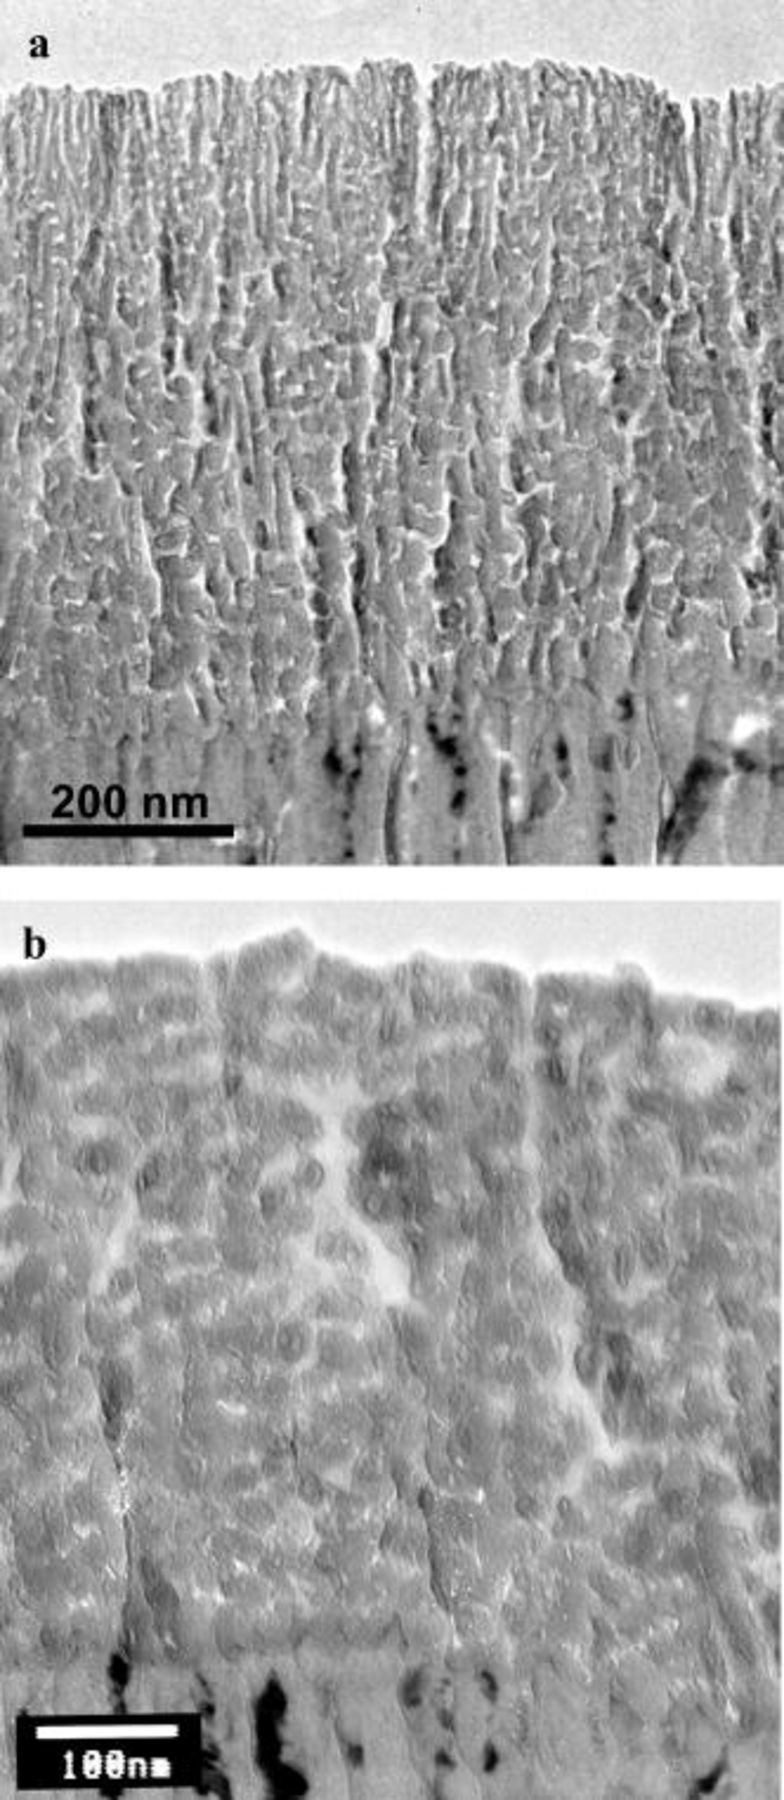
Figure 13. Transmission electron micrographs of ultramicrotomed sections of the AA2024 T3 alloy after anodizing in 0.46 M sulfuric acid at room temperature under selected conditions: (a) potentiodynamic conditions at 1 V/min and (b) potentiostatic conditions at 14 V for 420 s.
Further alloy specimens were anodized under potentiostatic conditions and observed by transmission electron microscopy (Fig. 14 and 15). At the low potential of 1 V the film was relatively thin, and individual pores were not readily revealed (Fig. 14a). However, the scalloped appearance of the alloy/film interface suggested nonuniform film growth prior to thickening of a relatively regular porous anodic film. Between 2 and 5 V (SCE), a porous film morphology was established (Fig. 14b and 14e). Notably, the porous film morphology was significantly different from the relatively irregular morphology that is normally observed for potentiostatic anodizing at increased potentials, i.e., above 14 V (Fig. 13b), and resulting from the cracking of the barrier layer following oxygen evolution, with a consequent infiltration of the anodizing electrolyte in the crack and locally accelerated oxide growth.14

Figure 14. Transmission electron micrographs of ultramicrotomed sections of the AA2024 T3 alloy after anodizing in 0.46 M sulfuric acid electrolyte at room temperature for 360 s at different voltages: (a) at 1 V for 360 s, (b) at 2 V for 600 s, (c) at 3 V for 600 s, (d) at 4 V for 600 s, (e) at 5 V for 600 s, and (f) at 6 V for 600 s.
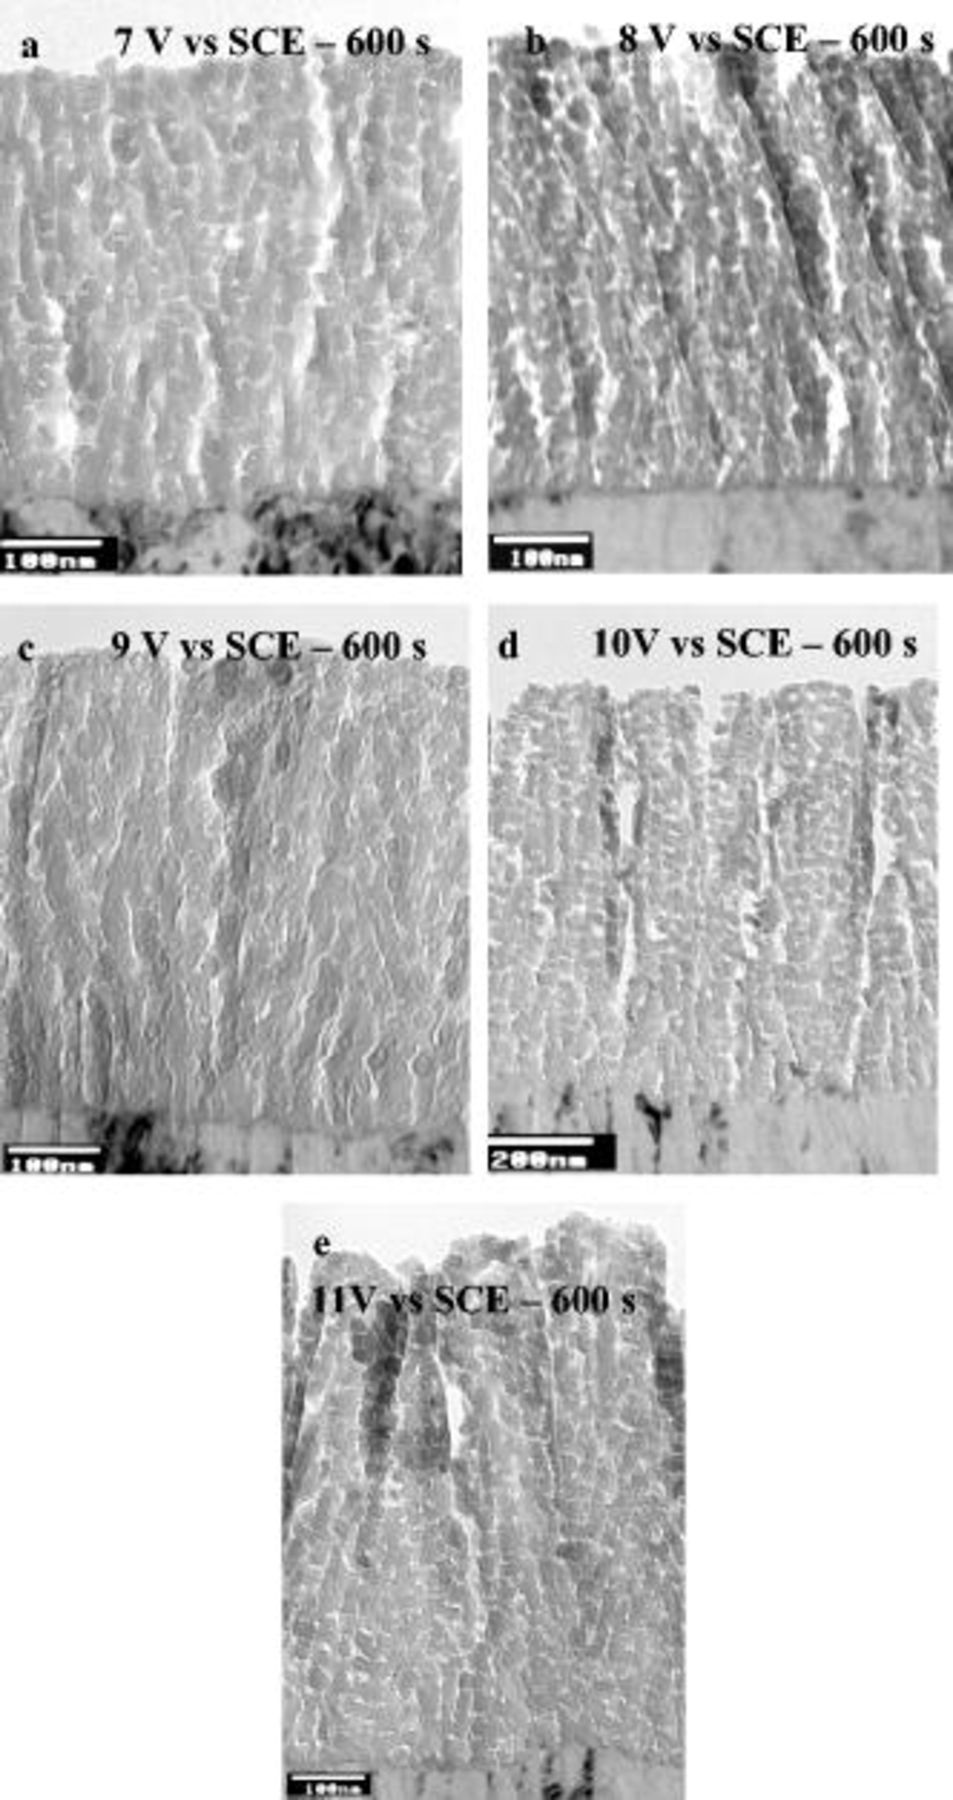
Figure 15. Transmission electron micrographs of ultramicrotomed sections of the AA2024 T3 alloy after anodizing in 0.46 M sulfuric acid electrolyte at room temperature to different voltages: (a) at 7 V for 600 s, (b) at 8 V for 600 s, (c) at 9 V for 600 s, (d) at 10 V for 600 s, and (e) at 11 V for 600 s.
Specifically, specimens anodized between 2 and 5 V (SCE) displayed a film morphology reminiscent of porous anodic film growth on aluminum, with relatively continuous pores that revealed branching through the film thickness (Fig. 14a, 14b, 14c, 14d and 14e). Specimens anodized at 2 and 3 V showed several dark spots (Fig. 14b and 14c) which EDX analysis indicated as copper-rich regions occluded in the anodic film. For anodizing at 6 V or above (Fig. 14 and 15), a layered film morphology was observed. Further, the total thickness of the porous anodic film increased with the anodizing voltage, varying from 80 nm at 2 V to 690 nm at 10 V.
Discussion
General observations
Anodizing aluminum at a constant current density in ammonium pentaborate electrolyte usually generates a barrier-type film.17, 18 For high-field ionic conduction, under galvanostatic conditions, the potential increases linearly with time to maintain a constant electric field strength across the thickening anodic oxide film. An increase of the current density results in a more rapid film growth and, consequently, an increased rate of potential rise with time. During linear polarization in ammonium pentaborate electrolyte, a constant  is imposed and, as expected, a constant current is recorded. For such polarization, the thickness of the anodic oxide film increases linearly with time to maintain a constant field strength across the anodic film. An increase of the sweep rate results in an increased current density and, consequently, a more rapid film growth. Thus, in summary, the presence of the current plateau in the
  curves recorded under potentiodynamic conditions is associated with the thickening of an anodic film over the macroscopic aluminum surface.
For similar polarization, but with increased reactivity in the sulfuric acid electrolyte to the alumina film, the plateau current density increases, indicating a decreased efficiency of the film growth. The plateau region is usually associated with nonuniform film thickening prior to the formation of major pores. Subsequently, a region of progressive increase of the current density with the potential is evident, where the porous anodic film thickens and the anodic film parameters of cell and pore diameter and barrier layer thickness are linearly dependent on the imposed potential. In this region, the current density is dependent on the potential, but with comparatively little influence of the sweep rate.
The  response is explained by initial nonuniform thickening with embryo pore development; the reduced current efficiency compared with film formation in near-neutral electrolytes results from direct ejection of aluminum cations into the acidic electrolyte without forming solid film material at the film/electrolyte interface. With the development of a regular porous anodic film over the macroscopic aluminum surface, it is well documented that the current density is exponentially related to the electric field strength or potential drop across the barrier layer beneath the pore base. Mechanisms of porous film growth have largely been considered a major role of field-assisted dissolution at the pore base, although, recently, convincing evidence has been presented for the displacement of oxide from the barrier layer region to the cell walls through oxide plasticity induced by the electrostriction force due to the high electric field present across the barrier layer.19
Anodic film growth on the AA2024 T3 alloy
During potentiodynamic anodizing of the AA2024 T3 alloy, similar overall behavior to that of aluminum is anticipated, with initial nonuniform film growth and barrier layer thickening over the general alloy surface and a subsequent stage of porous film growth. However, the presence of second-phase particles and alloying elements in the aluminum matrix significantly modifies the anodic film morphology and the electrical response. Two peaks at 0 and 6 V (SCE) are observed in the  response of the AA2024 T3 aluminum alloy during polarization under potentiodynamic conditions. Scrutiny of the alloy surface after anodizing to selected voltages indicates that the first peak is associated with the dissolution of second-phase particles of high magnesium content (
 phase); as a result, cavities are generated on the alloy surface. Conversely, the second peak, at 6 V (SCE), is associated with oxidation of most of the second-phase particles that are exposed to the electrolyte at the alloy surface. Such particles have compositions close to the θ phase, and contain negligible amounts of magnesium.
The charge associated with the second peak, after background subtraction and assuming (i) a composition of  , with a density of
  , (ii) a coverage of 1.5% of the total surface, and (iii) that oxygen evolution decreases the oxidation efficiency of the second-phase material to 60%, is sufficient to oxidize second-phase material to depths of 1.79 and
  (at 5 and 1 V/min, respectively). This value is in approximate agreement with the size of the second-phase particles revealed prior to polarization by scanning electron microscopy. The previous interpretations of behavior are confirmed from the
  response of the binary Al–Cu alloy; in the absence of second-phase particles, no peaks are displayed over the previous range of anodic linear polarization.
Separation of particle and matrix effects
The potentiostatic studies provide further insight into the potentiodynamic responses of the AA2024 T3 alloy, allowing the effect of second-phase particles on the electrical response to be separated from that of copper in the aluminum matrix. This is assisted by comparing the electrical responses under potentiostatic conditions of model Al–Cu alloy (containing copper in solid solution, but free of second–phase particles) and the AA2024 T3 alloy (containing both second–phase particles and copper in solid solution).
From examination of the alloy surfaces, it is evident that, for anodizing under potentiostatic conditions at potentials below 3 V (SCE), only a small volume fraction of second–phase particles is lost from the surface, generating fine cavities. Over the potential interval between 3 and 4 V (SCE), the second–phase particles of low or negligible magnesium content, i.e., the θ phase that constitutes the majority of the second-phase material, are oxidized.
This is in agreement with the electrical response of the commercial alloy under potentiostatic conditions with significant differences revealed in the behavior below 3 V and above 4 V (SCE). Specifically, a significantly reduced current decay, or increased transient time, is observed in the  curves obtained at potentials above 4 V. The increased transient duration is associated with the oxidation of most of the second-phase particles, superimposed on the oxidation of the aluminum matrix. In agreement with the previous experiment, the duration of current transient recorded for the model Al–Cu alloy, in the absence of second–phase particles, decreased with an increasing potential.
High-resolution scanning electron microscopy of the specimens anodized at constant charge confirms the previous. Specifically, anodizing at 2 V (SCE) results in the preferential oxidation of the aluminum matrix, while anodizing at 8 V (SCE) results in the preferential oxidation of second-phase material. For this reason, the anodic film generated above the aluminum matrix after anodizing at 2 V (SCE) is relatively thick compared with the anodic film generated above the matrix after anodizing at 8 V (SCE) for a given anodizing charge.
The presence of copper in solid solution in the aluminum matrix is responsible for the lateral porosity of the porous anodic film observed on AA2024 T3 aluminum alloy anodized at appropriate voltages. Iglesias-Rubianes et al.14 proposed that the specific morphology arises from a cyclic process of generation and rupture of newly formed anodic film. Thus, it was suggested that the oxidation of the copper at the alloy/film interface is responsible for triggering oxygen generation within the barrier layer beneath the porous morphology. Such oxygen generation, with the gas present in oxygen-filled bubbles at high pressure, results in the rupture of the anodic film, with subsequent access of the anodizing electrolyte to the alloy/film interface. This provides a preferential path for current flow and consequent preferential anodic oxide growth. Anodizing then continues until a new crack is produced. The oscillations in the current revealed during potentiostatic anodizing are related to the initial synchronism of the rupture and growth processes.
Further insight into the relation between applied potential, copper oxidation, oxygen evolution, and generation of the layered film morphology is available from scrutiny of the low potential region recorded under potentiostatic conditions. The typical layered porous anodic film morphology is evident above 6 V (SCE). This potential can be considered as the minimum required for oxygen generation within the anodic film, thereby contributing to barrier layer rupture and, consequently, the layered morphology.
For anodizing at potentials below 3 V (SCE), copper-rich regions are occluded in the oxide; this indicates that for potentials below a critical value, the difference in the Gibbs free energy per equivalent for oxidation of copper and aluminum is relevant, with consequent preferential oxidation of aluminum. Thus, for anodizing at potentials below 3 V (SCE), aluminum is oxidized initially with copper accumulating at the alloy/film interface; subsequently copper-rich regions are occluded into the anodic film. Consequently, at reduced potentials, the mechanism of pore generation is closely similar to that for high-purity aluminum, because the anodic film is free of copper ions and no oxygen gas is generated within the barrier layer. The film morphology observed in this potential interval on the AA2024 T3 alloy may show some subtle difference from that on aluminum because the film develops preferentially in the zones of decreased amounts of copper; consequently, the pores do not always pass perpendicular to the alloy/film interface.
Conversely, in agreement with the findings of Iglesias-Rubianes et al. , for increased potentials, oxygen evolution takes place, thereby causing film rupture and access of the anodizing solution into the crack. Such phenomena are related to the development of the layered film morphology. The geometrical model of Fig. 16 is introduced to explain the behavior; the model assumes that copper is nonuniformly distributed at the alloy/film interface as a result of preferred oxidation of aluminum. On the nanometer length scale, some regions have increased copper contents compared with adjacent regions. Through selective oxidation of aluminum, the copper-rich regions at the alloy/film interface (Fig. 16) protrude from the alloy into the anodic film; further, such local regions are in electrical contact with the underlying matrix.
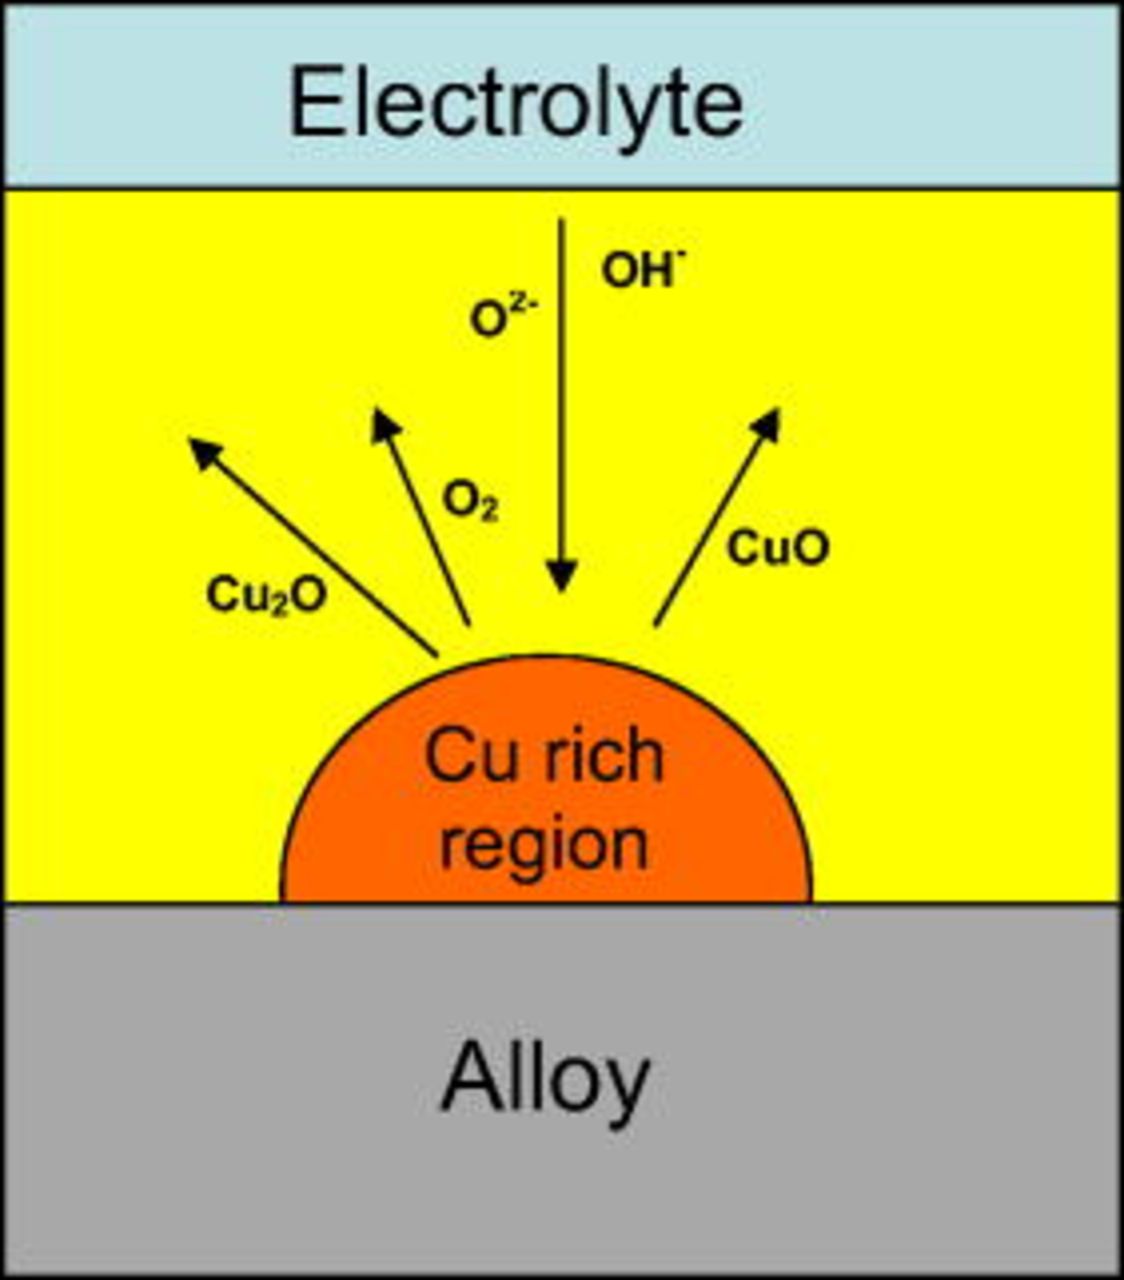
Figure 16. Schematic diagram showing the possible processes proceeding during the cyclic generation and oxidation of copper-rich clusters at the alloy/film interface.
The presence of the copper-rich regions significantly affects the equipotential surfaces in the film (barrier layer); additionally, the further the local region protrudes into the film, the closer its location to the film–electrolyte interface and, consequently, the higher the local electric field and the higher interface potential available for oxidation at the metal film interface. When a sufficient dimension is reached, the copper-rich region begins to oxidize in the area located more closely to the film/electrolyte interface, because the external part is subjected to an increased electric field. Once oxidation commences, the concentration of copper ions in the anodic film is locally increased. Copper ions migrate outward faster than aluminum ions and, consequently, the electrical resistance of the film above the copper-rich region is significantly reduced. When this occurs, the potential at the external region of the incipient copper-rich region is thus increased, and oxygen evolution takes place. Oxygen evolution generates bubbles trapped within the anodic film; at sufficient pressure a bubble may burst or, according to the recent findings of Garcia-Vergara et al. , concerning the plastic oxide displacement under the electrostriction force generated by the electric field across the barrier layer,19 it may be transported and rupture at altered locations. The rupture of the bubble, and the consequent oxide disruption, is responsible for the layered morphology.
Between 3 and 6 V (SCE), the copper-rich region can develop further and oxidize, but the available potential is not sufficient for oxygen generation; consequently, the region is transformed to oxidized copper species, without generating gas; in this case, a layered morphology is not observed. Below 3 V (SCE), the copper-rich region is never oxidized and can be occluded in the anodic film by preferential oxidation of the surrounding alloy matrix.
Conclusions
The electrical response and filming behavior of an AA2024 T3 aluminum alloy have been examined during potentiostatic and potentiodynamic polarization. The anodizing potential controls the overall oxidation process, resulting in the porous film growth above the aluminum matrix as well as the local oxidation of the second-phase material directly exposed to the electrolyte. Although, in both cases, the oxidation of the copper is triggered in similar potential intervals, the resulting effect is fundamentally different. The oxidation of copper at the alloy/film interface results in modification of the overall porous anodic film morphology, while the oxidation of the second-phase particles results largely in their consumption and local generation of a specific oxide morphology.
Allied with scanning and transmission electron microscopies, it has been demonstrated that oxidation of most of the second-phase particles proceeds above 4 V (SCE). The effect on the  behavior under potentiostatic conditions is an increase in the transient time, and the steady current is reached when such second-phase particles are consumed. Under potentiodynamic conditions, the oxidation of the
  -phase particles results in a peak centered at about 0 V (SCE), while the oxidation of the θ phase particles reveals a peak commencing at 2.5 V (SCE) in the resultant
  curves.
Conversely, above the macroscopic alloy surface, as a consequence of the oxidation of the copper at the alloy/film interface and subsequent oxygen gas evolution, a layered porous oxide morphology develops above 6 V (SCE). It is proposed that oxygen evolution takes place when copper-rich regions, generated by the preferential oxidation of aluminum, protrude into the barrier layer from the alloy/film interface. The influence of oxygen evolution on the  response under potentiostatic conditions is the presence of current oscillations in the initial stages, related to the initial synchronism of the formation of the layers. The oscillations are observed for the model binary Al–Cu alloy and the practical AA2024 T3 alloy. Below 6 V (SCE), oxygen cannot develop at the alloy/film interface and the film growth mechanism is generally similar to that observed for high-purity aluminum, although the pores may not pass perpendicular to the macroscopic alloy surface. At potentials below 3 V (SCE), copper cannot be oxidized at the alloy/film interface and, consequently, copper-rich regions are occluded in the anodic film material.
Acknowledgment
The authors acknowledge the financial support provided by the Engineering and Physical Sciences Research Council (United Kingdom) Portfolio Award, LATEST.