Abstract
Natural pitting was investigated using coupled multielectrode arrays (CMEAs) constructed from flush mounted, close-packed UNS C11000 copper wires exposed in chlorinated and aerated Edwards synthetic drinking waters (ESDWs) [ J. C. Rushing and M. Edwards , Corros. Sci. , 46 , 3069 (2004) ]. Tests were conducted in ESDWs with pH adjusted from 6 to 10 and containing 5 ppm  . The CMEA method detected the formation of persistent anodes (pitting) in
  synthetic waters compared to switchable anodes at pH 6 (uniform corrosion). Local maximum and minimum open-circuit potentials (OCPs) were analyzed before, during, and after pitting events and were compared to pitting
  and repassivation
  potentials. Natural pitting was found to occur on a small percentage of electrodes once the OCP rose above
  determined in upward/downward scans. Pits stopped growing once the OCP dropped below
  . Pitting factors, determined as a function of pH, increased with pH from 7 to 9. However, a further increase in pH to 10 reduced pitting, which could not be determined from other test methods. This drop in pitting factor could be ascertained from arrays but not from a comparison of OCPs to pitting potentials seen in upward scans. The cathodic capacity of adjacent cathodic sites as a function of water chemistry and the nature of the cathodic sites were factored into this analysis.
Export citation and abstract BibTeX RIS
In our previous study, the electrochemical pitting behavior of UNS C11000 copper was investigated in Edwards synthetic drinking water (ESDW)1 found to cause pitting using single microelectrodes driven under potentiodynamic control.2 Tests were also conducted in several other  ,
,  , and
, and  containing waters with systematic variations in the concentrations of these species. Studies of the effect of water chemistry on passivity, uniform corrosion, and pitting were accomplished using the cyclic voltammetry (CV) method complemented by various diagnostic methods. Three different regions have been identified based on pH: uniform corrosion
  , limited pitting susceptibility region
  , and pitting susceptible region
  . Certain water chemistry concentrations were found to promote pitting. Critical pitting potentials
  for copper pitting were decreased by certain water chemistry variables. High
  ,
,  , and
, and  ratios lower pitting potentials, while an increase in alkalinity (increasing
  or
or  ) improved passivity and raised pitting potentials.
  can protect copper surfaces by forming carbonate containing minerals. However, such carbonated species are less beneficial toward passivity compared to
  with respect to passivation efficiency.
Empirical equations were developed that forecasted pitting and repassivation potentials as a function of selected water chemistry variables.2 These equations were generated by a linear regression analysis based on experimental pitting and repassivation potential trends with  ,
,  , and
, and  contents. These equations were developed in pH 8.3 and 9.5 waters containing
  ,
,  ,
,  , and
, and  , and their applicability to other pH levels and solutions (e.g.,
  ) is uncertain. In contrast to the strong species effect on
  ,
,  has a weak dependence on any of the anions considered.
Unfortunately, driven electrodes investigated by upward scans do not accurately simulate the natural conditions where pitting occurs. Anodic polarization simulates an extreme oxidizing environment, and there is an unlimited cathode (i.e., a potentiostat) to support anodic reactions during pitting. In reality, various degrees of oxidizing conditions exist based on water chemistry, and the accessible cathodic area may be limited for each pitting event based on current/potential distributions. The role of oxidizers could not be factored in by using the polarization method. The ability to forecast water chemistry variables that cause natural pitting relies on a test method that factors into the test of all these factors. Pitting might not be possible in certain water chemistries because  or
or  . Therefore, there exists a critical need to understand how an oxidizer (e.g.,
  ) increases the open-circuit potential (OCP) to above the critical potential, changes cathodic capacity,3 or changes the water chemistry in some other way. This can be achieved by the coupled multielectrode array (CMEA) technique under freely corroding conditions. However, there are advantages and disadvantages regarding this technique.
Multiple electrode arrays were first used in the study of copper corrosion by Lucey.4, 5 In his array, the surface of the specimen consisted of 50 electrically isolated copper wire electrodes, arranged in five rows of 10 and each connected to a uniselector switch to facilitate automatic recording of the potential. Lucey successfully discovered the effect of descending corrosion products on the electrode-potential behavior of copper in Dartford tap water by using his multiple electrode arrays. However, the current behavior of anodes/cathodes could not be recorded by this array configuration. Harrison et al. reported their research of copper pitting in potable water using microelectrode arrays.6 However, their electrodes were joined together by soldering; hence, no current behavior could be distinguished between anodes and cathodes. Several other researchers have advanced the use of CMEAs in other corroding systems. For instance, Sun and Yang demonstrated that CMEA sensors are effective real-time tools for monitoring localized and general corrosion rates of carbon steel, brass, and stainless steel in drinking water systems.7 Clearly, the CMEA method is suitable for the detection of pitting corrosion although most studies have improperly used widely spaced electrodes.7
Recently, the close-packed CMEA method has been successfully utilized to study localized corrosion phenomena: pitting corrosion, crevice corrosion, intergranular corrosion, and galvanic corrosion.8–15 Close-packed CMEAs are arrays of electrically isolated electrodes, which are coupled together through in-line, zero-resistance ammeters (ZRAs) to form a galvanically coupled electrode surface. The coupled electrodes are designed to closely simulate a planar electrode surface but allow the current behavior of each electrode to be monitored individually. The size of the electrode is carefully chosen, and the electrodes are selected by sizing to the length scale of anode sites formed during localized corrosion. Therefore, a pitting event can be accurately identified from the current behavior of a single electrode of the array. Because the anodic reaction at the anode must be balanced by cathodic reactions and consumption of electrons at nearby electrodes,on an electrode where the radius of the electrode is much larger than the radius of the pit, most electrons are consumed by cathodic reactions on the same electrode. Overestimation of the pit size (oversized electrodes used) or underestimation of the pit size (undersized electrodes used) can be avoided by a careful selection of the electrode size. The key advantage of close-packed CMEA over other methods used in copper corrosion research is that it allows simultaneous temporal and spatial measurements of electrochemical processes on locally addressable sites and monitoring the real-time processes that take place on electrode surfaces under natural corrosion. The CMEA method permits neighboring electrodes to be affected by adjacent electrochemical processes that are coupled chemically and electrochemically. It also has the ability to separately address individual electrodes and interrogate the properties of specific electrodes in isolation by switching a selected electrode out of the array to perform detailed electrochemical measurements, e.g., cathodic polarization and electrochemical impedance.
The purpose of this research is to study the effect of solution pH on natural copper pitting corrosion in ESDW with fixed  ,
,  , and
, and  levels as well as the presence of residual chlorine and aluminum solids. Single artificial pits were first investigated, and subsequently the combination of anodes and cathodes was studied. Following the artificial-pit investigation, CMEA of copper was utilized to study the effects of water chemistry on the formation of persistent anodes (pits) vs switching anodes (uniform attack). After that, the formation of persistent local anodes, fast anodic reaction rates on local areas, and the formation of high cathode/anode area ratios as a function of water chemistry, specifically pH in this case, were examined. Finally, the electrochemical properties of isolated persistent cathodes and/or anodes were interrogated by electrochemical methods as well as characterized by confocal laser scanning microscopy (CLSM) and scanning electron microscopy (SEM) methods.
Experimental
Materials
On each electrode element in the CMEA, the measured current through a ZRA is the net current from local sites, which may be either net anodic or net cathodic.13 Therefore, it is desirable that the size of the close-packed CMEA electrodes matches the size of a pit, or at least is dominated by one or more pit sites, so that the net current measured by a ZRA is approximately equal to the anodic pitting current and the cathodic current contribution from the remainder of the pitting electrode is small enough to be neglected. Hence, a  diameter copper (UNS C11000) wire was chosen to construct a
  CMEA electrode with a nominal separation distance of
  or less, as discussed elsewhere.12, 13 The electrodes were insulated from each other by a polyimide coating to prevent short-circuit. The polyimide film also minimized unintended crevice corrosion between the coating and the electrode so that attack was only initiated on the polished surface. The exposed area of Cu in a close-packed array was
  for 100 wires per rectangular area
  the CMEA simulates, which is approximately 80% of the area of a continuous rectangular area. Arrays were flush mounted in epoxy resin and polished with successively fine abrasive paper (600–800–1200 grit) lubricated with water to the desired finish, degreased in acetone, rinsed in deionized water, and dried at room temperature. For the artificial-pit studies,
  diameter copper wires (UNS C11000) were mounted between two plastic microscopic cover slips with a thin layer of epoxy. This was done so that the pit depth could be examined under an optical microscope after each experiment.
Environments
ESDW used in this research was designed to simulate the gross ionic constituents found at a water utility whose consumers were experiencing pitting.16 ESDW initially contained 34 mg/L alkalinity as  , 14 mg/L
  , 20 mg/L
  , and 17 mg/L
  added as reagent grade sodium or calcium salts to deionized water. The measured conductivity was
  . The pH was 7.4. Chlorine residue was added in the form of purified grade sodium hypochlorite (4–6% NaOCl), and free chlorine was measured by using the DPD (N,N diethyl-p-phenylene diamine) colorimetric test per standard method 4500-Cl G.1, 16 In all the test solutions, pH was adjusted to a designated value by adding droplets of either 0.1 M NaOH or 0.1 M HCl.
Electrochemical testing and characterization
Artificial-pit experiments to elucidate pit chemistry
A conventional, three-electrode electrochemical cell was used for electrochemical testing on single artificial pits. Electrodes were placed at the bottom of the cell facing upward. A potentiostatic hold was used to create artificial pits in pH 9 ESDW. The pits were initiated at  (saturated calomel electrode) for 60 s, and then the potential was stepped to designated values (from
  to
to  ) and held for 1 h. Subsequent downward polarization following potentiostatic hold was carried out from the potentiostatic hold potential to
  at a scan rate of 10 mV/s. The artificial-pit experiments were performed using FAS2 femostat by Gamry, and a Faraday cage was used to eliminate electrical noise. All the experiments were performed at room temperature,
  . The pit depth for artificial pits was calculated using Faraday's law, with the assumption that the artificial pits were pitted uniformly in depth
where  is the pit depth,
  is the anodic charge,
  is the atomic weight of copper,
  is the number of charges on the ion,
  is the Faraday constant,
  is the density of copper, and
  is the radius of the electrode.
CMEA testing of localized corrosion phenomena
A model 900 multichannel microelectrode analyzer (MMA) (Scribner Associates, Inc.) was used for all the CMEA experiments. The MMA had 100 individually measured ZRAs, each with a resolution of  (i.e., nominal current density of
  for a
for a  diameter wire). The maximum current output of a ZRA was
  (i.e., this is equal to a nominal current density of
  for a
for a  diameter wire). Different scales from
  to
to  can be selected from the current map window. Figure 1 is an example of a current map measured by an MMA instrument.
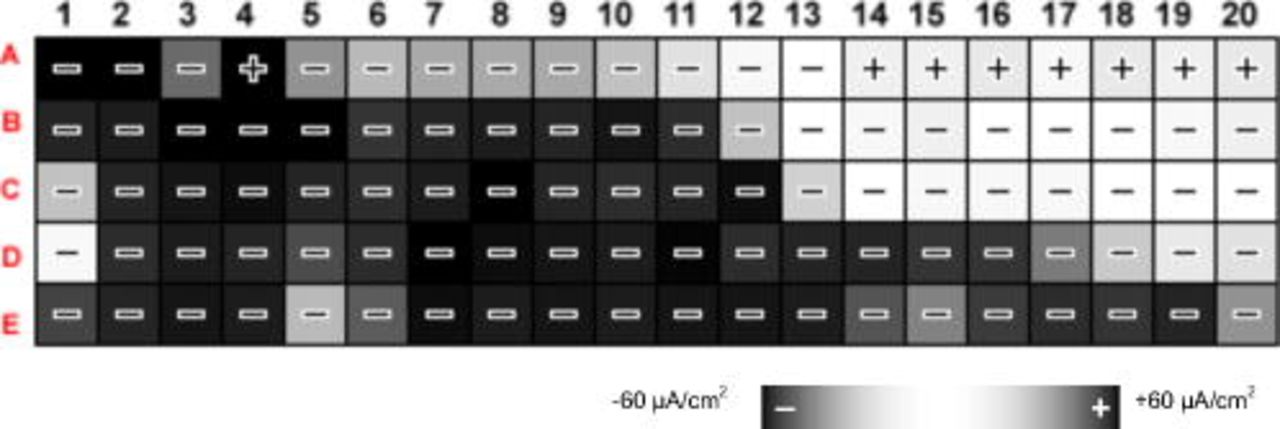
Figure 1. An example of the current map corresponding to a  CMEA electrode in pH 10 ESDW with 5 ppm
  and 2 ppm
  . Dark black with a minus sign [e.g., electrode (1,B)] represents a strong cathode, and dark black with a plus sign [e.g., electrode (4,A)] corresponds to a strong anode, while white represents a neutral electrode.
Two sets of experiments were carried out under naturally corroding conditions. During each experiment in the first set, free chlorine was adjusted incrementally from 0 to 5 ppm by 1 ppm per day, and pH was kept constant throughout each experiment. Only results with 5 ppm  added are discussed here, and the effect of free chlorine levels is discussed in a subsequent study. Each experiment in the second set was performed with constant chlorine level and constant pH for 6 days. For both sets, the test cell was replenished with fresh water with targeted pH and chlorine level every 24 h. No other effort was made to maintain the pH and chlorine concentration during the 24 h. Two ppm
  was added into all the test solutions when CMEA experiments were performed.16 However, the effect of aluminum solids is addressed in detail in a separate study.
The maximum hemispherical pit radius on any single electrode for CMEA long-term exposure studies was calculated using Faraday's law based on the assumption that a single hemispherical pit17 formed on one copper electrode and consumes all the anodic charge
where  is the radius of the pit,
  is the atomic weight of copper, γ is the current/charge efficiency,
  is the anodic charge,
  is the number of charges on the ion,
  is the Faraday constant, and
  is the density of copper.
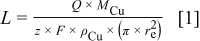
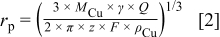
The pitting factor18 (PF) was used in this research to quantify the extent of pitting corrosion compared to uniform corrosion and defined as follows
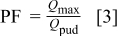
where  was the maximum total anodic charge for a single electrode out of an array and
  was the calculated total passive uniform dissolution charge for one single electrode (
 ).
).  was calculated as follows: First, the average OCP for a Cu CMEA during a 6 day exposure experiment at constant pH and
  level (second set) was calculated. For example, the average OCP for a Cu CMEA in pH 8 ESDW with 5 ppm
  and 2 ppm
  for 6 days was calculated to be
  . Next, the passive uniform dissolution current density
  corresponding to the average OCP was obtained from the CV result in the deaerated ESDW at the same pH level.2 For example,
  at
at  in pH 8 deaerated ESDW.Finally, the total passive uniform dissolution charge for a single electrode was calculated according to

For example,  was calculated to be 0.221 mC for a
  diameter Cu electrode for 6 days at
  . A PF of unity
  indicates uniform corrosion. The higher the PF, the more severe the pitting corrosion.18
Characterization of persistent anodes by CLSM and SEM/EDS
CLSM was used for qualitative and quantitative measurements of selected pits. CLSM analyses were performed using a Zeiss 510 laser scanning microscope with software version 2.01. "Maximum depth" and "volume" measurements were performed by using the "profile" and "fill volume" function, respectively. SEM/energy-dispersive spectroscopy (EDS) (JSM-6700F) was also utilized to analyze the chemical composition of the corrosion products. The accelerating voltage was 10 kV. Secondary electron images were taken by the secondary detector located next to the sample. The energy resolution of the EDS is 130 eV. SPIRIT software was used for EDS analysis.
Results
Artificial pits to study the relationship between accumulated charge and pit depth
To determine the relationship between the accumulated anodic charge and the true pit depth, an artificial pit was investigated using potentiostatic holds at different applied potentials ( to
to  ). The calculated pit depth from Faraday's law was compared to the physical depth given the knowledge of artificial-pit radius. Figure 2 indicates that the measured pit depth by the optical microscope matches well with the calculated pit depth using Eq. 1, assuming that
  . This also agrees with the findings of Christy et al. that the valence state of dissolved copper inside a pit is largely
  , rather than
  using a potentiostatic hold at
  in various water chemistries.19 The stable OCP of an artificial pit within 1 h after current interruption during the
  hold was approximately
  . This potential is much higher than the proton discharge potential
  at an assumed pH 2.34 {
 for the reaction of
  20 and assuming the solubility of CuCl (i.e.,
  )21}. Hence, hydrogen evolution is unlikely to occur inside a pit on copper. Unlike the case of aluminum-based alloys where a substantial local cathodic reaction occurs,22 current efficiency can be assumed to be 100%
  in copper pitting.

Figure 2. Comparison between calculated pit depth based on total anodic charge and measured pit depth by optical microscope at different applied potentials.
Identification of uniform corrosion vs pitting corrosion of copper using the CMEA method
CMEA can distinguish pitting corrosion from uniform corrosion by examination using a combination of the potential–time series, current–time series, and current maps.13 In the copper pitting in high pH ESDW (e.g., pH 9), after 5 ppm free chlorine was added, the OCP gradually increased to a local maximum  , which was above a critical potential. Then, it suddenly dropped to a local minimum
  in a short time. The current maps show that only uniform passive dissolution of copper occurred before the OCP reached
  . However, when the OCP dropped to a low level
  , a dark square with a plus sign in the current map (Fig. 1) indicated a high anodic current density on one of the electrodes. This result is interpreted as evidence that a persistent anode was forming on this single electrode in this particular water chemistry. This phenomenon has been observed on other materials, too.23, 24 By comparison, uniform corrosion of copper occurred in a low pH (pH 6) ESDW. As shown in Fig. 3a, OCP remained below theoretical oxide formation potentials, and no abrupt change in OCP was observed from the potential–time series. All currents were low and near zero from both current–time series (Fig. 3b) and current maps (Fig. 3c), indicating switchable anodes and cathodes, and no anodic current spikes were observed.
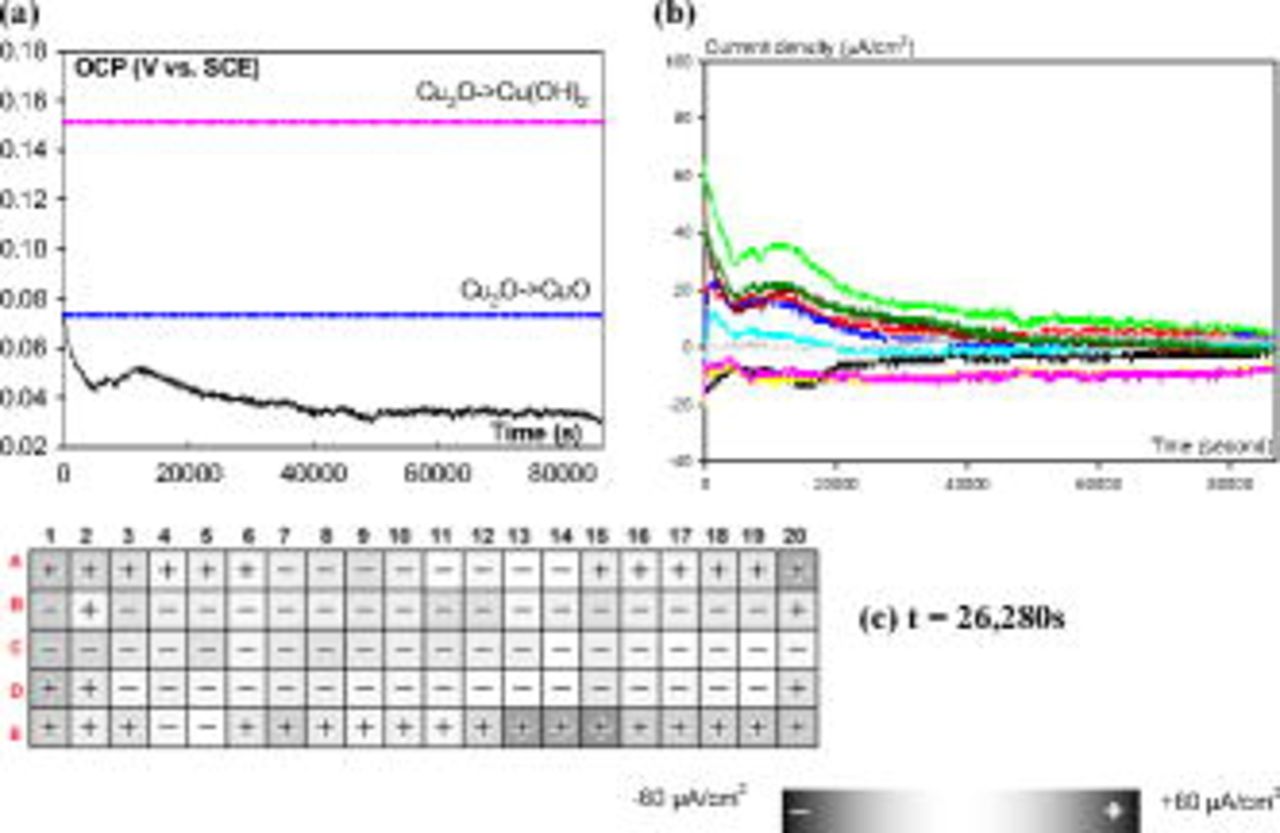
Figure 3. (a) OCP vs time, (b) typical current density (from 10 electrodes) vs time, and (c) stationary current map at time  for 100 Cu electrodes after 5 ppm free chlorine was added in pH 6 ESDW with 2 ppm
  (first set). Only uniform dissolution was observed.
The depth and volume of a pit formed under natural conditions were measured by CLSM. CLSM confirms that the pit volume can be estimated by the accumulated anodic charge  , and the pit depth can be approximated by the radius of a hemispherical pit. The surface area of a pit was measured by an optical microscopic image (Image J), and only a fraction of the total electrode surface (e.g., 17%) was pitted. Therefore, the nominal current density determined assuming the total surface area underestimates the actual pitting current density by possibly 1 order of magnitude when the pits are smaller. For instance, the actual pitting current density can be as high as
  when 17% of the area is actually pitted when the nominal current density based on the entire electrode area is
  .
.
Analysis of apparent anodic current vs true anodic current
The anodic current measured on a pitted copper electrode (a net anodic site) through a ZRA is the net current,  (or "apparent" current), where the superscript indicates the type of site and the subscript indicates the type of current, which includes several components as follows

where  is the true anodic pit current,
  is the cathodic current surrounding the pit on the same electrode or in the pit, and
  is the current due to capacitive discharging of all the surfaces on the same electrode as it experiences a potential drop and rise.25
For instance, two pitting events with different peak currents occurred on electrode (18,C) over the period from  to 36,500 s in pH 10 ESDW with 5 ppm
  and 2 ppm
  (Fig. 4). One peak current of
  was observed at
  , and another peak current of
  was observed at
  , as shown in Fig. 4b. Two separate potential drops of approximately 0.5 V corresponding to these two pitting events were identified in the OCP measurement (Fig. 4a). The cathodic current at each measured potential point was extracted from ohmically corrected true
  cathodic polarization data (nonpitted electrode) and plotted in Fig. 4c. The cathodic current varied between
  and
and  on a single
  diameter Cu electrode, and it reached the value of
  at the peak current of the two peak events, which was only 2% of the peak current at
 . Hence, the cathodic current contribution
  to the measured net total current
  on the pitted electrode is negligible. Another source of unaccounted for cathodic current arises from capacitive discharging, which plays an important role in localized corrosion.25–27 The capacitance of the oxide film formed on a
  diameter copper electrode was estimated to be 50 pF
  by electrochemical impedance spectroscopy (EIS) measurement and modeling. The capacitive discharging currents corresponding to the two pitting events were calculated and plotted in Fig. 4d. These currents were less than
  at the time when the anodic current reached its local maximum. With all the other parameters unchanged, the capacitance is assumed to be 18 nF for a
  diameter electrode
  , which is higher than most of the reported capacitance values on copper.28–32 As shown in Fig. 4d, the maximum capacitive discharging current is less than
  , corresponding to the pitting event with the peak current of
 . Therefore, capacitive discharging current
  is also insignificant compared to the measured net total current,
  . To summarize, the anodic current measured by a ZRA on a copper electrode is very close to the true pitting current, with negligible cathodic current contributions from cathodic reactions in or outside of a pit and from capacitance discharging (combined
  of the true pitting current) on the same electrode in copper pitting.
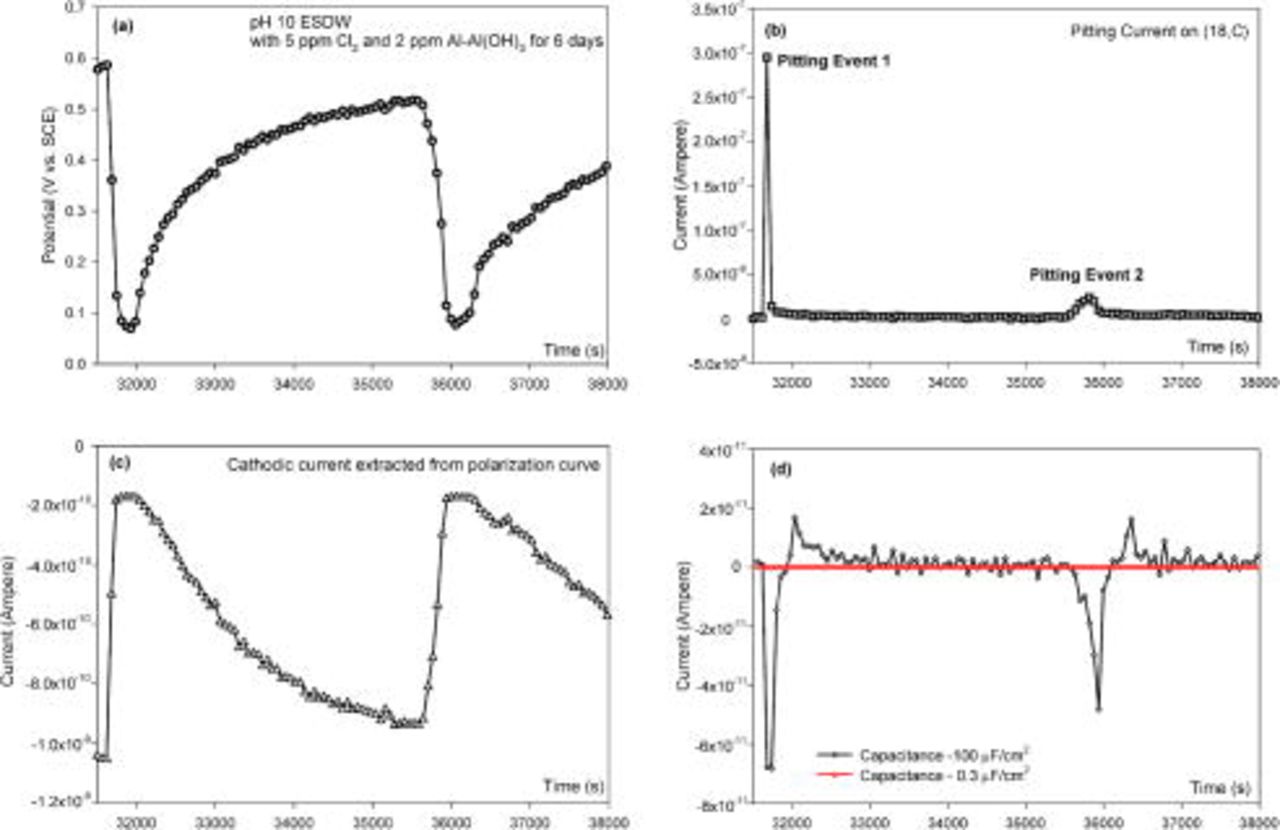
Figure 4. (a)  vs
vs  behavior when pitting occurred on electrode (18,C) in pH 10 ESDW with 5 ppm
  and 2 ppm
  on the sixth day and (b) net
  vs
vs  behavior for (18,C) measured by individually addressed ZRA. (c) Cathodic current (extracted from cathodic polarization data as a function of potential) vs time behavior on one electrode and (d) calculated capacitance discharge current vs time behavior when pitting occurred on (18,C).
Alternative sources of cathodic current: Previously pitted sites
An interesting phenomenon was observed from a 6 day exposure of a copper CMEA in pH 10 ESDW with 5 ppm  and 2 ppm
  . Previously severely pitted sites that repassivate were found to become strong persistent cathodes at later times and to supply substantial cathodic current to support the growth of newly formed pit sites. This process is described as follows. OCP, current–time series, and current maps during the sixth day of this experiment are shown in Fig. 5. Pitting current density reached higher than
  when a new pitting event was initiated on electrode (4,A) at time
  , and more than 50% of the total electrodes became strong cathodes (Fig. 5c). The pitting current density decreased to below
  after 1 min (Fig. 5b and d). At this time, only five electrodes [(2,A), (1,A) (4,B), (7,D), and (8,C)] persisted as strong cathodes (Fig. 5d). A careful examination showed that these five electrodes have been severely pitted before, and only these five electrodes have been pitted before. At the peak anodic current (
 ,
,  ), the peak cathodic currents from these five electrodes sum to
  , which is about 47% of the peak anodic current. These five electrodes continued as strong cathodes for more than 10 min (Fig. 5c, 5d, 5e and 5f) until the magnitude of the anodic current density on electrode (4,A) decreased below
  .
.
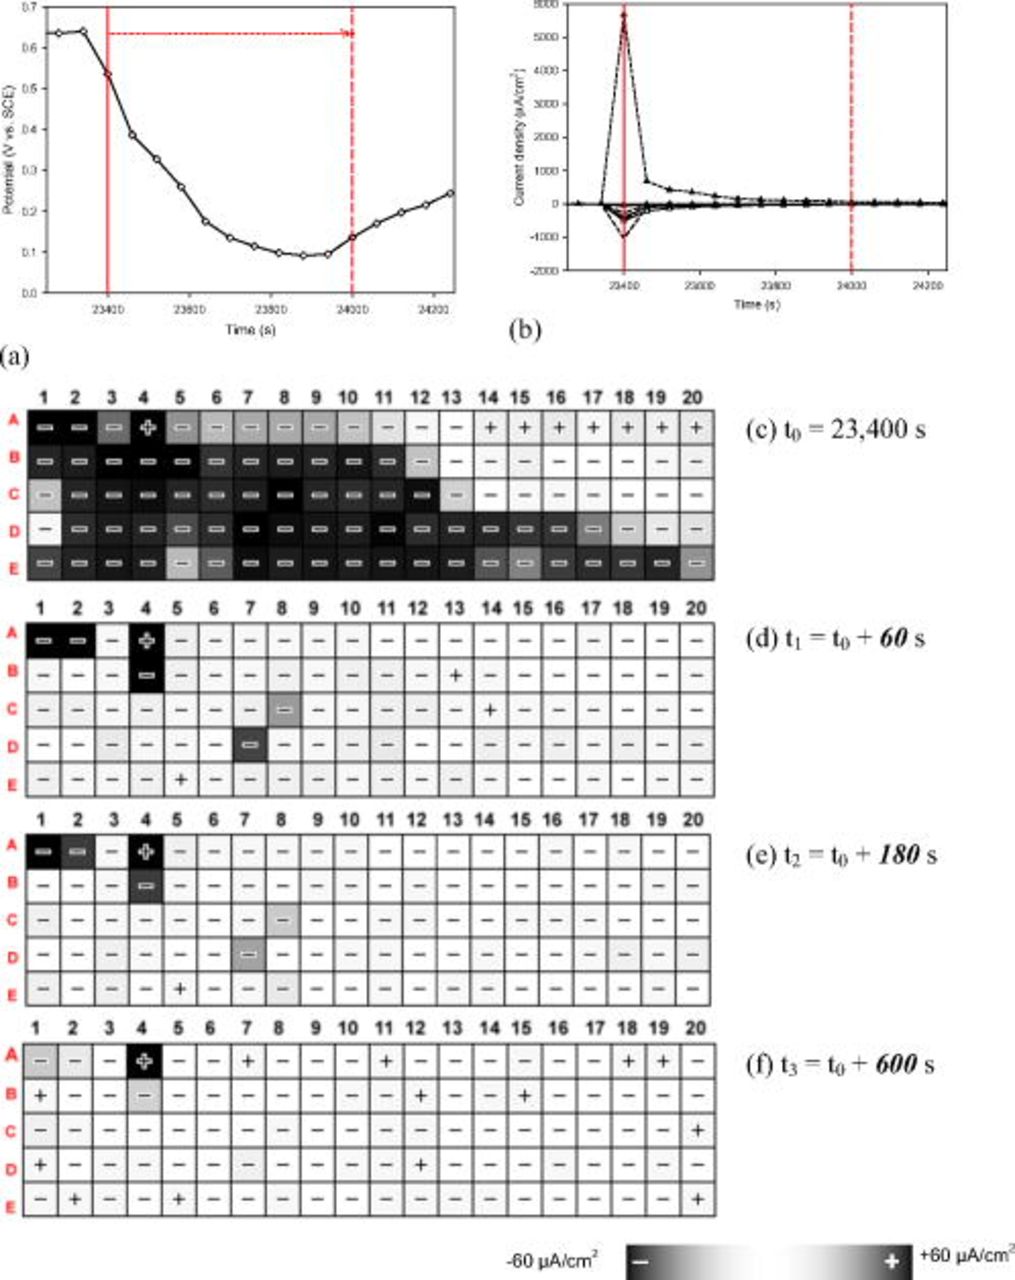
Figure 5. OCP, selected current densities, and current maps on the sixth day when pitting occurred on electrode (4,A) in pH 10 ESDW with 5 ppm  and 2 ppm
  .
.
This phenomenon was verified by a second experiment under the same test conditions. The OCP and selected current vs time behavior during the sixth day is shown in Fig. 6. Each potential drop from the potential–time series (Fig. 6a) corresponds to a sharp increase in anodic current from the current–time series (Fig. 6b), which indicates that a pitting event occurs on a single electrode. An increase in anodic current on any other electrodes [e.g., (5,A)] was accompanied by a sharp increase in cathodic current on electrode (3,B) (Fig. 6c), which had been severely pitted before. The relative magnitude of the cathodic current on electrode (3,B) was a reflection of the pitting current on other electrodes. A larger pitting current on another electrode was offset by a stronger cathodic current from electrode (3,B), although the absolute magnitude of the peak cathodic currents on electrode (3,B) was approximately 1/10th of the peak pitting currents due to the contribution of cathodic currents from nonpitted electrodes ( other electrodes). When the pitting current reached its peak
  at time
  on electrode (18,C) (Fig. 6b), the cathodic current peaks from three previously pitted electrodes [(14,A), (3,B), and (14,D)] added up to
  , which was about 30% of the peak anodic current.
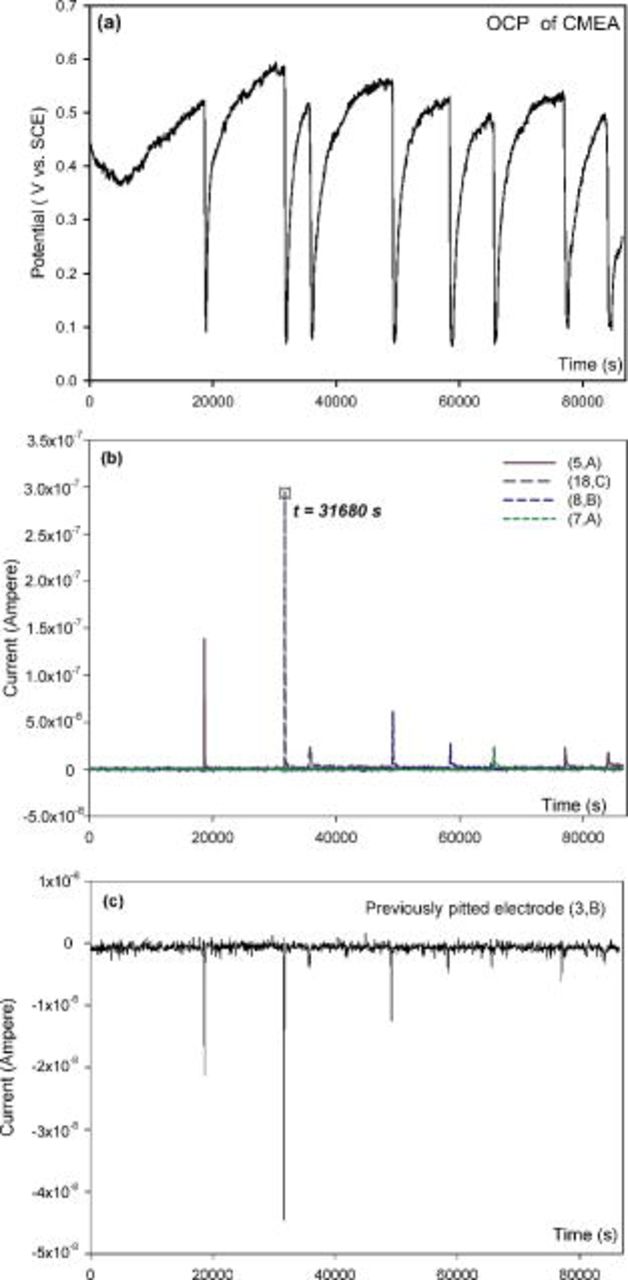
Figure 6. (a) OCP behavior of the whole CMEA, (b) current behavior of four pitted electrodes, and (c) current behavior of strong cathode electrode (3,B) throughout the sixth day during a 6 day exposure experiment in pH 10 ESDW with the addition of 5 ppm  and 2 ppm
  . Electrode (3,B) has been severely pitted in the early stage of this experiment.
The SEM images of both pitted and nonpitted electrodes from the above experiment are shown in Fig. 7a. EDS analysis on the pitted electrodes (Fig. 7b) shows that both chloride and sulfate were included in the corrosion products. The exact identity of oxides over pits is determined in pit propagation studies. Particles containing calcium and oxygen were observed on the nonpitted electrodes (Fig. 7c), which are probably due to the precipitation of  . This suggests that there are local high pH spots likely indicative of cathodic reactions such as oxygen reduction reaction; yet, localized concentration cell corrosion is not apparent under the overall chemistry conditions. EDS analysis of the nonpitted electrode indicates that the copper surface was most probably covered with copper hydroxide/oxide. The inclusion of Cl and S in the corrosion products in the pitted areas is evidence of a substantial pH gradient between pitted and nonpitted sites as the solubility of hydroxychloride and hydroxysulfate salts of
  only becomes less than the hydroxide or oxide at subneutral pHs under normal water chemistry conditions.33 This could also be important in helping to deduce the pit initiation and propagation mechanism and in applying it to real water cases. These SEM/EDS results also contradict Lucey's findings that
  was detected only within the corrosion product mounds above the copper pits in drinking water.5
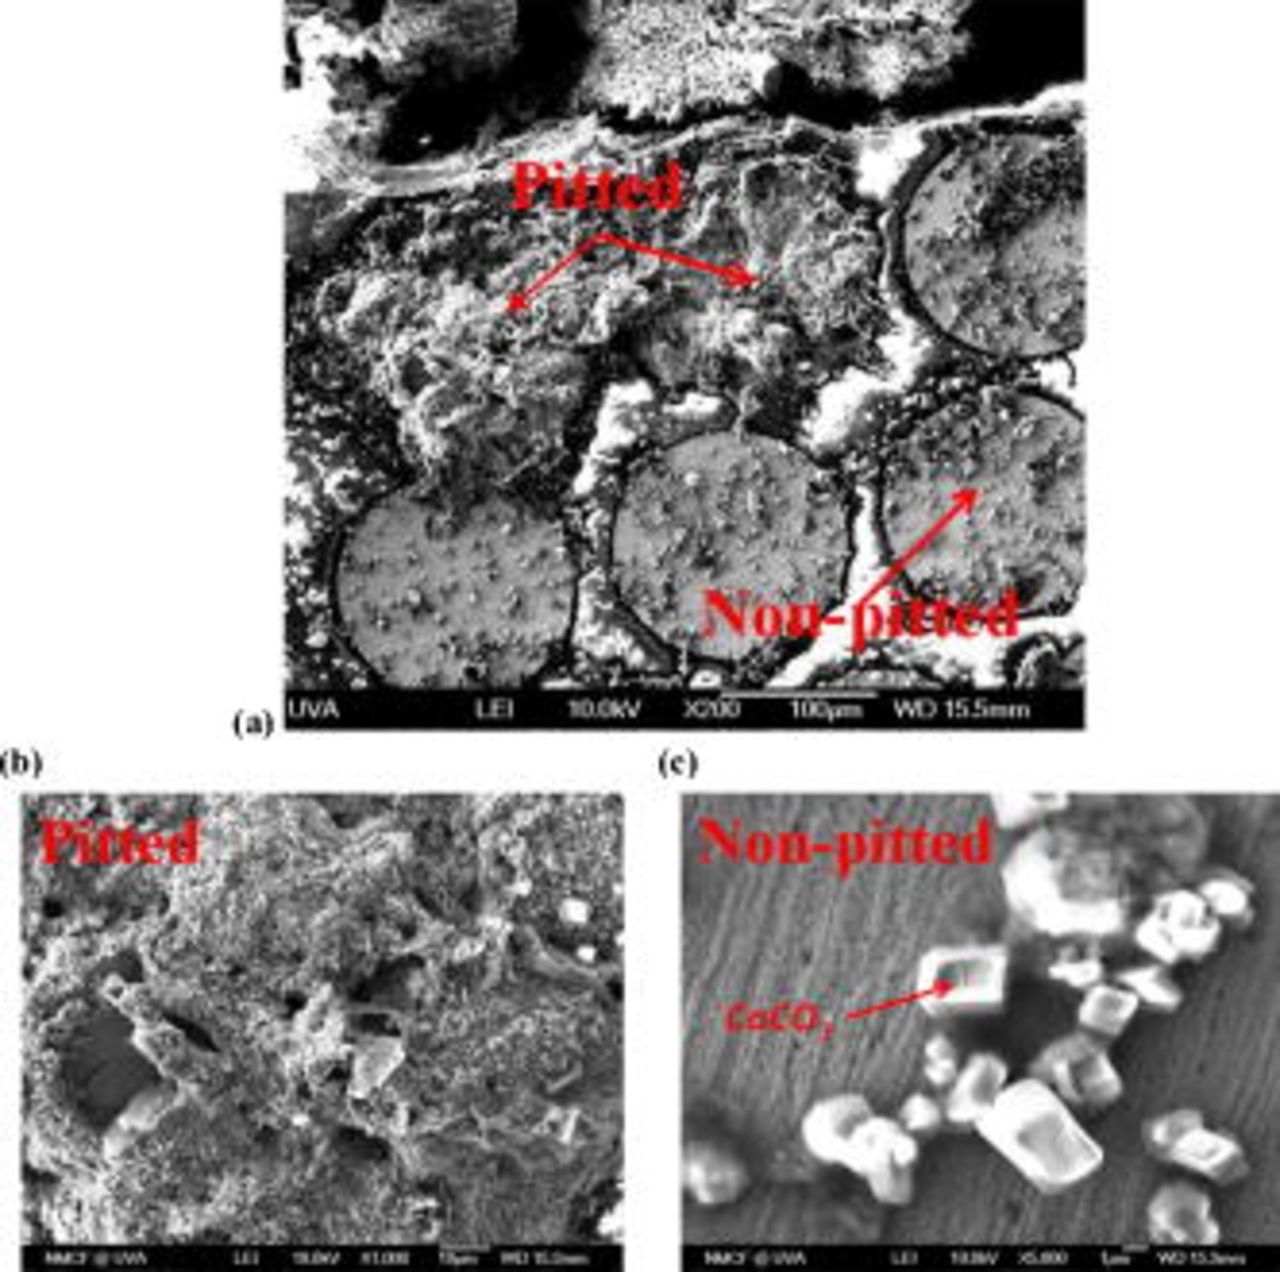
Figure 7. SEM images of (a) part of the CMEA, (b) part of a severely pitted electrode, and (c) part of a nonpitted electrode in pH 10 ESDW with 5 ppm  and 2 ppm
  for 6 days.
Potential and current behaviors of copper at different pH levels
The OCP and current behaviors of copper CMEA in ESDW with the addition of 5 ppm  and 2 ppm
  (first set) were compared at different pH levels: pH 6, 7, 8, 9, 9.5, and 10. Uniform corrosion (nonpitting) was dominant in pH 6 ESDW, and no pitting events were observed even after 5 ppm
  was added (Fig. 8). The OCP remained below the Nernst potential for
  . In contrast, the OCP fell in between the Nernst potentials of
  and
and  at pH 7, and a few pitting events were observed from the current–time series (not shown here). Pitting was the predominant corrosion in pH 9 ESDW and occurred frequently (Fig. 9). The OCP rose above the Nernst potential of
  . A significant increase in OCP to above
  was observed on a copper CMEA in pH 10 ESDW with 5 ppm
  , and pitting occurred (Fig. 10).
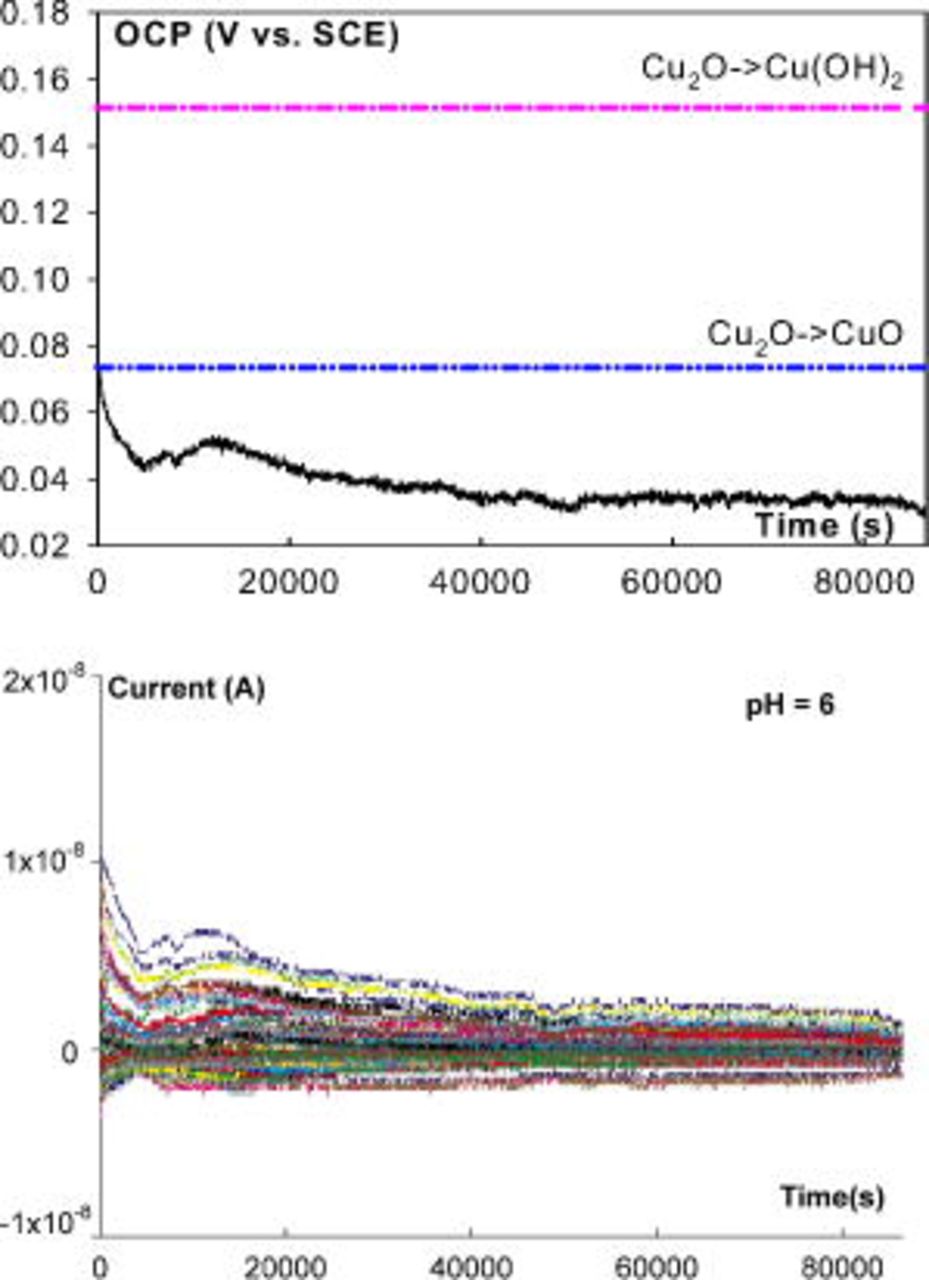
Figure 8. OCP and current (from 100 electrodes) behavior of CMEA in pH 6 ESDW on the sixth day with the addition of 5 ppm  and 2 ppm
  (first set).
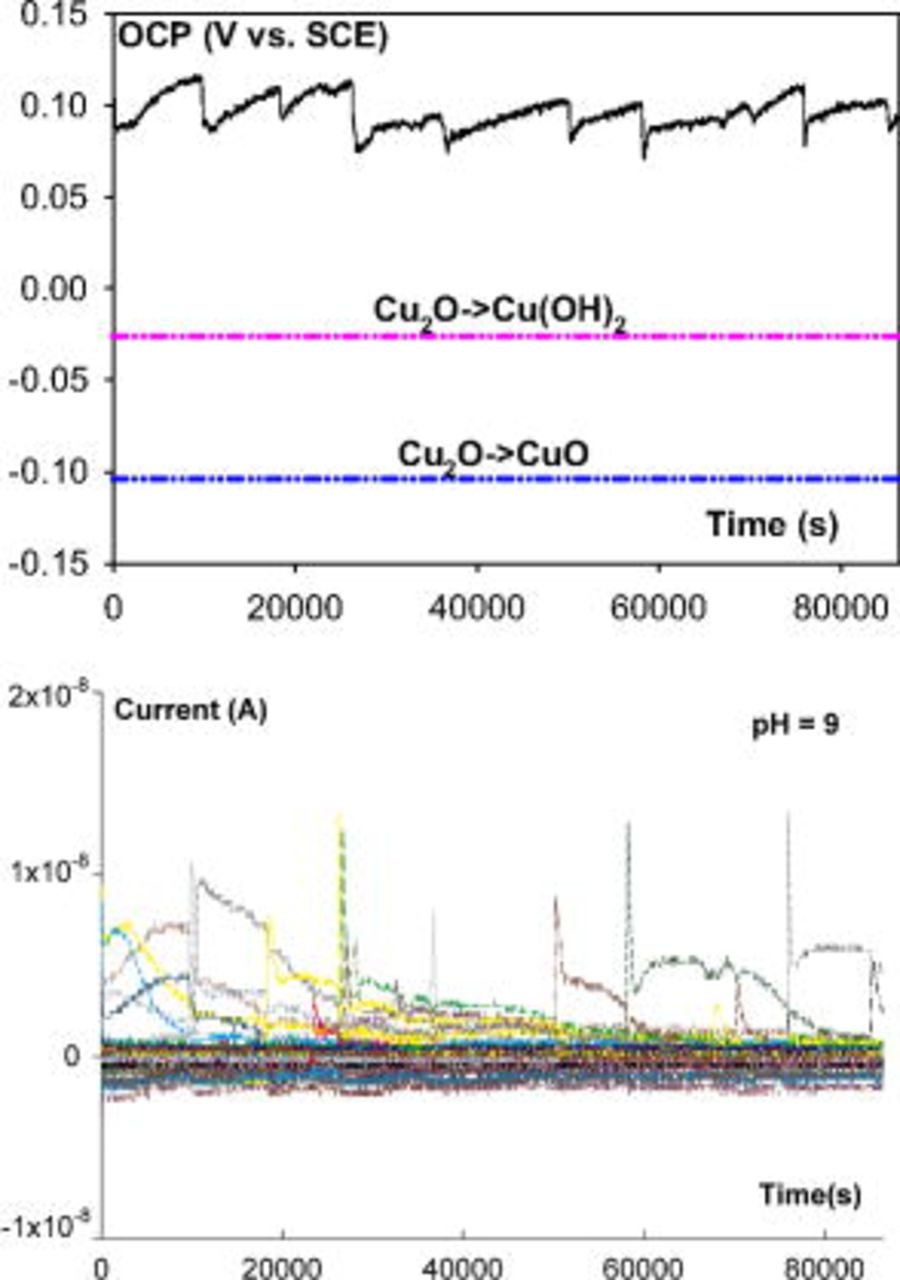
Figure 9. OCP and current (from 100 electrodes) behavior of CMEA in pH 9 ESDW on the sixth day with the addition of 5 ppm  and 2 ppm
  (first set).
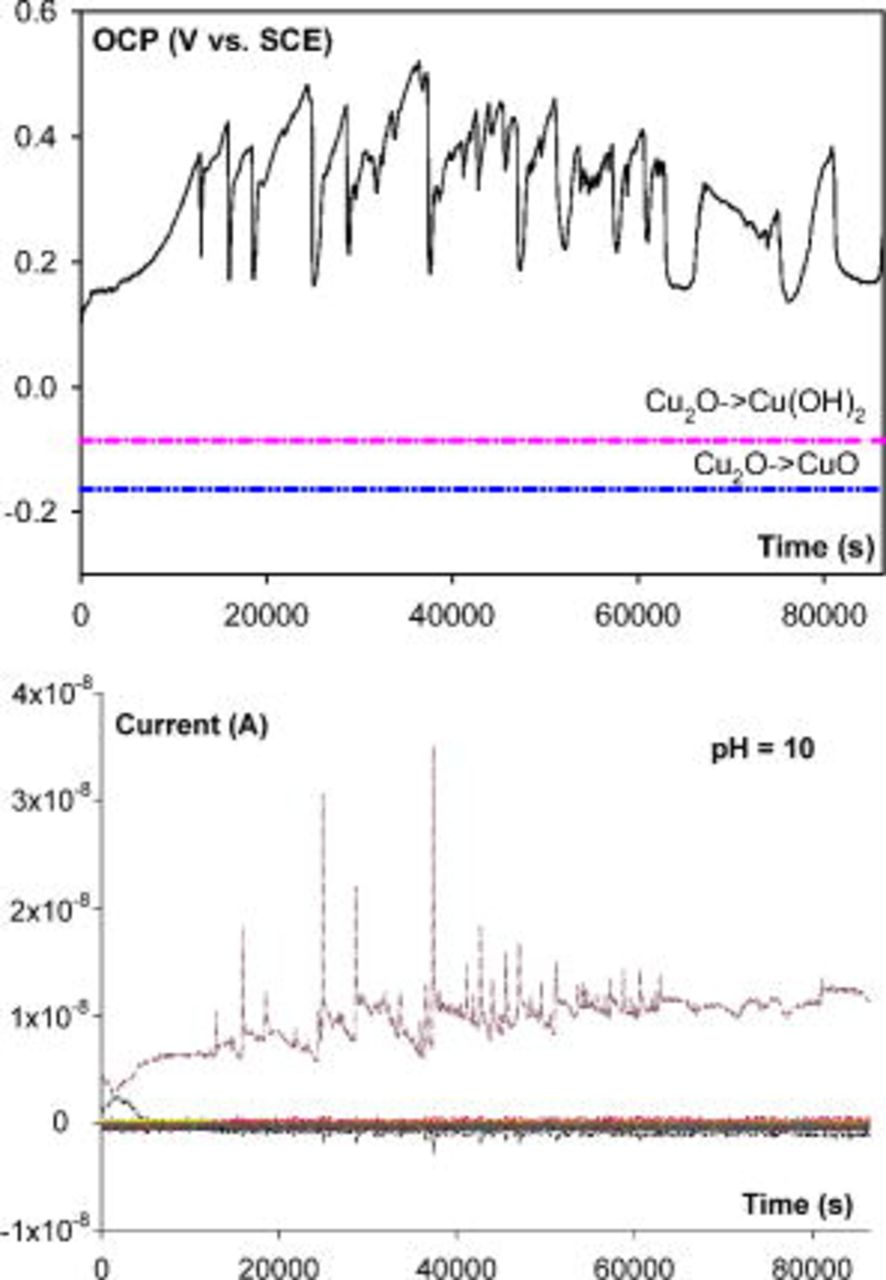
Figure 10. OCP and current (from 100 electrodes) behavior of CMEA in pH 10 ESDW on the sixth day with the addition of 5 ppm  and 2 ppm
  (first set).
Figure 11 indicates that the maximum OCP ( during a 24 h period) of copper CMEA in ESDW with 5 ppm
  and 2 ppm
  (first set) increases with pH. The same trend was observed between
  and pH from CV results,2 although
  measured by CMEA did not rise above the CV-based
  from pH 7 to 10. The difference between
  and
and  is approximately the same at all pH. However, as shown in Fig. 11, the maximum OCP at pH 9.5 lies within three standard deviations
  of the mean
  (99.7%) based on 21 CV experiments in deaerated pH 9.5 ESDW, assuming a normal distribution of
  .2 Therefore, it can be concluded that natural pitting can occur once the maximum OCP rises up to within three standard deviations of
  (99.7%) and exceeds
  .
.
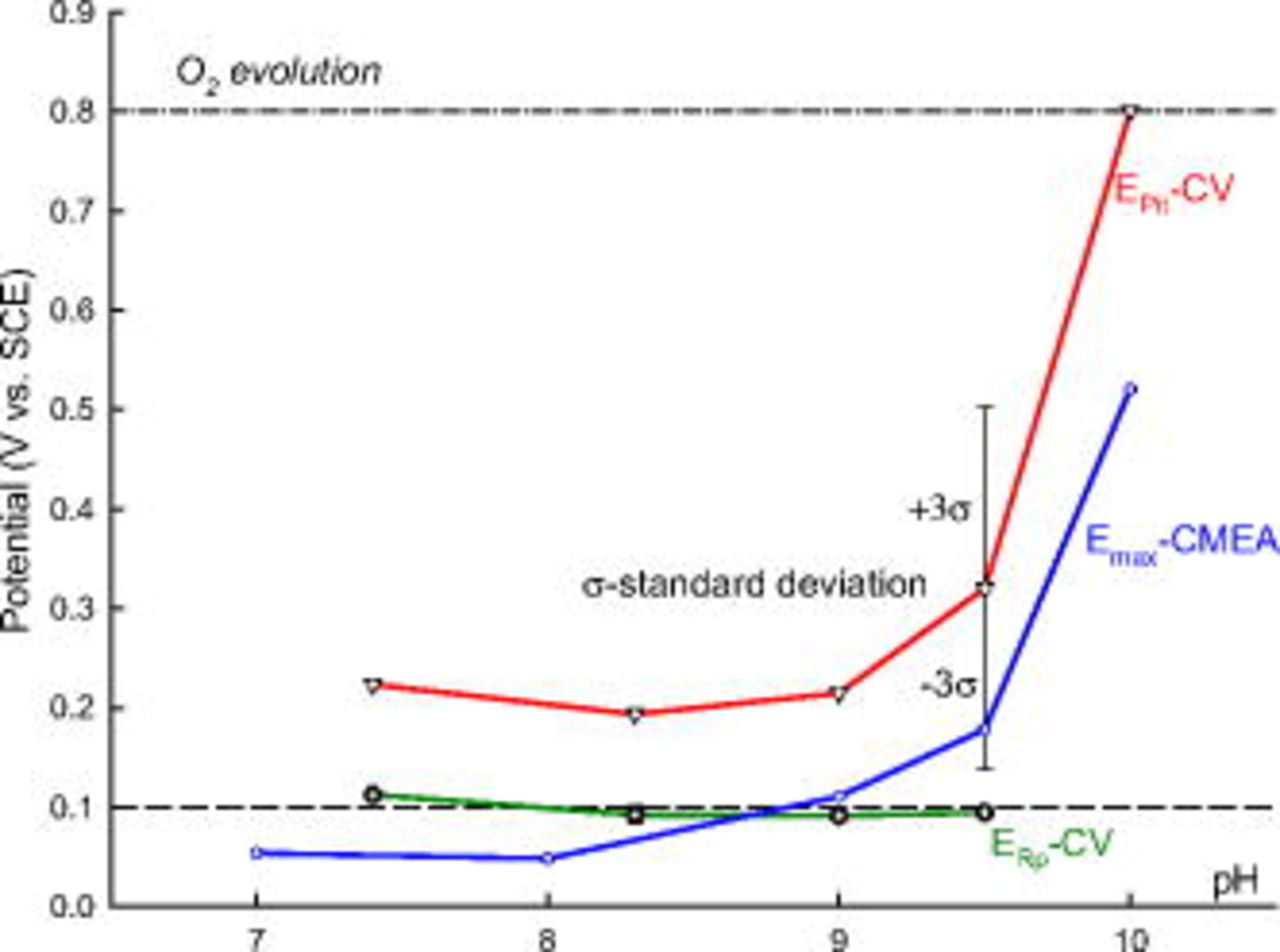
Figure 11. Comparison between mean  and
and  based on CV experiments and maximum OCP
  on the sixth day from CMEA experiments (first set) in pH-adjusted ESDW with 5 ppm
  and 2 ppm
  . The dashed line at
  is the critical potential proposed by Pourbaix.33 Error bars of three standard deviations
  are shown for
  at pH 9.5 based on 21 CV experiments.
The cumulative probability of  and
and  of the OCP of a copper CMEA in pH-adjusted ESDW with the addition of 5 ppm
  and 2 ppm
  (second set) was analyzed at different pH levels (7–10). A bimodal distribution of
  was observed at pH 10, as shown in Fig. 12. Although CV results indicated that pitting was unlikely to occur in pH 10 ESDW (
 , oxygen evolution), CMEA experiments showed that copper pitting occurred under naturally corroding conditions when OCP rose to approximately
  .
.  was normally distributed and lay between the
  predictions by empirical equations.2 Large potential drops as high as
  were also observed in this situation. Figure 13 shows that in pH 9 ESDW,
  and
and  of a copper CMEA fell in between 0 and
  , close to the region defined by two
  predictions, or
  .2 However,
  never approached
  , defined either by CV results or by the empirical equation. Both
  and
and  were normally distributed, and the difference between them was less than 0.1 V. At pH 8 and 7,
  and
and  lay in the
  range defined by two empirical equations and were normally distributed. They were close to each other and never rose near
  .
.
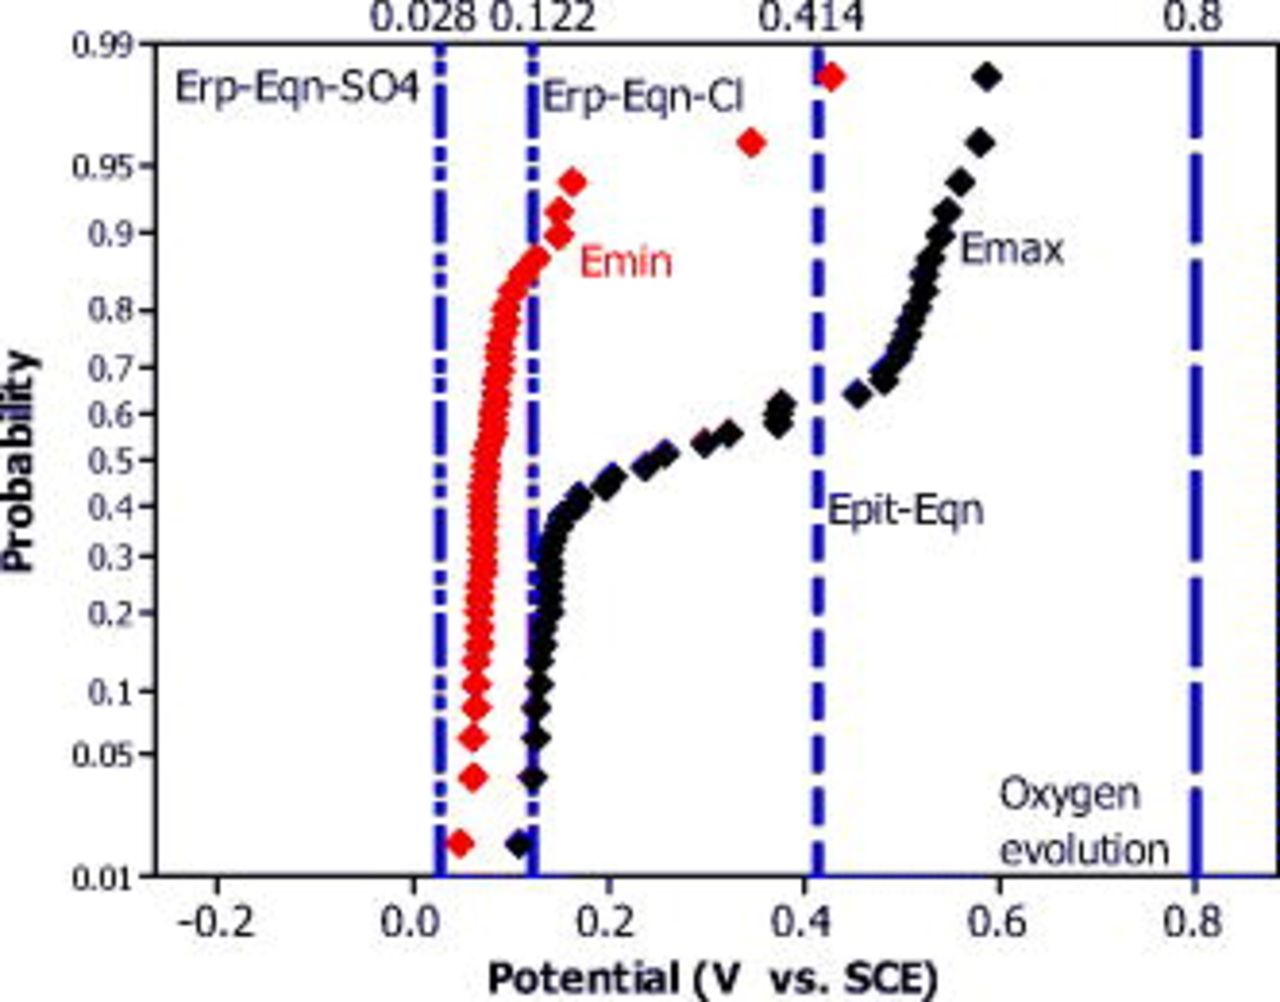
Figure 12. Cumulative probability of  and
and  obtained from Cu CMEA over a 6 day exposure experiment in pH 10 ESDW with 5 ppm
  and 2 ppm
  (second set). Calculated
  and
and  by empirical equations2 are also shown for comparison.
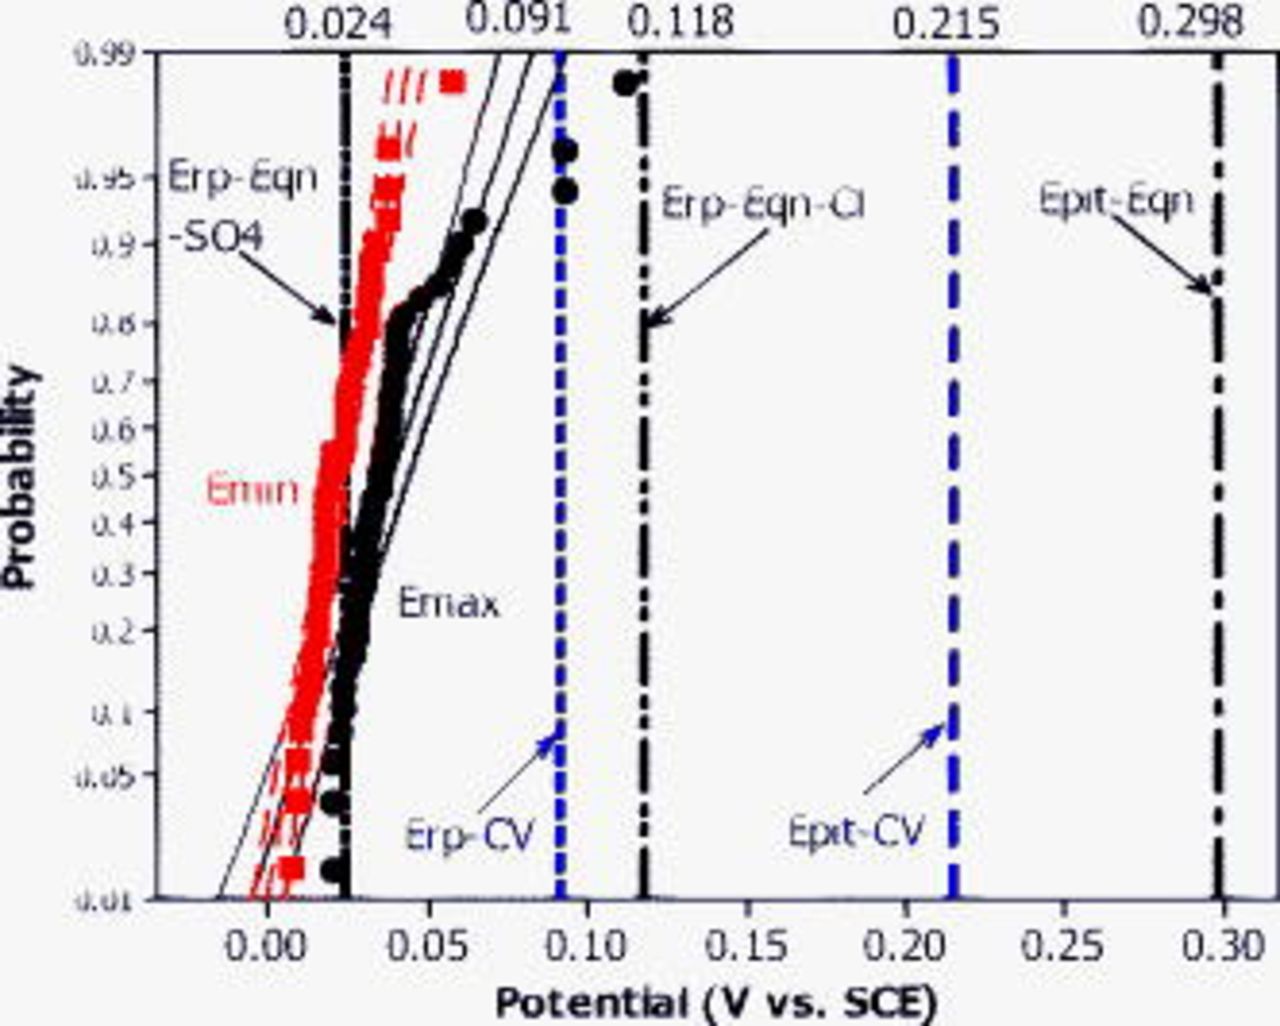
Figure 13. Cumulative probability of  and
and  obtained from Cu CMEA over a 6 day exposure experiment in pH 9 ESDW with 5 ppm
  and 2 ppm
  (second set). Mean
  and
and  obtained by CV in deaerated pH 9 ESDW are also shown. Distribution fit and 95% confidence interval are shown for both curves. Calculated
  and
and  by empirical equations are compared here as well.
To summarize, pitting was observed in pH-adjusted ESDW under freely corroding conditions when  , and repassivation occurred when
  . However,
  never reached the CV-based
  values. The maximum OCP observed in the second set of experiments is summarized in Table I.
  lies in the range from
  to
to  in ESDW from pH 7 to 9. By comparison, in pH 10 ESDW, 5 ppm free
  was able to increase
  to approximately
  . Previous CV results indicate that the oxygen evolution occurred before pitting on copper in pH 10 ESDW due to the strong inhibiting effect of
  , which raised
  substantially.2 However, CMEA results show that pitting occurred on copper in pH 10 ESDW because of a significant OCP rise under freely corroding conditions. Nonetheless, the pitting severity was greatly reduced at pH 10 after reaching its greatest severity at pH 9, as demonstrated by the total anodic charge and PF analyses discussed below. This result cannot be predicted by the driven electrode CV method.
Table I. Comparison of selected parameters from CMEA experiments related to copper pitting at different pH levels with 5 ppm  and 2 ppm
  (second set).
| pH | 7 | 8 | 9 | 10 |
|---|---|---|---|---|
 
| 0.069 | 0.078 | 0.112 | 0.587 |
 (mC) (mC) | 0.878 | 1.054 | 2.741 | 0.400 |
 
| 0.039 | 0.038 | 0.064 | 0.207 |
 
| 1.81 | 2.41 | 1.89 | 4.20 |
 (mC) (mC) | 0.166 | 0.221 | 0.174 | 0.384 |
| PF | 5.3 | 4.8 | 15.8 | 1 |
 : maximum OCP during 6 days;
  : maximum total anodic charge;
  : average OCP during 6 days;
  : passive uniform dissolution current density;
  : total passive uniform dissolution charge;
  .
.
Cumulative probability analysis of total charge at different pH levels
As demonstrated by the artificial-pit experiments, the severity of pitting can be evaluated based on the cumulative probability of the total anodic charge on each single electrode. Figure 14 shows the result of CMEA experiments in pH-adjusted ESDW (pH 7–10) with the addition of 5 ppm  and 2 ppm
  for 6 days (second set). The intensity of pitting corrosion increased with pH from 7 to 9. However, pitting corrosion intensity decreased as pH was further increased to 10. The gradual change in slope at pH 7 indicates the insignificance of pitting events relative to uniform dissolution. In contrast, a distinct change in slope at pH 9 suggests two different corrosion mechanisms: Passive uniform dissolution occurred on 90% of the total electrodes with minimal current and charge
  , while pitting corrosion was highly localized on 10% of the total electrodes associated with high current and charge
  . The change in slope at pH 8 was more noticeable than that at pH 7, but it was less distinct than that at pH 9. The maximum hemispherical pit radius estimated by the total anodic charge for the second set of experiments is shown in Fig. 14 as the secondary
  axis.
axis.
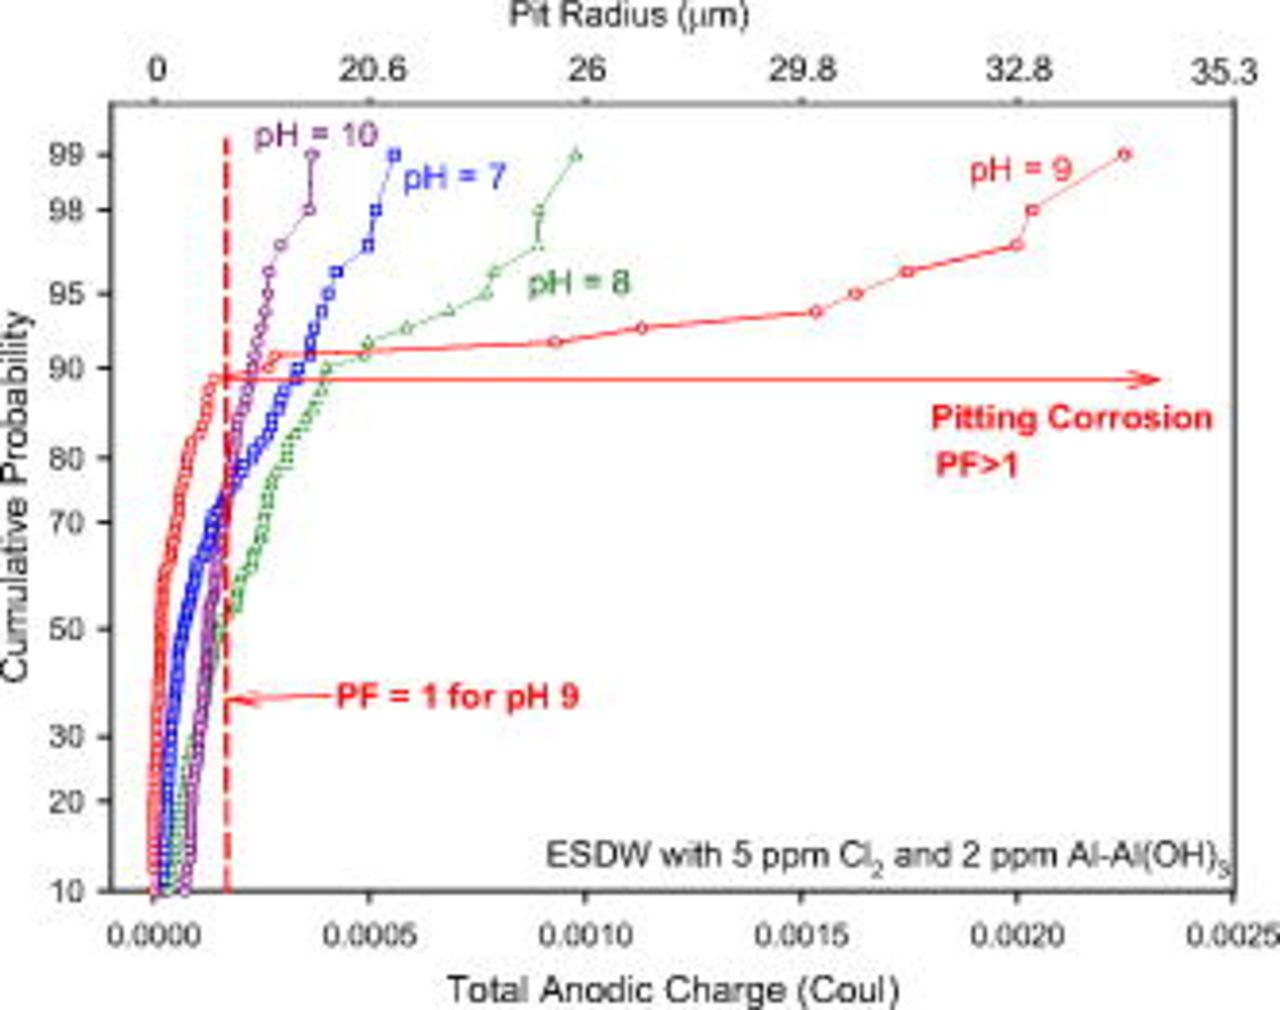
Figure 14. Cumulative probability of the total anodic charge of copper CMEA electrodes in pH-adjusted ESDW (7–10) with 5 ppm  and 2 ppm
  for 6 days (second set). Pitting corrosion occurred on 10% of the total electrodes with
  at pH 9.
The maximum total anodic charge at different pH levels for the second set of CMEA experiments is also summarized in Table I, together with the PFs calculated according to Eq. 3. A higher maximum total anodic charge and a greater PF were found at pH 9, indicating highly localized pitting corrosion at this pH. The PFs at pH 7 and 8 are approximately one-third of those seen at pH 9. The lowest PF was found at pH 10, which indicates that pitting is insignificant compared to passive uniform dissolution at this pH.
Discussion
Passive film formation on copper surfaces in pH-adjusted ESDW by CMEA method
The CMEA provides a unique opportunity to study copper corrosion at different pH levels under natural conditions. CMEA simulates a planar copper electrode surface; yet, the current behavior can be separately inventoried and analyzed. The ability to address the current separately enables CMEA to distinguish pitting corrosion from uniform corrosion. Severity of pitting (e.g., pit depth/volume and PF) can be assessed by a simple charge analysis on the persistent anodes compared to the overall corrosion rate of all electrodes based on the current measured. Moreover, the electrochemical behavior of any electrode of interest (persistent anode/cathode) can be investigated independently by various electrochemical techniques (e.g., EIS, CV, potential pulse, and potentiodynamic scan).
The OCP measurement in pH 6 ESDW (Fig. 8) shows the OCP stabilized between  and
and  after 5 ppm
  was added (first set). This is above the narrow potential range for
  in pH 6 water (
 to
to  of
of  system), and
  is the thermodynamically dominant species at OCP.34 Hence, the copper surface was not passivated, and uniform dissolution occurred. The OCP fell in between the Nernst potentials of
  and
and  in pH 7 ESDW after 5 ppm
  was added and several pitting events occurred. A layer of CuO (possibly hydrated with the formula of
  ,
,  ) may form on top of the
  inner layer. X-ray photoelectron spectroscopy studies indicate that the outer layer of the duplex film formed on the copper surface should be considered to be
  (i.e.,
  ,
,  ) film due to a strong OH contribution.35 A dual-layer passive film
  forms on the copper surface at
  based on the OCP measurement (Fig. 9 and 10) and previous CV results.2
The formation of copper carbonate minerals (e.g., malachite or azurite) is not considered here because only copper oxide (possibly the hydrated form) was detected by EDS on nonpitted electrodes (Fig. 7c). Moreover, no blue/green colored spots were observed on nonpitted electrodes by optical microscopy, which is the characteristic color of copper minerals (e.g., malachite and brochantite).36 However, long-term pit propagation experiments to be discussed in a subsequent paper explore the detection of malachite and brochantite as these are likely in long-term experiments. Brown color on a nonpitted electrode indicates the formation of copper oxide/hydroxide. This also agrees with Adeloju and Duan's findings that bicarbonate inhibits copper pitting corrosion by stabilizing the copper oxide films and preventing local acidification or alkalification of the solution at the oxide/solution interface, especially during the early stage  .37
.37
CMEA tests confirm the results of previous CV studies2 that a pre-existing passive (oxide) film is necessary for pitting to occur. Uniform dissolution with switchable anodes and cathodes dominates in the pH–potential range where no oxide/hydroxide is stable. As shown in Fig. 15, the intersection of the maximum stable OCP (first set, after 5 ppm  was added) and the Nernst potential of
  determines that uniform dissolution occurs at pH below 7, and pitting corrosion occurs at pH 7 and above.
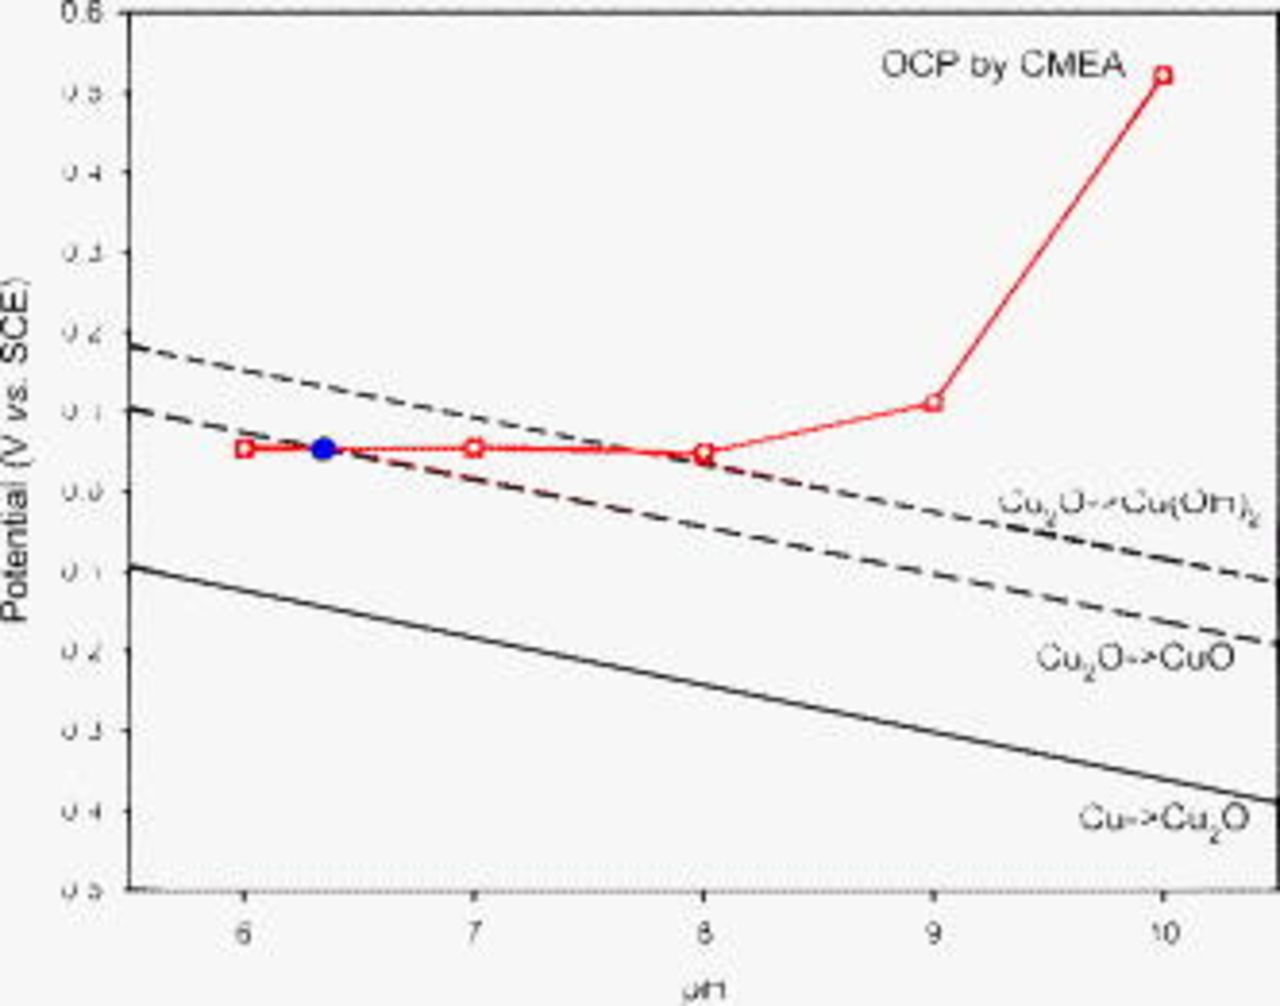
Figure 15. Maximum OCP measured by CMEA after 5 ppm  was added into pH-adjusted ESDW on the sixth day (first set). Nernst potentials corresponding to three oxide/hydroxide formation reactions are also shown. The intersection of OCP and
  line (shaded circle) indicates that pitting is unlikely to occur at
  thermodynamically.
Potential dependence of copper pitting in ESDW at different pH levels
Maxima in OCP measured by CMEA under natural conditions were found to increase with pH, and the same trend was observed for  with pH based on CV experiments (Fig. 11).2 It can be concluded that natural pitting occurred once the maximum OCP rose up to within three standard deviations of
  (99.7%) determined at a scan rate of 1 mV/s.2 A slower scan rate under driven conditions, e.g., 0.01 mV/s, may possibly decrease
  within the range of the maximum OCP.38
Another possible explanation is that natural pitting occurred when  , and repassivation occurred when
  (Fig. 11). The critical potential has been historically defined to be
  for copper wire in any drinking water.33 This potential coincides with the repassivation potential of copper in ESDW obtained from previous CV studies,2 which shows neither pH dependence nor statistical distribution (Fig. 11).
A unique pitting potential  was proposed by Szklarska-Smialowska38 and Thompson and Syrett39 as the only potential to gauge the pitting propensity of a material. This unique pitting potential corresponds to the most active value of
  and is also equal to the most noble value of
  , i.e.,
  . Twenty-one CV experiments in pH 9.5 ESDW indicate that such a unique pitting potential (
 to
to  ) might also exist in copper pitting in drinking water because the lowest
  coincides with the highest
  .2 The critical pitting potential of
  by Pourbaix20, 33 and Cornwell et al.40 and
  by Fujii et al.41 also indicate the existence of such a unique pitting potential. This unique pitting potential seems to be independent of water chemistries (pH and anion concentrations) and type of copper. Therefore, the following explanation may be proposed: Pitting corrosion of copper occurred in chlorinated ESDW when the OCP surpassed a unique pitting potential near
  .
.
The maximum OCP  of a copper CMEA observed in pH 10 ESDW is much higher than the
  observed in pH 9 ESDW
  . This may be explained by the passivation efficiency of the outer layer
  in the prior CV studies.2 It has been reported that spontaneous passivation occurs on a copper surface in pH 10 synthetic water, with the formation of a thin compact
  layer.42 Pitting did not occur in deaerated pH 10 ESDW before oxygen evolution occurred when investigated by the CV method. A passivation efficiency of 80% was found for copper in pH 10 ESDW by the CV method, while only 10% was observed in pH 9 borate buffer solutions and 0.1 M
  solution. Most copper dissolved into the solution as copper ions
  at
at  . Although thermodynamics predicts that copper oxide/hydroxide is the most stable form from pH 7 to 10 when the carbonate concentration is extremely low,34, 43, 44 this study, together with our CV results, indicates that passivation was poor below pH 10, and pitting occurred once
  (or a unique pitting potential) was reached. In contrast, when sufficient passivation was achieved in pH 10 ESDW, pitting did not occur until OCP rose much higher than
  . Better passivation upon increasing the pH from 9 to 10 contributed to the OCP rise from
  to above
  . Recurring pitting events on previously pitted electrodes may account for the observed lower
  near
near  (Fig. 12).
Alternative sources of cathodic current: Previously pitted sites
It is demonstrated that when pitting occurs on a single electrode out of a copper CMEA, the anodic current measured by a ZRA is approximately equal to the true pitting current, with negligible cathodic current contributions from cathodic reactions in or outside of a pit and from capacitive discharging. However, the current behavior on the other electrodes in the same array is affected as the OCP drops, which includes the capacitance discharging and cathodic current change. For instance, when pitting event 2 occurred on electrode (18,C) (Fig. 4b), capacitive discharge on one single electrode was approximately 0.2% of the peak anodic current, assuming a capacitance of  . When 100 electrodes are coupled together, as in CMEA, the capacitive discharge of the passive film supplies 20% of the cathodic current to offset the anodic current under freely corroding conditions.
Other reduction reactions may also supply cathodic current when pitting occurs. Previously severely pitted sites that repassivated were found in this study to have become strong persistent cathodes at later times and to supply substantial cathodic current (as high as  of the peak anodic current) to support the growth of newly formed pit sites. One possible explanation for this phenomenon is that there may be a large reservoir of
  to be reduced in addition to
  and
and  . Artificial-pit experiments were carried out to compare the cathodic currents below OCP between pitted electrodes and nonpitted electrodes via cathodic polarization. As shown in Fig. 16, cathodic polarization of an artificial pit [formed by potentiostatic hold at
  for 10 min in pH 10 ESDW with 5 ppm
  and 2 ppm
  ] shows a significant increase in cathodic current (3 orders of magnitude higher) within 0.4 V below OCP (approximately 0 to
  ), compared to the nonpitted electrode (potentiostatic hold at
  for 10 min). A possible contribution to the increasing cathodic current is the reduction of
  , as indicated by the Nernst potential in Fig. 16. In contrast, chlorine reduction is the dominant reaction on a nonpitted copper electrode. The solution chemistry inside a pit is drastically different from the bulk water chemistry.20 By considering the influence of
  only, the bottom pH and potential of a pit can be determined based on the coexistence of three solid phases, Cu,
  , and CuCl, and thus the following thermodynamic equations


The calculated pit bottom pH and potential are 2.34 and  , respectively, assuming the solubility of CuCl is
  .21 A higher concentration of chloride inside a pit would further increase the pH and decrease the potential according to Eq. 6. For example, assuming
  in the pit bottom, the calculated pit bottom pH and potential are 5.66 and
  , respectively. Thus, it is reasonable to assume that the pH at the pit bottom is in the range of 2.34–6,38 while the pH of the bulk water is 8–9 or even higher.
  is the dominant valence state of copper of higher valence state
  below pH 6 from the thermodynamic E-pH diagram. If the potential inside the pit is controlled by Eq. 7, which may vary from −0.104 to
  ,
,  (
( for
for  ) is a thermodynamically possible cathodic reaction inside the pit. As evidenced by experiments on pitted electrodes (Fig. 16), the reduction of concentrated
  near or on a pit can provide a large amount of cathodic current for a new pit. The reduction of CuO,
  , or CuCl is unlikely to happen thermodynamically inside the pit. However, there is still a possibility that other
  corrosion products beyond our consideration could also be reduced to provide cathodic current to support a newly pitted electrode. Chlorine reduction reaction is also possibly catalyzed at pitted sites compared to otherwise passivated surfaces.45 May pointed out that there is a possibility that part of the pitting current flows to cathodic areas on the walls of the copper pits nearer the entrance or to the underside of the scale for the covered pit.46 This phenomenon would have been hard to detect without using the CMEA to assess previously pitted sites.
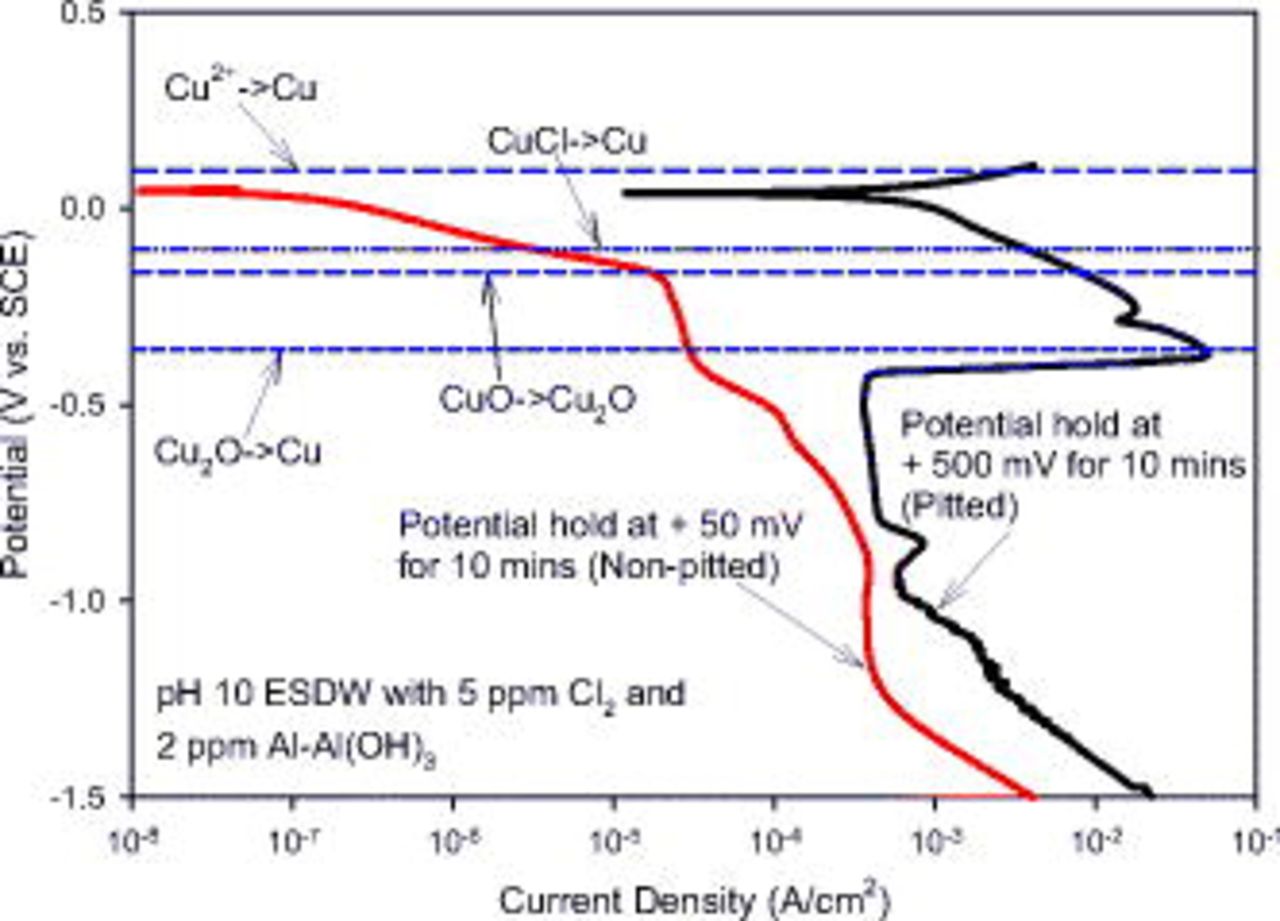
Figure 16. Cathodic polarization after potentiostatic hold at two different potentials:  (vs SCE) to simulate formation of pitted sites and
  (vs SCE) for nonpitted surfaces. The standard Nernst potential for the possible reduction reaction of
  is also shown.
Cumulative probability analysis of total anodic charge at different pH levels
Figure 14 and Table I indicate that corrosion is more localized and severe at pH 9 than pH 7 and 8. This could only be detected by the CMEA method. The information in Table I regarding the PF and pit charge could not be obtained from upward potential scans.2 Although pitting occurred in pH 7 ESDW with the addition of 5 ppm  , the frequency and magnitude of pitting events at this pH were overwhelmed by a relatively high uniform dissolution rate due to low passivation efficiency. Lytle and Schock reported that copper pitting was observed in pH 9 synthetic water with a low chlorine concentration and pH 8 synthetic water only with a high chlorine concentration. No pitting was observed at pH 6.5 and 7.36 Short-lived pits formed at pH 7 during an exposure of a few months might not be detectable by post mortem visual analysis without an advanced detection technique for pitting, such as CMEA.36
The extent of pitting corrosion as compared to uniform corrosion can be quantified by the PF, as listed in Table I. The PF at pH 9 was found to be three times higher than those at pH 7 and 8, indicating highly localized corrosion at this pH. Further increase in pH to 10 decreases the PF significantly. This may be attributed to the inhibiting effects of  and
and  in both initiation and stabilization stages of pitting as competing ions with
  and
and  . A higher total anodic charge and a higher PF indicate that pitting is most severe in pH 9 ESDW with 5 ppm
  and 2 ppm
  under freely corroding conditions.
A subsequent paper will address the role of  concentration.
  concentration certainly affects the extent of potential rise phenomena especially at high pH. However, the same trends of OCP rising with pH are seen at a lower
  concentration. If chlorine is absent, some other phenomena must account for the potential rise on passive copper at high pH. Otherwise, pitting may not be observed. However, the trends in PF with pH discussed in this paper would also be expected to operate at intermediate
  levels such as 2–3 ppm.
Conclusions
The CMEA method was shown here to be a useful technique to study copper corrosion in ESDW at different pH levels. The CMEA was successful in detecting the formation of persistent anodes on a micrometer scale compared to switchable anodes formed on this length scale, assessing pitting severity by charge analysis and PF determinations. The CMEA also enabled an interrogation of the individual electrochemical properties of persistent anodes and cathodes formed on a micrometer length scale.
CMEA experiments identified uniform corrosion as the major corrosion form of copper in low pH ESDW  , consistent with OCPs well below oxide formation potentials. These findings agree with thermodynamic calculations and our previous CV studies.2
Pitting corrosion occurred at pH 7 and above at a high chlorine level (5 ppm). However, uniform corrosion current cannot be neglected at pH 7 and 8 due to low passivation efficiency.
Cumulative probabilities of the maximum stable OCP before sharp potential drops indicated that pitting corrosion of copper occurred when the OCP rose above the repassivation potential (or unique pitting potential) in chlorinated ESDW (pH 7–10). However, this was a necessary but not sufficient criterion. Better passivation and inhibiting effects of  were observed to require a much higher
  before pitting occurred in pH 10 ESDW.
The cumulative probability of the total anodic charge and PF analysis showed that pitting corrosion of copper increases with pH from 7 to 9 in ESDW, and it is most severe at pH 9. When the pH is further increased to 10, pitting corrosion is significantly reduced. These parameters could be elucidated with the CMEA approach but not with the analysis of critical pitting potentials compared to the OCP.
Acknowledgments
Financial support from the Copper Development Association, Inc. and the International Copper Association, Ltd. is gratefully acknowledged. The insightful advice of Professor Marc Edwards at the Virginia Polytechnic Institute and State University is also gratefully acknowledged.
University of Virginia assisted in meeting the publication costs of this article.
Footnotes
- b
Neglecting capacitive discharge and local faradaic reactions at the same electrode.
- c
 for a diameter Cu electrode in deaerated pH 8 ESDW from the CV result. The potential difference is 0.17 V. Therefore, the passive uniform dissolution current density determined this way is an accurate measure of the passive dissolution rate based on ( for copper in alkaline solutions).18