Abstract
Nanocrystalline  -doped
  phosphors were prepared through a Pechini-type sol–gel process. X-ray diffraction (XRD), field-emission-scanning electron microscopy (FESEM), photoluminescence, cathodoluminescence (CL) spectra, and lifetimes were utilized to characterize the synthesized phosphors. The XRD results revealed that a pure
  phase can be obtained at
  . FESEM images indicated that the
  phosphors are composed of aggregated spherical particles with sizes ranging from 60 to 100 nm. Under the excitation of UV light and low voltage electron beams (0.5–3 kV), the
  phosphors showed the characteristic emissions of
  (
( transitions). The CL colors of
  phosphors was tuned from blue to green by changing the doping concentration of
  to some extent. The optimum blue CL of
  phosphors had better Commission International l'Eclairage (CIE) coordinates and higher emission intensity than those of the commercial product
  (blue, product no. 1047, Nichia Kagaku Kogyo Kabushiki, Japan).
Export citation and abstract BibTeX RIS
The term flat panel display unites all the noncathode-ray tubes (CRTs) direct-view displays. The flat panel displays can be further divided into liquid crystal displays (LCDs) and emissive displays.1 Although LCDs hold almost more than 50% of the market for flat panel displays, in demanding applications found in military applications, medical instruments, vehicles, and dusty environments, the weaknesses of LCDs are severe, viz., small viewing angle, limited operation temperature, relatively low brightness, and sensitivity for constant movement.2–4 Therefore, a considerable amount of research has been focused on the development of emissive flat panels. Among the emissive display technologies, field-emission displays (FEDs) have been developed as one of the most promising flat panel displays due to its potential to provide displays with thin panel thickness, self-emission, wide viewing, quick response, high brightness, high contrast ratio, light weight, and low power consumption.5, 6 Monocolor Spindt-type FEDs have been supplied to the market, and they have proven good reliability and performance since 7 years ago,7 and preparation for mass production of color FEDs had started in recent years. Fundamentally, FEDs are constructed by three elemental parts, such as micro or nanofabrication of emitters, vacuum packaging, and phosphor anodes. Each of the three elements is essential to realize FEDs with interrelationship.7, 8
FEDs must operate at significantly lower excitation voltages  and higher current densities
  than CRTs. Thus phosphors for FEDs are required to have a high efficiency at low voltages, high resistance to current saturation, long service time, and equal or better chromaticity than CRT phosphors.9 The demand for high resolution and increased efficiency in phosphors for FEDs has promoted the development of phosphors that perform at low voltages.10–14 Many efficient sulfide-based phosphors, such as
  ,
,  ,
,  , Zn(Cd)S:Cu,Al, ZnS:Ag,Cl, etc., have been explored as possible low voltage phosphors.15–18 Unfortunately, sulfide phosphors are easy to decompose and to emit sulfide gases under the electron excitation, subsequently causing the cathodes to deteriorate, thus lowering the lifetime and luminous efficiency of phosphors.19, 20 Oxide-based phosphors are more stable and environmental friendly in comparison with sulfides. Therefore, rare-earth-doped oxide-based phosphors for FEDs have been of great interest due to their excellent light output, color rendering properties, and superior stability under electron bombardment.21–23
One of the promising candidates in FEDs is the rare-earth-doped yttrium oxide  . Eu-doped
  , discovered years ago, is still considered to be one of the best red oxide phosphors, mainly because of its excellent luminescent efficiency, color purity, and stability.24 Like
  , the
, the  is also a famous host lattice material for phosphors, and rare-earth-doped
  phosphors have great potential applications in screens and displays. Unfortunately, the luminescence properties of the classical phosphors, such as
  , have been neglected for a long time. Only limited information is available on
  phosphors, and a detailed investigation on the cathodoluminescence (CL) of
  has not been performed. Accordingly, in this paper, we report the synthesis of
  -doped
  samples using a Pechini-type sol–gel process and investigate the photoluminescence (PL) and CL properties of the samples in more detail. The morphology, PL, and CL of the obtained
  samples were compared with those of the commercial products
  (blue, product no. 1047, Nichia Kagaku Kogyo Kabushiki, Japan). The CL of the
  phosphors can be turned from blue to green by changing the doping concentration of
  ion in the
  host to some extent. The optimum blue CL of
  -doped
  phosphors has better CIE coordinates and a higher emission intensity than those of the commercial product
  . Due to excellent CL and cheap materials of the prepared
  phosphors, they have great potential applications in CL devices areas, such as CRTs, FEDs, and vacuum fluorescent display devices.
Experimental
The  samples were all prepared by a Pechini-type sol–gel process.25, 26 The doping concentrations of
  was 0.03–12 atom % of
  in the
  host lattice. The stoichiometric amounts of
  and
and  (99.99%, Shanghai Yuelong Non-Ferrous Metals Limited, China) were dissolved in diluted nitric acid
  under stirring and heating. Then the citric acid and poly(ethylene glycol) (PEG, molecular
  ) were dissolved in the above solution (
 , citric acid/metal
  in per mole). The resultant mixtures were stirred for 1 h and heated at
  in a water bath until homogeneous gels formed. After being dried in an oven at
  for 10 h, the gels were ground and prefired at
  for 4 h in air. Then the samples were fully ground and fired at
  for 3 h in the mixture of hydrogen and nitrogen to produce the final samples.
X-ray diffraction (XRD) measurements were carried out on a Rigaku-Dmax 2500 diffractometer using  radiation
  . The morphologies of the samples were inspected using a field-emission-scanning electron microscope (FESEM, XL30, Philips). The PL measurements were performed on a Hitachi F-4500 spectrophotometer equipped with a 150 W xenon lamp as the excitation source. The CL measurements were carried out in an ultrahigh vacuum chamber
  , where phosphors were excited by an electron beam at a voltage range of 0.5–3 kV and different filament currents, and spectra were recorded using an F-4500 spectrophotometer. Luminescence decay curves were obtained from a Lecroy Wave Runner 6100 digital osilloscope (1 GHz) using a tunable laser (pulse
  ,
,  ) as the excitation source (Continuum Suncite OPO). All measurements were performed at room temperature.
Results and Discussion
Crystallization behavior and morphology
The XRD patterns of the  samples annealed at various temperatures (600, 700, and
  ) are shown in Fig. 1. All diffraction peaks of the
  samples annealed at the current temperatures can be basically indexed to the standard data of
  (JCPDS 05-0602), except for the samples annealed at
  (Fig. 1a). There are some weak diffraction peaks belonging to
  (JCPDS file no. 36-1481) for the samples annealed at
  . Several processes occurred during the preparation of the
  samples by sol–gel, such as the formation of the
  dry gel and the decomposition of the dry gel during sintering as follows:
  . It is reported that the hexagonal
  readily reacted with
  and
and  to form hydroxide and carbonate species when it was left in air.27–29 So
  can be formed via the reaction between the
  and
and  produced by citrate and PEG during the sintering. Finally, the pure
  phase can be obtained when annealing at a higher temperature
  . No other phase is detected, indicating that the
  ions have been successfully dissolved in the
  host lattices by replacing
  in view of their similar radii [
 ,
,  ] (where CN is coordination number).30 The crystallinity of the
  phase is improved by increasing the annealing temperature, which can be confirmed through the narrowing in full width at half-maximum (fwhm) of the diffraction peaks.
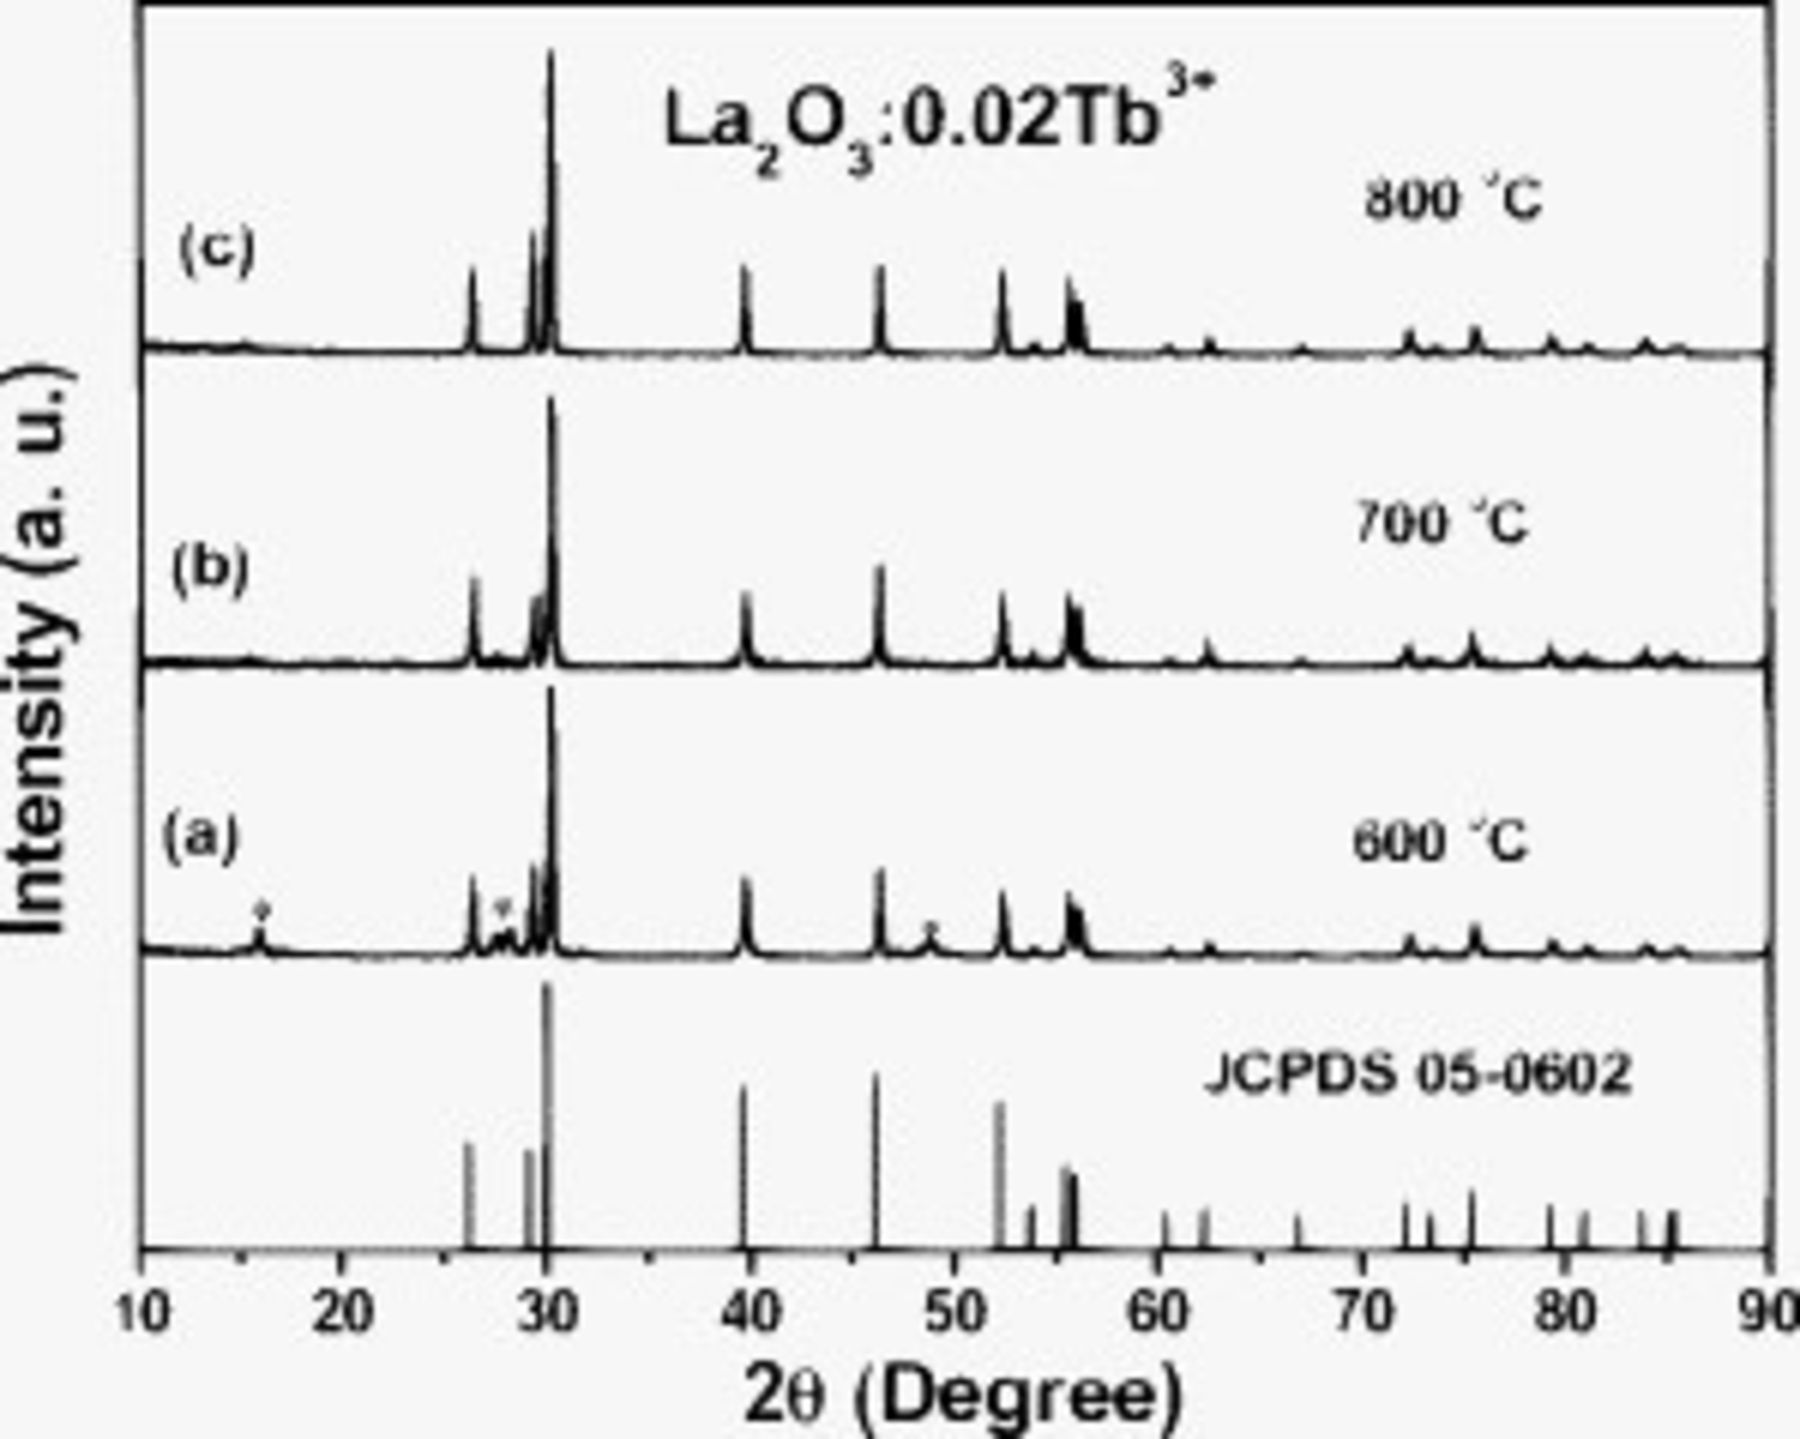
Figure 1. XRD patterns of  samples annealed at different temperatures. The standard data for
  (JCPDS no. 05-0602) is shown and is used as references.
  .
.
The crystallite size of the samples can be estimated from the Scherrer equation,  , where
  is average grain size, λ is X-ray wavelength (0.15405 nm), and θ and β are diffraction angle and fwhm of an observed peak, respectively.31, 32 The strongest peak (121) at
  was used to calculate the average crystallite size
  of the
  particles. The estimated average crystallite size is about 78 nm.
Figure 2a and 2b shows the FESEM micrograph of the  samples (Fig. 2a) annealed at
  and the
  (Fig. 2b) commercial products. It is clearly seen that the
  samples are composed of aggregated particles with sizes ranging from 60–100 nm and approximate spherical morphologies, basically agreeing with the results estimated from the Scherrer equation. The
  commercial products show large and irregular particle morphologies with extensive aggregations and wide size distributions
  . The phosphors made up of small, ideally spherical particles can offer the possibility of a brighter luminescent performance, high definition, and much improved screen packing.11 The ideal morphology of the phosphor particles includes a perfect spherical
  shape, narrow size distribution, and nonagglomeration. The spherical morphology of the phosphors is good for high brightness and high resolution. Additionally, high packing densities and low scattering of light can also be obtained by using spherical phosphors.33 It can be seen from Fig. 2 that the morphologies of the prepared
  samples are better than those of the
  commercial products.

Figure 2. FESEM micrograph of the (a)  samples annealed at
  and the (b)
  commercial products.
PL properties
Under the excitation of UV light,  phosphors show a green luminescence. Figure 3 shows the excitation and emission spectra of
  (Fig. 3a and 3b) annealed at
  . The excitation spectrum of
  (monitored by
 at 543 nm, Fig. 3a) consists of three bands at about 234 (strong), 277 (weak), and 358 nm (weak and sharp). The former two bands correspond to the spin-forbidden
  and spin-allowed
  components of the
 transition, respectively, and the third (358 nm) due to the
  (f–f) transition of
  .34, 35 Note that the energy difference between the spin-forbidden (234 nm) and spin-allowed component (277 nm) is
  , which basically agrees with the value
  reported previously in Ref. 36. Upon exciting at the
  transition at 277 nm, the
  phosphor shows a strong green luminescence (the CIE chromaticity coordinates are
  and
and  ), and the obtained emission spectrum (Fig. 3b) consists of f–f transition lines within the
 electron configuration, i.e.,
  (488 nm) in the blue region and
  (542 nm) in the green region, as well as
  (590 nm),
  (622 nm) in the red region, respectively. The strongest one is located at 542 nm corresponding to
  of
of  . Due to the cross relaxation between
  and
and  of the two neighboring
  ions, the blue emissions of
  transitions are quenched.
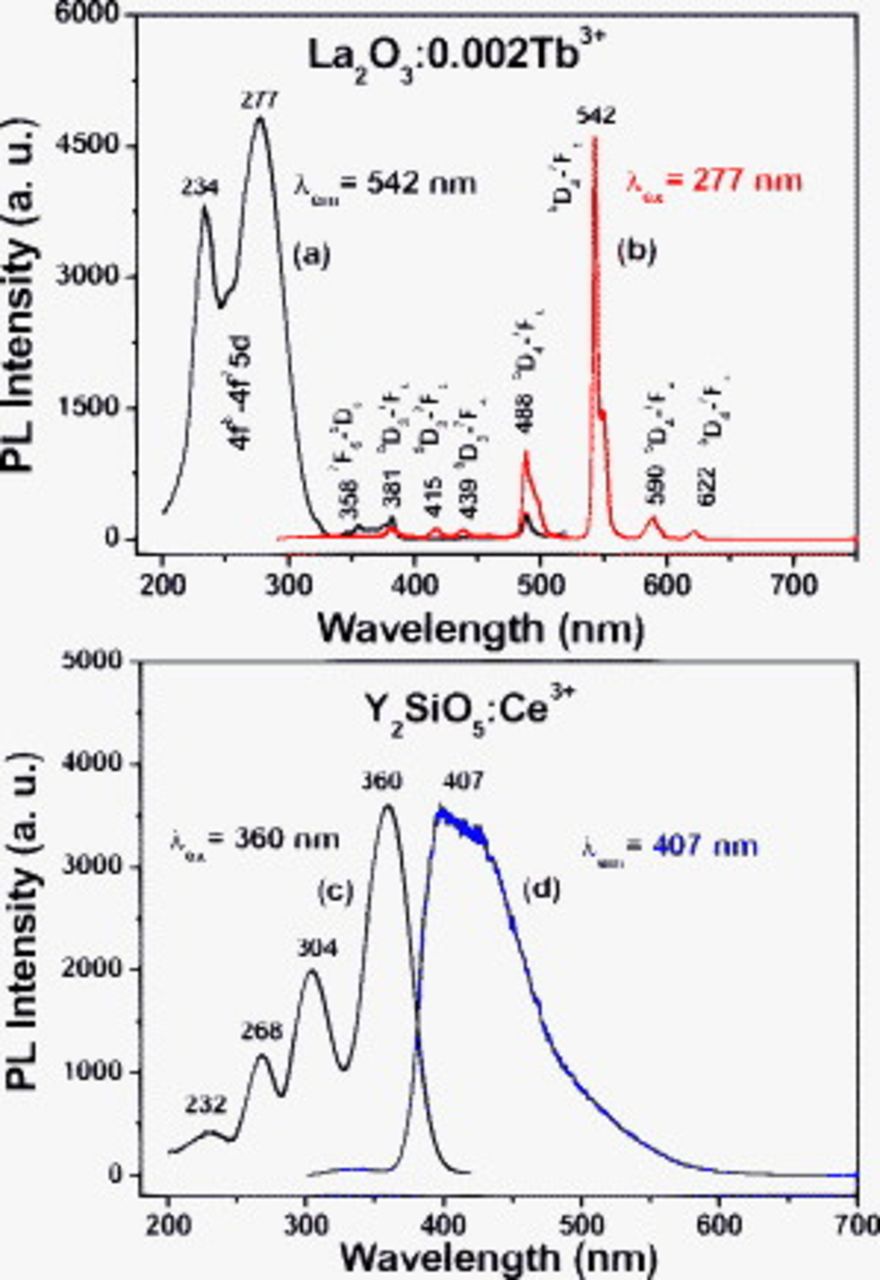
Figure 3. [(a) and (c)] PL excitation and [(b) and (d)] emission spectra of the  annealed at
  and the
  commercial products.
For comparison, the excitation and emission spectra of the  (Fig. 3c and 3d) commercial products are also shown in Fig. 3. Under the excitation of an UV light, the
  gives a strong blue emission (the CIE chromaticity coordinates are
  and
and  ). The excitation spectrum of
  (Fig. 3c, monitored by
 at 407 nm) consists of four bands at about 232, 268, 304, and 360 nm, respectively. The trivalent
  has only one electron in the 4f state. The ground state
  configuration yields two levels, viz.,
  and
and  , separated by
  due to spin-orbit coupling. The next higher state originates from the 5d state, which is split by the crystal field in two to five components and the total splitting amounts to some
  , and the 4f–5d transitions are parity allowed.36 The four excitation bands are due to the electron transitions from the ground state of
 to the crystal field splitting components of the 5d states of
  . The emission spectra consist of a broad band with a maximum at 407 nm (Fig. 3d), which is ascribed to the electron transitions from the lowest crystal splitting component of the 5d level to the ground state
 .34
.34
The PL decay curves of  and
and  in
in  and
and  phosphors are shown in Fig. 4a and 4b, respectively. The PL decay curve of
 in
in  can be fitted by a single exponential function as
  (
( is the initial intensity at
  and τ is the 1/e lifetime), from which the lifetimes of
 are determined to be 0.63 ms, as shown in Fig. 4a. The decay curve for the 5d–4f transitions of
  (Fig. 4b) can be fitted into a single exponential function as
  also. Due to the allowed character of 5d–4f transition of
  , the lifetime of
  is much shorter than that of
  (forbidden 4f–4f transition, in the order of milliseconds) and determined by the fitting as 88.0 ns.
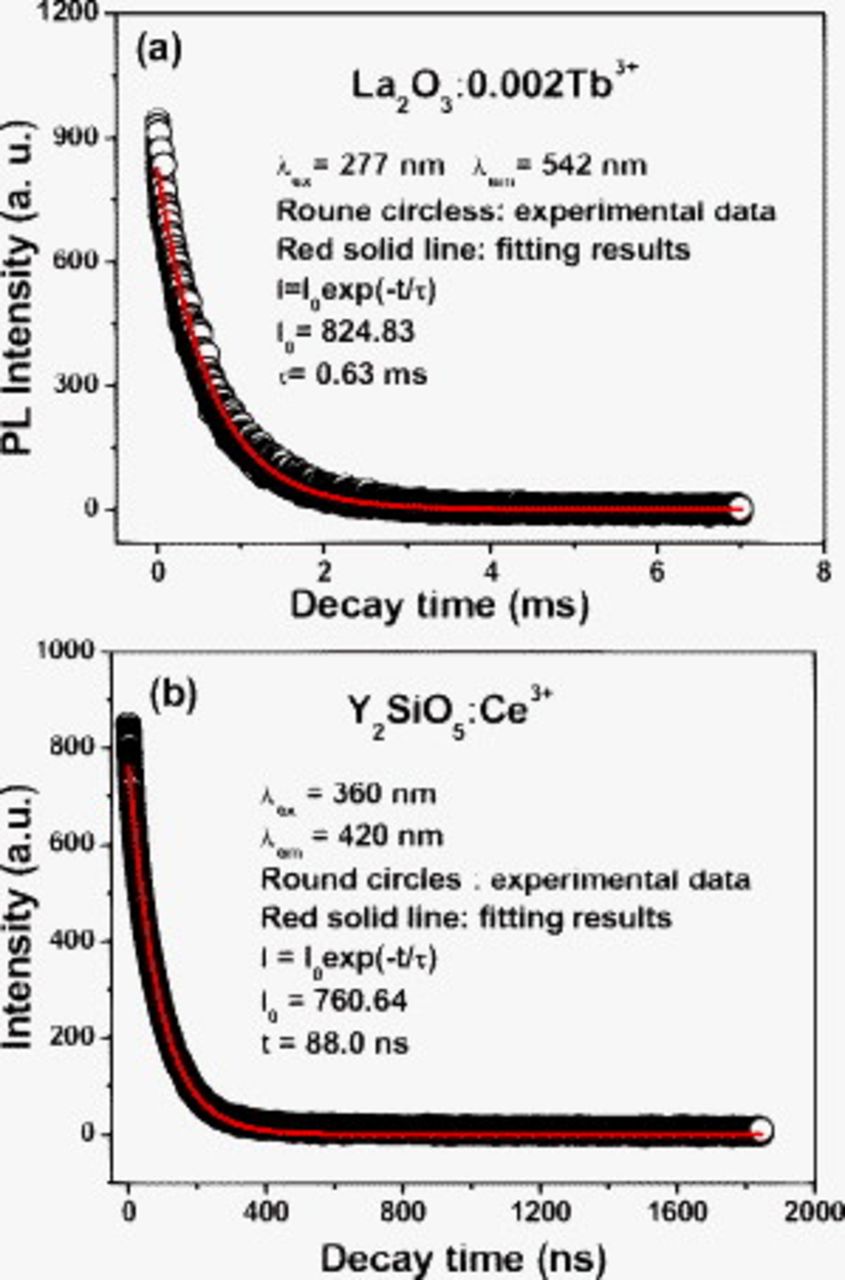
Figure 4. The luminescence decay curves for (a)  annealed at
  and the (b)
  commercial products.
The PL intensity of  has been studied as a function of their doping concentration
  in
in  samples, as shown in Fig. 5. The PL emission intensity of
  increases with the increase in its concentration
  first, reaching a maximum value at
  , and then decreases with increasing its concentration
  due to the concentration quenching effect. Thus the optimum concentration of
  is determined to be 2 atom % of
  in the
  host lattice. The concentration quenching of the luminescence is due to the energy migration among the activator ions at high concentrations. In the energy migration process, the excitation energy is lost at a killer or quenching site, resulting in the decrease in PL intensity.36
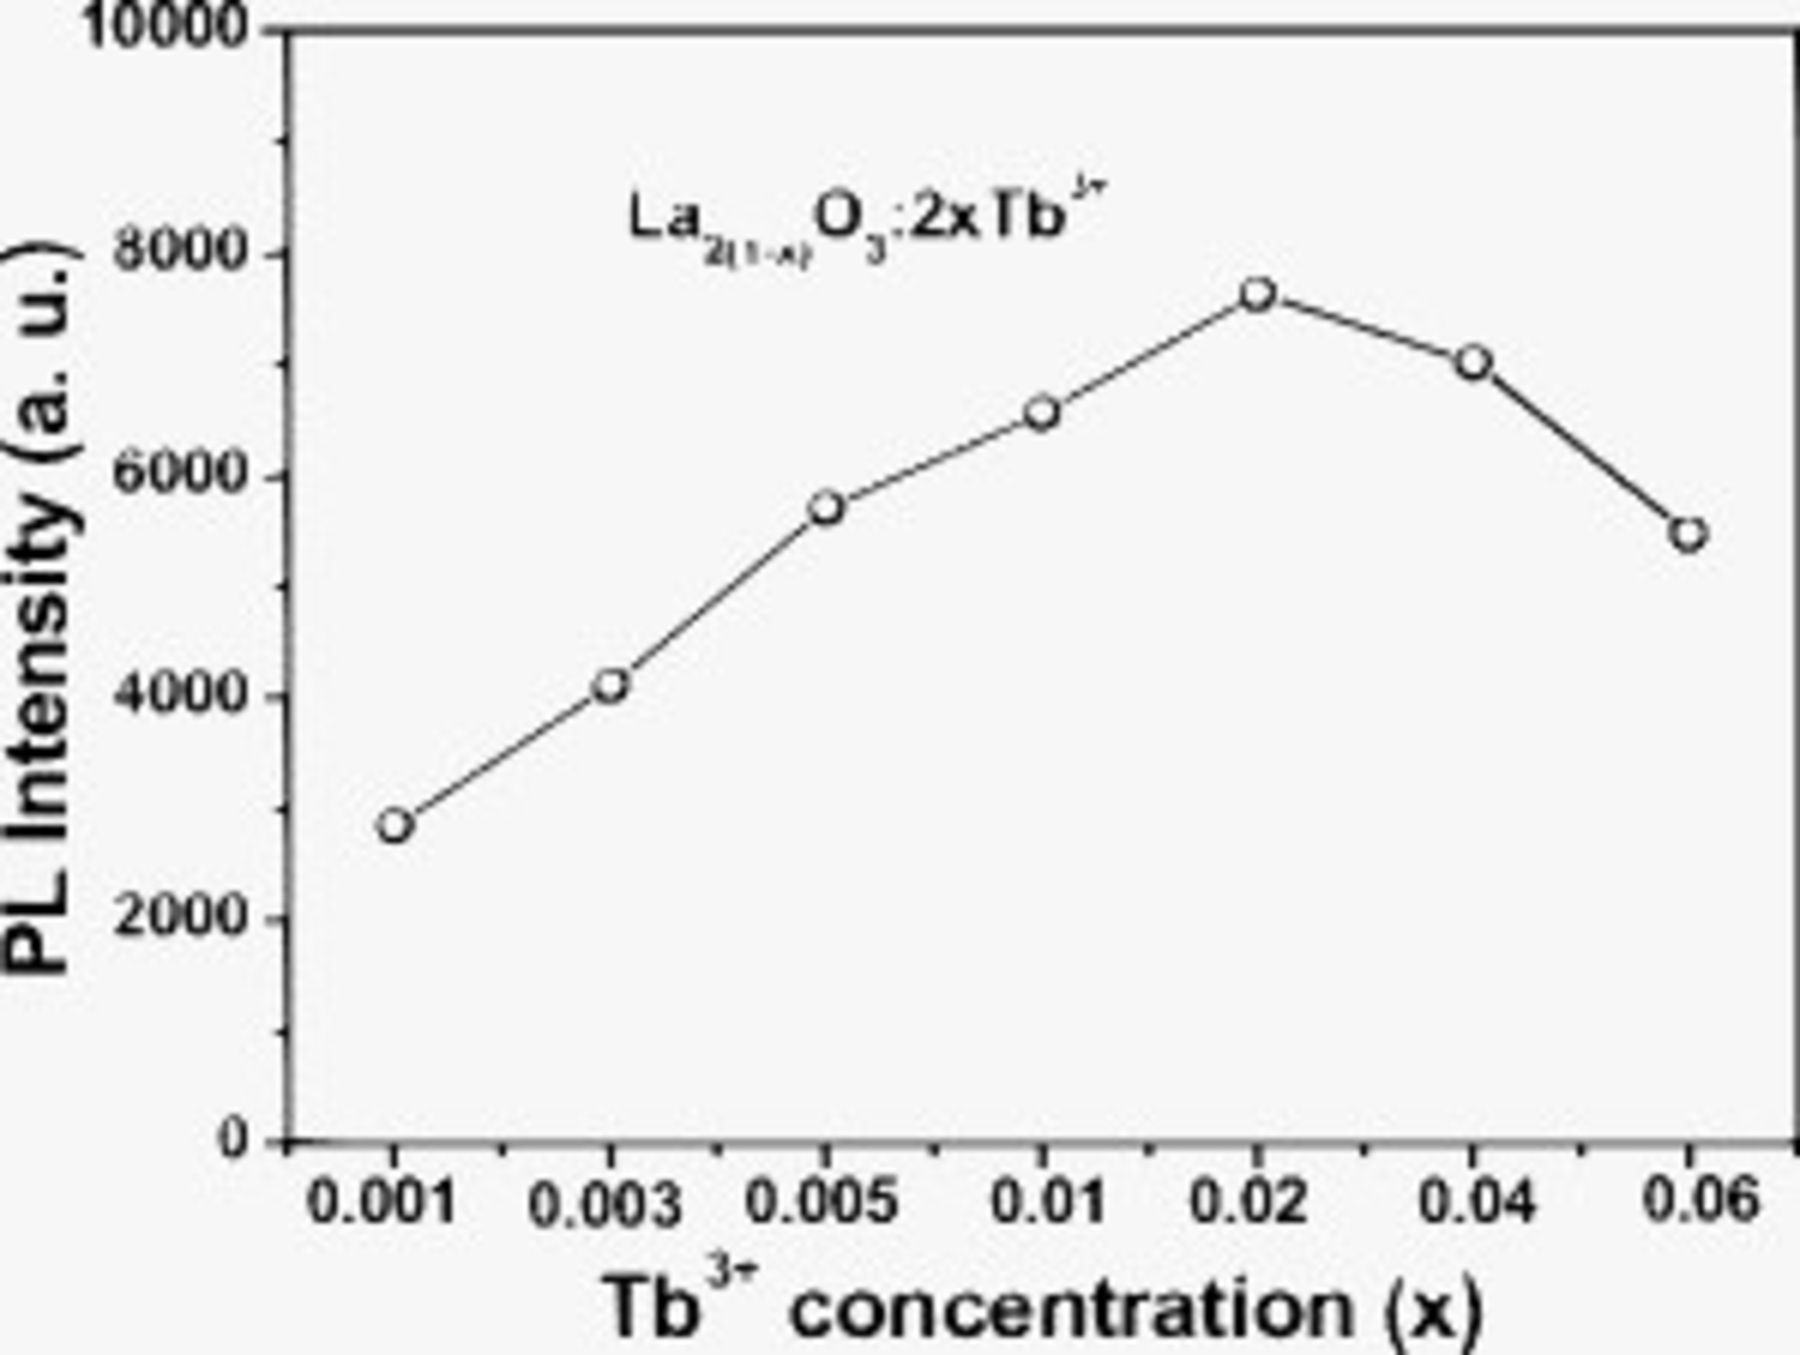
Figure 5. The PL emission intensity of  ions as a function of its doping concentration
  in
in  samples annealed at
  .
.
Cathodoluminescence properties
Under a low voltage electron beam excitation, the  phosphors show different luminescence. The CL color can be tuned by a different
  doping concentration from blue, blue-green to green. Figure 6 shows the representative CL spectra of
  phosphors with different doping concentrations of
  ions, which show the strong blue (Fig. 6a and 6b,
  ,
,  ), blue-green (Fig. 6c,
  ), and green luminescence (Fig. 6d,
  ).
).
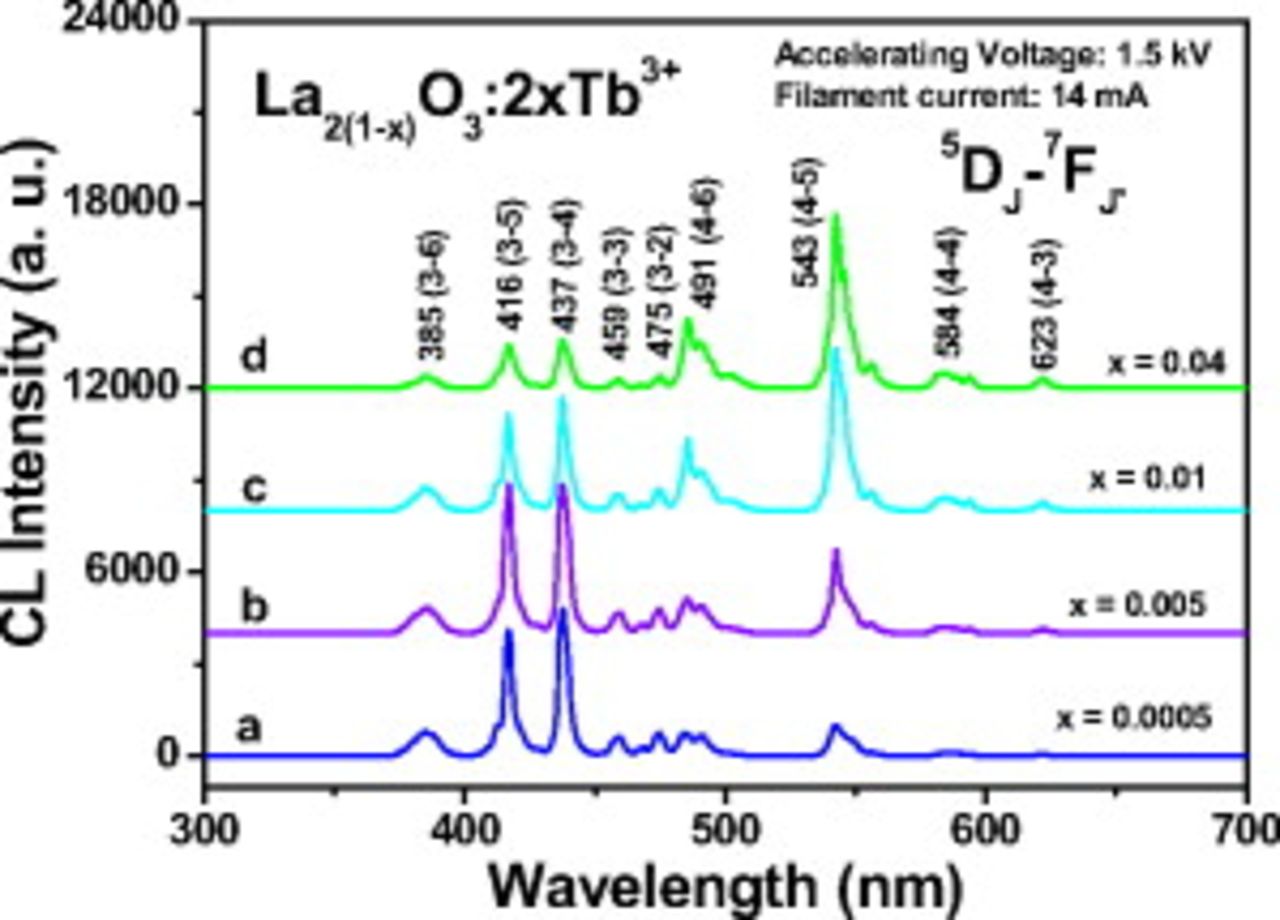
Figure 6. Typical cathodoluminescence spectra of  (
( , 0.005, 0.01, and 0.04, accelerating
  ).
).
At a low doping concentration  in
in  phosphors, under the excitation of low voltage electron beam, the obtained phosphors show a strong blue luminescence (for example, the CIE chromaticity coordinates are
  and
and  for
for  ). The emission is dominated by
  transitions (shown in Fig. 6a). When the doping concentration is high (
 in
in  phosphors), due to the cross relaxation between
  and
and  of two
  ions, the blue emission of
  transition is not as strong as that of
  transition at this doping concentration, so the emission is dominated by
  transitions (shown in Fig. 6d), and the obtained phosphors give a strong green emission (for example, the CIE chromaticity coordinates are
  and
and  for
for  ). When the doping concentration is moderate
  in
in  phosphors, under the excitation of low voltage electron beam, the
  and
and  transitions of
  have comparable intensities, and the obtained phosphors give strong blue-green luminescence (for example, the CIE chromaticity coordinates are
  and
and  for
for  , as shown in Fig. 6c). The CL color can be tuned from blue, blue-green to green by changing the doping concentration of
  ions in
  phosphors. Figure 7 shows the corresponding CIE chromaticity diagram of
  phosphors with different doping concentration of
  ions. The cross dots indicate the CIE chromaticity coordinates positions. The CIE chromaticity coordinates the change from
  ,
,  (blue) to
  ,
,  (green) by changing the doping concentration of
  from
from  to
to  in
in  phosphors. The corresponding luminescence color can change from blue, blue-green to green.
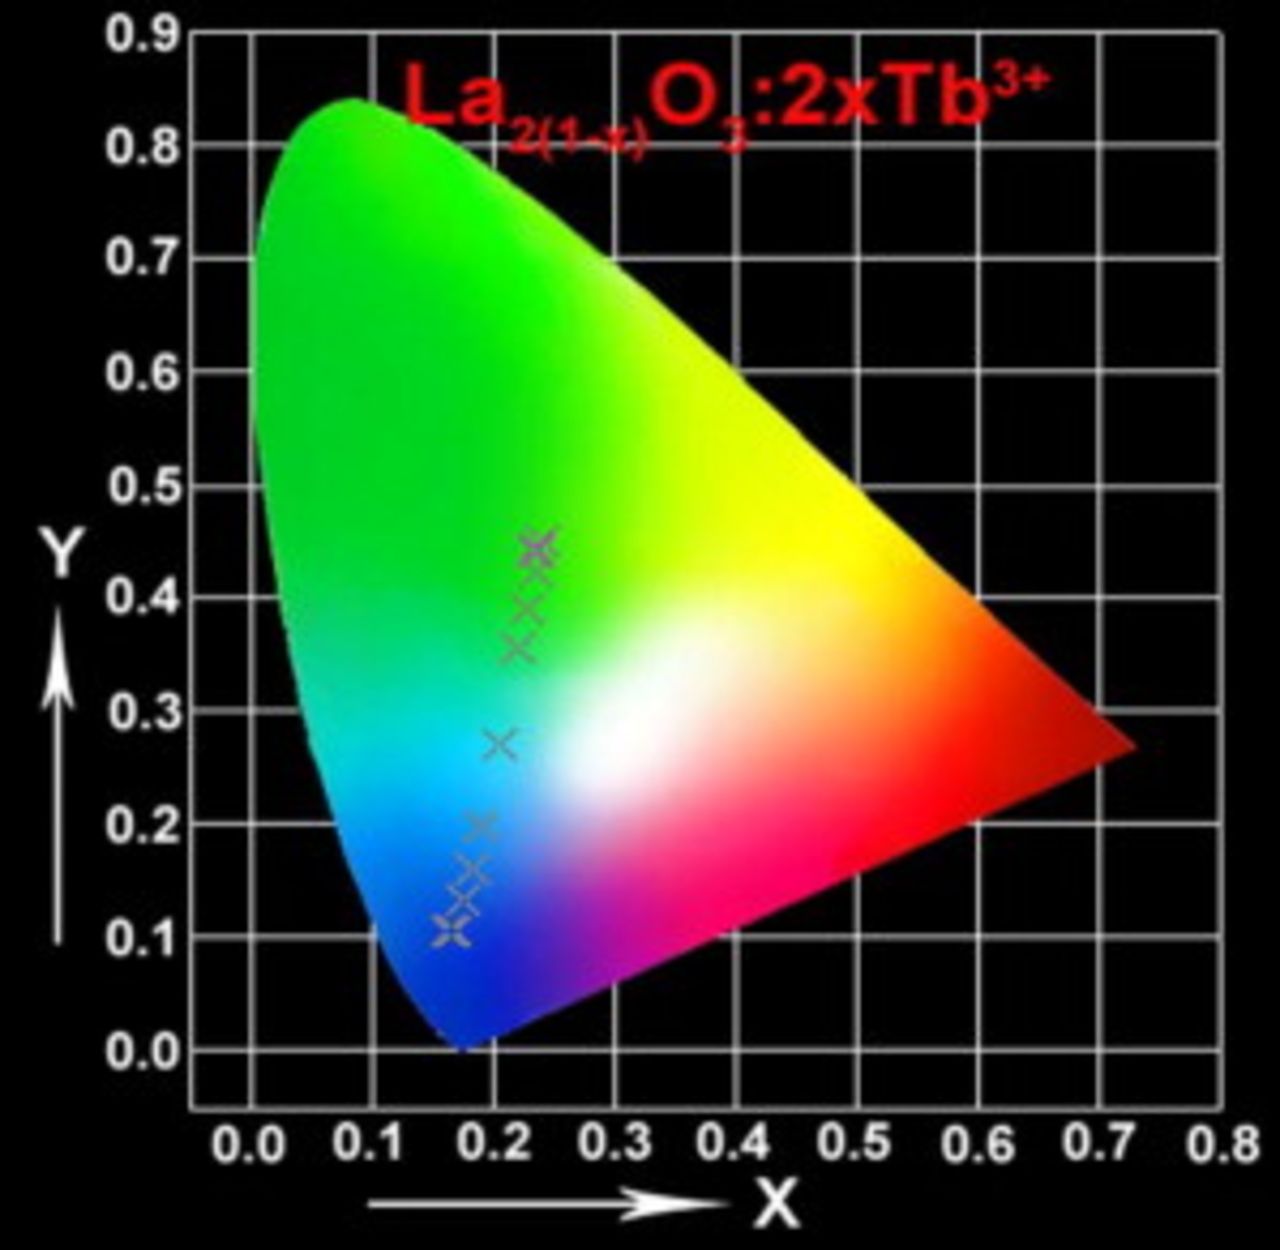
Figure 7. The CIE chromaticity diagram for the 
 .
.
The emission spectrum of  can be separated into two groups, the blue emission below 474 nm, from
 transitions and green emission above 474 nm from
 transitions, dominated by the green
  emission at 543 nm.36 Table I shows the dependence of the integrated emission intensity of
 and
and 
 and their intensity ratios
  , CIE color coordinates, and luminescence color on its doping concentration in
 phosphors under the excitation of low voltage excitation, respectively. Obviously, with the increase in the
  doping concentration, the emissions from the
  level is quenched by the cross relaxation process, i.e.,
  , accompanied by the enhancement of the emissions from the
  level.36 Furthermore, it is shown in Table I that the
  emission of
  first increases with the increase in its concentration
  , reaching a maximum value at
  , and then decreases with the further increase in its concentration
  , and the blue CIE color coordinates are more and more unsaturated when the doping
  concentration increases. Considering the luminescence intensity and CIE color coordinates of the
  -doped sample as a blue CL phosphor, the optimum doping concentration of
  is 0.1 mol % of
  in the
  system.
Table I. The variations in CL spectral data, CIE chromaticity coordinates, and emission colors as a function of  in
in  samples.

|
 (a.u.) (a.u.) 
|
 (a.u.) (a.u.) 
|

| CIE color coordinates | Emission color | |
|---|---|---|---|---|---|---|

|

| |||||
| 0.0003 | 92,782.5 | 24,945.1 | 3.72 | 0.1765 | 0.1265 | Blue |
| 0.0005 | 101,540.8 | 29,276.0 | 3.47 | 0.1762 | 0.1280 | Blue |
| 0.001 | 118,686.9 | 36,389.7 | 3.26 | 0.1753 | 0.1314 | Blue |
| 0.003 | 96,508.5 | 37,668.1 | 2.56 | 0.1826 | 0.1603 | Blue |
| 0.005 | 82,248.6 | 41,616.7 | 1.98 | 0.1905 | 0.1977 | Blue |
| 0.01 | 79,772.0 | 64,862.2 | 1.23 | 0.2043 | 0.2706 | Blue-green |
| 0.02 | 59,249.4 | 79,731.4 | 0.74 | 0.2190 | 0.3538 | Green |
Figure 8 (a, blue line) shows the CL spectrum of the  phosphor. When excited by the low voltage electron beam, the
  phosphor shows a strong blue luminescence (the CIE chromaticity coordinates are
  and
and  ), the obtained CL spectrum consists of only the
  transition lines within the
 electron configuration, i.e.,
  (385 nm),
  (416 nm),
  (437 nm),
  (459 nm),
  (475 nm),
  (491 nm) in the blue region and
  (543 nm) in the green region, as well as
  (584 nm),
  (623 nm) in the red region, respectively. Due to the low doping concentration of
  , the
, the  emission is dominated and the obtained
  phosphor gives a blue luminescence.37 For comparison, the emission spectrum of the commercial FED phosphor
  is also shown in Fig. 8 (b, black line) under the same excitation conditions. Under a low voltage electron beam excitation, the
  phosphors show a broad band blue emission from 370 to 600 nm with a maximum at 420 nm, and the corresponding chromaticity coordinates are determined to be
  ,
,  . It can be seen from Fig. 8 that the low voltage blue CL intensity (in height) of the
  phosphor is over 2 times stronger than that of the commercial FED blue phosphor
  under the same excitation conditions and the CIE coordinates (emission color) of
  are more saturated than those of
  .
.
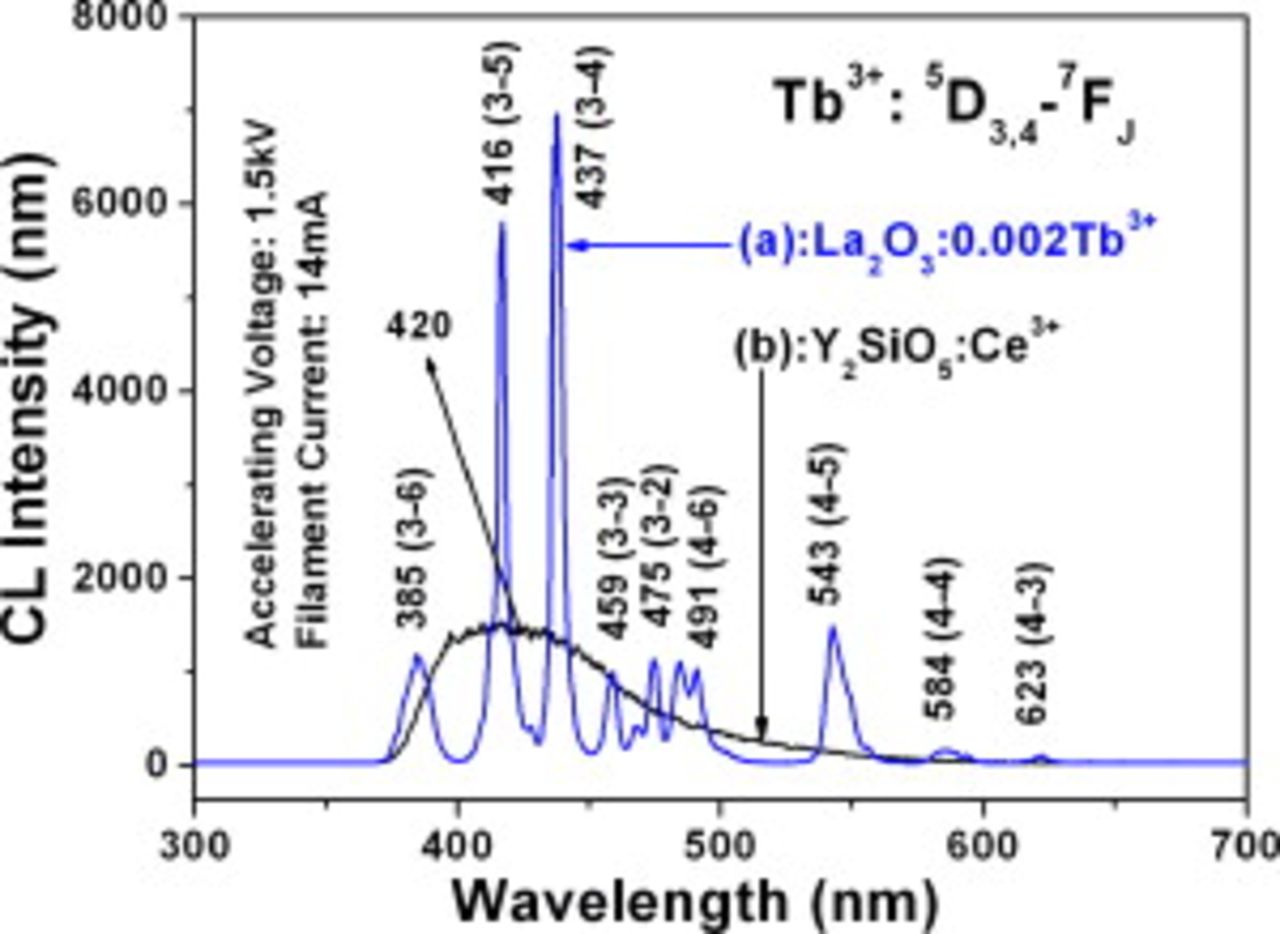
Figure 8. The emission spectra of  (a, blue line) and
  (b, black line) under the excitation of electron beam (excitation
  , filament
  ).
).
For CL, the efficiency of a luminescent material includes the radiant efficiency  and the luminous efficiency (
 , brightness).36 The radiant efficiency
  is defined as the ratio of the emitted power to the power of the electron beam falling on the luminescence. The luminous efficiency
  (brightness) is the ratio of the luminous flux emitted by the material and the absorbed power. For the
  and
and  phosphors, the radiant efficiency η and luminous efficiency
  (brightness) can be compared roughly by their emission peak areas and the CL intensity (in height), respectively.38 It can be calculated from Fig. 8 that the emission peak area (from 300 to 800 nm) of the
  phosphor (144334.3 a.u.) is similar to that of
  phosphor (144264.1 a.u.), but the CL intensity (in height) of the
  phosphor [
 (437 nm), 6422.7 a.u.] is higher than that of the
  phosphor (420 nm, 1505.5 a.u.). So the radiant efficiency η of the
  phosphor might be equal to that of the
  phosphor, but the luminous efficiency
  (brightness) of the
  phosphor might be higher than that of the
  phosphor.
The blue CL emission intensities of the  and
and  (for comparison) phosphors have been investigated as a function of the accelerating voltage and the filament current. Figure 9a and 9b shows the blue CL emission intensities as a function of the accelerating voltage and the filament current of the
  and
and  phosphors, respectively. When the filament current is fixed at 15 mA, the CL intensity increases with raising the accelerating voltage from 1.0 to 2.0 kV (Fig. 9a). Similarly, under a 1.0 kV electron beam excitation, the CL intensity also increases by increasing the filament current from 14 to 18 mA (Fig. 9b). The increase in CL brightness with an increase in electron energy and filament current are attributed to the deeper penetration of the electrons into the phosphor's body and the larger electron beam current density. The electron penetration depth can be estimated using the empirical formula:
  , where
  , and
, and  is the atomic or molecular weight of the material, ρ is the bulk density,
  is the atomic number or the number of electrons per molecule in the case compounds, and
  is the accelerating voltage (kV).39 For
  and
and  ,
,  , 132,
  , 285.8,
  , and the estimated electron penetration depth at 2 kV is about 4.6 and 6.7 nm, respectively. For CL, the
  and
and  ions are excited by the plasma produced by the incident electrons. The deeper the electron penetration depth, the more plasma is produced, which results in more
  and
and  ions being excited and thus, the CL intensity increases. From Fig. 9, it can be seen that the
  phosphors always have a higher blue CL intensity than the commercial
  phosphors under the same excitation conditions.
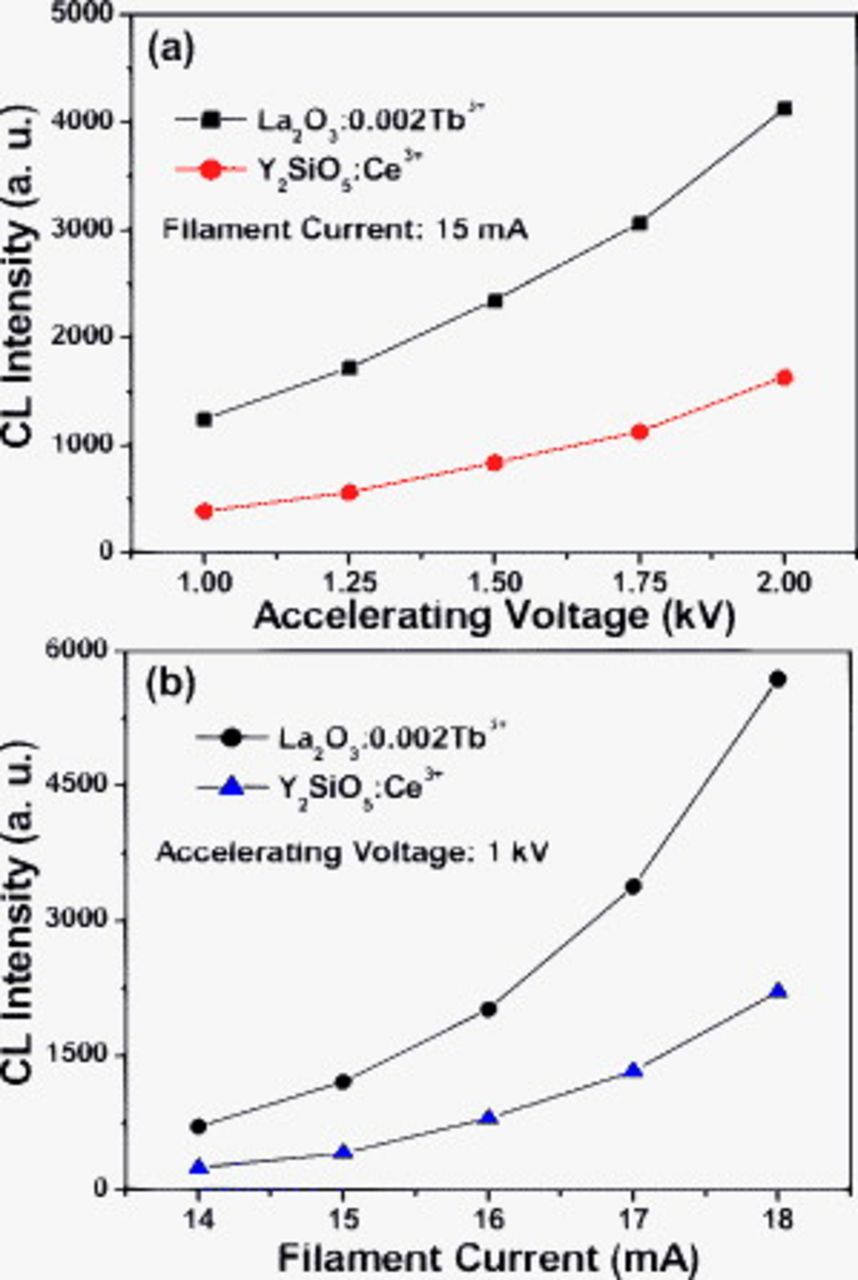
Figure 9. The cathodoluminescence intensities of the  samples and the commercial
  phosphors as a function of (a) accelerating voltage and (b) filament current.
The differences between the PL and CL properties of  can be attributed to the different luminescence mechanisms in them. In PL, the UV and/or visible light is used to excite luminescent materials. The energy of these photons are only around 4–6 eV. However, for CL, the energy of fast electrons under the accelerating of anode voltage can be tuned from a few thousands to thousands of eV. So, the excitation energy on a single particle is much larger in CL than that in PL. The UV and/or visible usually excite the activator directly; the fast electrons as a high energy particle always excite the host lattice. The phosphor
  , for example, is excited in the activator itself (the 250 nm charge-transfer band for
  ) when applied in a luminescent lamp (254 nm excitation), but in the host lattice when applied as a cathode-ray phosphor.36 The same situation may hold for
  phosphors. After penetrating into the host lattice of a luminescent material, the fast primary electrons give ionization. This ionization creates many secondary electrons. These secondary electrons can also give ionization and create many secondary electrons. So, the density of these secondary electrons is large, and all these secondary electrons can excite the host lattice and give luminescence. Due to the large excitation energy and density of the particles, the CL is different from the PL.36
Conclusions
The  phosphors were prepared by a Pechini-type sol–gel process. Under the excitation of UV light and low voltage electron beams, the prepared
  phosphors exhibit the characteristic emissions of
  . The CL color of
  phosphors can be tuned from blue, blue-green to green by changing the doping concentration of
  ion in the
  host lattice to some extent. The optimum
  phosphors show blue luminescence with excellent chromaticity coordinates and appropriate intensity, which are superior to those of the commercial FED blue phosphors
  . Due to its good morphology, strong low voltage CL intensity, and excellent CIE chromaticity, the obtained optimum blue CL
  phosphors have potential applications in FED devices.
Acknowledgments
This project was financially supported by the National Natural Science Foundation of China (NSFC 20765003), the Natural Science Foundation of the Jiangxi Higher Education Institutions of China (GJJ09180), and the Nanchang Hangkong University Doctoral Foundation.