
Abstract
Battery electrodes are composed of polydisperse particles and a porous, composite binder domain. These materials are arranged into a complex mesostructure whose morphology impacts both electrochemical performance and mechanical response. We present image-based, particle-resolved, mesoscale finite element model simulations of coupled electrochemical-mechanical performance on a representative NMC electrode domain. Beyond predicting macroscale quantities such as half-cell voltage and evolving electrical conductivity, studying behaviors on a per-particle and per-surface basis enables performance and material design insights previously unachievable. Voltage losses are primarily attributable to a complex interplay between interfacial charge transfer kinetics, lithium diffusion, and, locally, electrical conductivity. Mesoscale heterogeneities arise from particle polydispersity and lead to material underutilization at high current densities. Particle-particle contacts, however, reduce heterogeneities by enabling lithium diffusion between connected particle groups. While the porous composite binder domain (CBD) may have slower ionic transport and less available area for electrochemical reactions, its high electrical conductivity makes it the preferred reaction site late in electrode discharge. Mesoscale results are favorably compared to both experimental data and macrohomogeneous models. This work enables improvements in materials design by providing a tool for optimization of particle sizes, CBD morphology, and manufacturing conditions.
Export citation and abstract BibTeX RIS

This is an open access article distributed under the terms of the Creative Commons Attribution 4.0 License (CC BY, http://creativecommons.org/licenses/by/4.0/), which permits unrestricted reuse of the work in any medium, provided the original work is properly cited.
As lithium-ion batteries have become ubiquitous in various energy storage applications, there are still numerous concerns about safety, performance, and degradation. While these concerns are observed at the battery macroscale, their origins are at the micro- or mesoscales, where SEI growth, electrolyte decomposition, micro-cracking, and composite binder delamination often occur.1–10 At these scales, in situ experimentation and visualization can be difficult.
Traditionally, macroscale battery simulation relies on Pseudo-2D (P2D) models that treat the electrode as a bulk, homogenized, porous material, collectively known as Newman type models.11–15 However, homogenized electrode properties can be difficult to experimentally measure and can vary widely based on material formulation, manufacturing conditions, state of charge, age, and other factors. Additionally, models intended to predict this behavior, such as the oft-used Bruggeman approximation,16 can be highly inaccurate at battery-relevant conditions.17–22 Therefore, high-resolution, mesoscale resolved simulations can provide valuable insight into how the coupled electrochemical and mechanical phenomena that occur at the micro- and mesoscales impact macroscale performance. Resolving the simulations at a particle scale can be important for determining various transport limitations and mechanical stress manifestation.
In the past decade, 3D mesoscale imaging techniques such as X-ray computed tomography (XCT)23–36 and 3D mesoscale simulation capabilities26,37–49 along with more robust computational resources have advanced such that the idea of experimental image-based mesoscale simulations is now possible.8,45,50–58 This is of particular importance, because it has been shown that heterogeneity in the mesostructure can have a significant influence on cell performance and degradation.17,59–62
One important factor missing from much of the current mesoscale simulation literature is an accurate representation of the PVDF and carbon black composite binder domain (CBD) phase.53,63 Experiments have shown that CBD has a significant impact on electrode performance.64–68 As the CBD has a very low X-ray cross section compared to the typical cathode active materials, it is difficult to resolve this phase with XCT. While recent studies that have attempted to resolve this phase by adding additives with high X-ray cross sections69 or with advanced X-ray techniques70 show much promise, they are still insufficient for direct use in image-based simulations. Other approaches to image the binder suffer from small fields of view or are only 2D, limiting their direct use at the mesoscale.30,33,71–75 Therefore, the most advanced image-based mesoscale simulations use algorithms to reconstruct the CBD phase atop particle phases derived from images.19,21,63,76–78 There is not yet a consensus approach to reconstructing the CBD phase morphology, even though predictions have been shown to be sensitive to this morphology.21
Another deficiency of image-based mesoscale modeling in the literature is that the active material is lumped into a single computational domain. This prevents the detailed study of how individual particles interact, both electrochemically and mechanically. It also prevents separating out the role that particle size polydispersity plays in determining macroscale behaviors.
The role of mesoscale mechanics on electrode response is also not well addressed in the literature. While some have begun to study the coupled role of electrochemistry and mechanics,8,53,58,62,79,80 none of these studies to date have included the recent advancements to the state-of-the-art in mesoscale simulation, such as the addition of CBD and separation of particles.
In this Paper, we aim to resolve a number of these deficiencies from the image-based mesoscale modeling literature by presenting coupled electrochemical-mechanical discharge simulations of a Nickel-Manganese-Cobalt (NMC) layered oxide cathode. A mesoscale domain is extracted from XCT images27 supplemented by a "binder-bridge" CBD phase,19,21 which places CBD near particle-particle contacts. We present results for a number of macroscale and mesoscale phenomena, extracting per-particle information to study localized performance and heterogeneities.
Approach
We outline our computational approach to performing coupled electrochemical and mechanical simulations of NMC cathode discharge in this section. This process includes the generation of a computational mesh containing XCT-based particles and an analytical CBD domain, the mathematical model used, and the finite element simulation details, all of which are shown in Fig. 1.
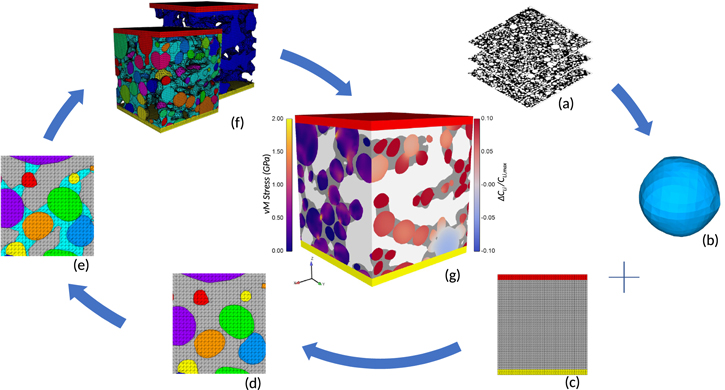
Figure 1. Schematic of mesoscale mesh generation procedure from image data. (a) Raw image data obtained from Ebner et al.27 (b) Representation of a particle as a 3D STL file. (c) Background 3D tetrahedral mesh, including current collector and separator blocks. (d) Application of CDFEM to conformally mesh particles. (e) Insertion of CBD phase alongside particles using CDFEM. (f) 3D mesostructure mesh, including individual particles and CBD (front) and meshed electrolyte (back), along with a current collector (top) and separator (bottom) at either end. (g) Example simulation results for localized von Mises stress and lithium concentration.
Download figure:
Standard image High-resolution imageComputational domain
NMC active material particles for a 92 wt% NMC333, 4 wt% PVDF, and 4 wt% carbon black cathode calendered under a 300 bar pressure are derived from available XCT image data.27 Ebner et al.27 provide a set of greyscale images where each NMC particle is separately labeled by color. The Avizo 9 software (FEI; Hillsboro, OR) was used to first expand each particle by approximately one voxel to account for watershed errors and to match binary segmented volume fractions. Then, each particle was separately segmented in Avizo using the greyscale labels. A surface mesh was created on each particle, smoothed to remove unphysical voxellation stair-steps, and exported in a standard tessellation library (STL) format.
A simulation domain of 50 × 50 × 50 μm from within the set of imaged particles was selected and meshed with tetrahedral elements using Cubit.81 Additional mesh domains representing the current collector and separator were also added, as shown in Fig. 1c. This mesh of the domain is called the background mesh. A mesh size of 0.5 μm is used to be consistent with previous solution verification work.20 Roberts et al.20 do recommend a larger domain than (50 μm)3, however we plan to study the variability of domain size and selection in our future work.
The background mesh is decomposed into particle and non-particle phases using the Conformal Decomposition Finite Element Method (CDFEM).20,82,83 Each particle STL file is used to initialize a level-set field on the background mesh, upon which the CDFEM algorithm decomposes elements containing level-set zero crossings into phase-conformal child elements. This approach has been used heavily in previous publications.50,53,54
Subsequently, the CBD phase is added to the domain using the "binder bridge" approach proposed by Trembacki et al.19,21,22 This algorithm places CBD into porous, consolidated domains that are concentrated near particle-particle contacts, attempting to replicate the morphologies observed by Jaiser et al.84 The total volume of composite binder was set to match the reported weight fractions from the image data,27 additionally accounting for 47% nanoporosity within the CBD phase.52,85
The final computational domain is composed of five material phases (illustrated in Fig. 2): a current collector, active material particles (NMC333), composite binder domain (CBD), electrolyte, and a separator. Properties for each constitutive material are displayed in Table I. The separator phase is assumed to have the same intrinsic transport properties as the electrolyte, as they are typically very porous to facilitate ion transport.

Figure 2. Schematic of the computational domain showing all of the material phases and regions.
Download figure:
Standard image High-resolution imageTable I. Material properties used in the mathematical model.
| Property | Symbol | Value | Units | Source |
|---|---|---|---|---|
| Li Diffusivity | DLi | 2.51 × 10⁻¹⁰ | cm2 s−1 | 86 |
| Li+ Diffusivity |

|
2.6 × 10⁻⁶ | cm2 s−1 | 87, 88 |
 Diffusivity Diffusivity |

|
4.88 × 10⁻⁶ | cm2 s−1 | 87 |
| Charge Transfer Coefficient | αi | 0.5 | — | |
| Reaction Rate Constant | k | 4.38 × 10⁻¹¹ | m2.5 s−1-mol−0.5 | 89 |
| Maximum Li Concentration | Cmax,Li | 3.61 × 10⁴ | mol m−3 | 89 |
| NMC Young's Modulus | ENMC | 138 | GPa | 90 |
| NMC Poisson's Ratio | νNMC | 0.3 | — | 91 |
| Volumetric Expansion | β | 4.97 × 10⁴ | Pa mol−1-m−3 | 92 |
| CBD Young's Modulus | ECBD | 0.30 | GPa | 91 |
| CBD Poisson's Ratio | νCBD | 0.4 | — | 91 |
| NMC Conductivity | κNMC | f(CLi) Eq. 2 | S cm−1 | 86 |
| CBD Electrical Conductivity | κCBD | f( ) Eq. 3 ) Eq. 3
|
S cm−1 | 19 |
| CBD Porosity | φ | 0.47 | — | 52 |
| CBD Tortuosity | τ | 9.4 | — | 52, 93 |
| Equilibrium Potential | ϕeq | f(CLi) Eq. 6 | V | 94 |
| Faraday Constant | F | 96485 | s-A mol−1 | |
| Gas Constant | R | 8.314 5 | J mol−1-K−1 | |
| Temperature | T | 298.0 | K |
Electrochemical model
Electron transport in the particles and CBD is governed by Ohm's Law for current conservation,

where κi is the electrical conductivity of material i and the solution variable ϕs is the solid phase voltage. Amin and Chiang86 report that MC conductivity has a heavy dependence on lithiation, ranging over multiple orders of magnitude through the course of discharge. Thus, we use a fit for conductivity (κNMC):
where y = 1 − CLi/CLi,max. Additionally, binder conductivity is dependent on strain (), and we use the "fresh binder" model with a 10× multiplier published by Trembacki et al.19

Lithium transport within the particles is governed by,

where CLi is the lithium concentration and  is the lithium flux. Lithium transport within NMC follows non-ideal solution theory due to preference of lithium insertion at specific intercalation sites53,54,95:

Here, M = Di/RT is the mobility of lithium, given by the Nernst-Einstein relation, ϕ is the equilibrium potential, F is Faraday's constant, DLi is the lithium diffusivity, R is the gas constant, and T is the temperature. The equilibrium potential is from data published by Wu et al.94 for a NMC half-cell discharged at a C/25 rate, to which we apply the following polynomial fit with an added exponential tail to represent the portion of the curve near full lithiation
where x is the local lithiation fraction CLi/CLi,max.
Current and ionic species conservation are conserved in the porous CBD and electrolyte phases through Eqs. 7 and 8, respectively,

Here,  is the lithium-ion concentration and φ is the porosity of the medium (1 for electrolyte, 0.47 for CBD). The current conservation, Eq. 7, contains contributions from both Li+ and
  whose fluxes are governed by the Nernst–Planck model,
Here, τ is the tortuosity, Di is the ionic diffusivity, and zi is the species valence. Finally, we assume electroneutrality for the  concentration,
  .
.
Reaction kinetics are modeled by applying a Butler-Volmer current density (j) as a normal flux boundary condition for potential on both the solid and electrolyte sides of the interfaces between particles and CBD/electrolyte:
Here, the exchange current density is given by  , η = ϕs − ϕl − ϕeq is the overpotential, αi are the charge transfer coefficients, and k is the rate constant. Concentration flux (r) is tied to the current density through reaction stoichiometry, meaning that r = j/F is applied as a normal flux condition for concentration on the same surfaces. The system is fully defined by a Dirichlet boundary condition on the liquid phase voltage at the free end of the separator (ϕl = 0) and a current flux boundary condition at the free end of the current collector to match the desired C-rate. A bulk boundary condition at the separator interface (
 ) effectively provides an infinite source of Li+ . While we recognize that there could be concentration gradients in Li+ within the separator that impact this bulk boundary condition,96 because of the low concentration gradients we see within the electrode itself, we choose this simpler approach. The cathode is considered charged in its initial state, set to a spatially uniform CLi, 0 = 0.42CLi,max. Initial electrolyte concentration is defined to be 1.2M LiPF6.97
Mechanical model
Mechanical deformation of the cathode particles is governed by the equation

where  is the Cauchy stress tensor. The stress includes contributions from linear elastic mechanical deformation as well as charge-induced swelling,

Here, λ and μ are Lamé parameters, ![${\boldsymbol{\epsilon }}=[{\boldsymbol{\nabla }}{\bf{d}}+{\left({\boldsymbol{\nabla }}{\bf{d}}\right)}^{{\rm{T}}}]/2$](https://content.cld.iop.org/journals/1945-7111/167/1/013543/revision1/jesab632bieqn12.gif) is the small strain deformation tensor, and
is the small strain deformation tensor, and  is the mesh displacement vector.
The term βΔCLi in Eq. 12 represents lithiation-induced swelling, following Vegard's law,98 where β assumes isotropic swelling of the NMC secondary particle structures. This parameter is obtained through a process outlined by Malavé et al.99 which utilizes data of unit cell volume as a function of lithiation,  . Here, K is the bulk modulus, Cmax,Li is the maximum concentration in the particle phase, and χ is the slope of the strain vs lithium fraction curve. A linear fit for the unit cell volume was taken between lithium fraction x = 0.253 and x = 1.0, with x = 0.253 taken to be the fully charged and thus zero stress state.
Identical mechanical deformation equations were applied to the CBD phase, but with β = 0. Mechanical behavior in this phase is especially important due to the strain-dependence of electrical conductivity.
In all cases, no-penetration boundary conditions, n · d = 0 are applied to the edges of the computational domain. This fixes domain boundaries to allow no macroscopic swelling of the cathode, ensuring that all swelling of NMC particles results in compression of the CBD/electrolyte phases. While this restriction can help isolate the influence of mesostructure on local stresses, we acknowledge that real cathodes do exhibit macroscopic swelling over the course of discharge, an effect we investigate later.
Numerical implementation
The mathematical model is implemented and solved using Sandia's Sierra/Aria Galerkin Finite Element Model code.100 The model is formulated into two separate equation systems; one containing the electrochemical model and the other the mechanics model. Each equation system is solved monolithically using a full-Newton method to compile the linear system and iteratively solve the nonlinear system of equations. The linear system of equations is solved iteratively using GMRES with a DD-ILU(T) preconditioner. The transient problem is incremented using a second-order backward differentiation formula time scheme (BDF2) with an adaptive time stepping algorithm to control the error in the predictor portion of the time integration algorithm.
The simulation domain contains 2.4 million tetrahedral elements and 0.4 million nodes, resulting in 1.5–1.6 million degrees of freedom in each linear system. Each simulation was run on 30 processors and the simulation was discretized into 500 time steps.
Performance at 5C Discharge Rate
In this section, we deeply explore the electrochemical and mechanical performance at multiple scales, from the macroscale to the per-particle scale, for a single simulation at a 5C discharge rate, highlighting the relevant physics and transport limitations within the cathode.
Macroscale properties
While visually electrodes at the mesoscale provide significant insight, it is often the macroscale behavior of the electrode that is the most relevant to practitioners. Therefore, we first predict some macroscale quantities, shown in Fig. 3.
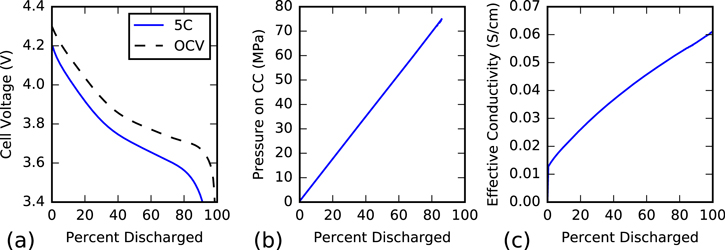
Figure 3. Macroscale behavior of the cathode half-cell during a 5C discharge, illustrating (a) voltage compared to open circuit, (b) through-plane pressure applied to the current collector (CC), and (c) through-plane effective electrical conductivity.
Download figure:
Standard image High-resolution imageThe most obvious quantity to study is the discharge curve; voltage as a function of state of charge compared to the open circuit voltage, shown in Fig. 3a. Two features are immediately noticeable. First, the cell shows polarization losses on the order of 100 mV–200 mV throughout the entire discharge, primarily due to the large current density. Based on the various phenomena shown in Fig. 5, these losses are due to a combination of charge transfer kinetics, electrical transport, and ionic transport. Electrical transport losses become more important later in the discharge as fewer particles are reacting. Second is capacity loss; the cell reaches a cutoff voltage of 3.4V at approximately 90% of full discharge, representing a noticeable (although reversible) loss in capacity.
Lithiation-induced swelling generates local stresses throughout the cathode domain, which are trasmitted through the mesostructure to impose a macroscale pressure on the current collector and separator (Fig. 3b). As the stress generated from lithiation is linear with state of charge, so is the resulting macroscale pressure, reaching a maximum of nearly 80 MPa by the end of discharge. This mean pressure is significantly lower than some of the localized stresses that will be discussed later. We note that all external boundaries of the simulation domain are fixed, preventing the stress from relieving itself by expanding into the separator or macroscopically deforming the cell, an effect that will be addressed later.
Mesoscale modeling is commonly used to predict the effective electrical conductivity of the electrode for macroscale modeling,63 treating the effective conductivity as a static parameter. Recent works19,21,22 have recognized that the CBD conductivity changes as a function of lithiation due to the mechanical forces generated from lithiation. Absent a full electrochemical model, however, these works must assume a constant state of lithiation in the particles. In Fig. 3c, we instead present the instantaneous effective electrical conductivity as a function of state of charge, fully considering the inhomogeneous state of charge of each particle. The effective electrical conductivity is calculated by separately applying a voltage drop across the thickness of the electrode, calculating the current flux into the collector, and then using  , where
  is the mean current density, L is the thickness of the electrode, and ΔV is the applied voltage difference.
Throughout discharge, the cathode's effective conductivity demonstrates a nearly linear increase with time. This is largely due to the linear increase in conductivity of the composite binder, coupled with the linear stress increase shown in Fig. 3b, as it is compressed by the surrounding swelling NMC particles. Deviation from a perfectly linear relationship occurs because our expression for strain-dependent binder conductivity is capped at 5 S cm−1 to match the range of values reported by Trembacki et al.,19 thus causing the rate of increase to slow as more local hotspots reach this maximum value.
Impact of mechanical boundary conditions
Results in Fig. 3 can be affected by the application of mechanically rigid boundary conditions on all boundaries, most importantly for the separator and current collector boundaries, effectively limiting swelling in the z-direction. Allowing compression of the separator can introduce a flexibility that mimics actual cell stiffness. Figure 4 shows the effect of introducing a stiffness parameter k = EA/L to the separator phase, where E is the modulus, A is the cross-sectional area, and L is the thickness of the phase. The vertical dotted line represents the equivalent stiffness of a swollen polymeric separator, where k = 2.04 × 10⁴ N m−1 is calculated from mechanical properties reported by Gor et al.101 The vertical, dashed line is the effective stiffness of the full cathode (k = 9.66 × 10⁶ N m−1).
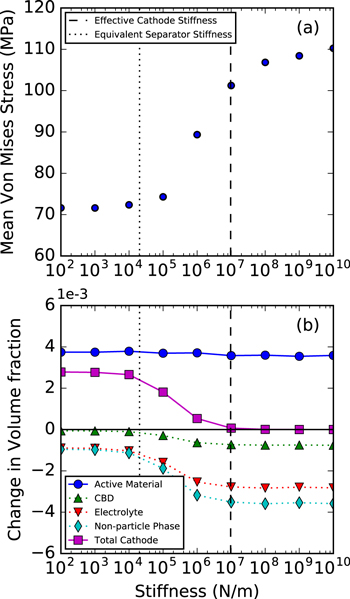
Figure 4. The role of collector/separator stiffness on (a) average von Mises stress in the electrode and (b) volume fraction of each material phase, defined as the change in volume of a phase divided by the total initial cathode volume. All data points are taken from a 50% discharge state. The dashed, vertical line represents the effective stiffness of the full cathode, while the dotted line represents the stiffness of the separator.
Download figure:
Standard image High-resolution imageFigure 4a displays the volume-average von Mises stress calculated over all particles in the domain. As this value reaches a plateau, the system begins to resemble the rigid boundary conditions used previously. The mean von Mises stress at high stiffness values is over 110 MPa. However, at low stiffness values, the mean stress decreases to around 70 MPa, a 35% decrease. At low k, the separator stiffness does not contribute, and the average stress is primarily due to particle contact within the mesostructure and the impact of the in-plane no-displacement constraints. The transition between these two plateaus occurs near where the imposed stiffness is between the stiffness of the separator (the softest material in the system) and the stiffness of the cathode itself. These pressures and stresses are transmitted through the separator to the anode, where they could have important implications on phenomena such as dendrite growth and lithium plating.102,103
Figure 4b provides a detailed breakdown of where the volume changes primarily occur. For the rigid boundary case (high stiffness), the particle phase increases in volume around 0.35% halfway through discharge. This projects to be significantly less than the 3.2% volume change at full discharge shown by Kam et al.,92 which was used to calibrate the swelling of a single particle in our simulations. However, results are similar to those shown by Mendoza et al.53 This is due to the combination of mesoscale and macroscale confinement of these elastic particles (illustrated by the high stresses in Fig. 5) and highlights the importance of mesoscale modeling over single-particle modeling. In this high stiffness limit, all of the volume increase of particles goes into decreasing the volume of the non-particle phases. While the CBD phase does exhibit a small amount of compression (up to 0.1%), the liquid electrolyte phase contributes the majority of this volume change.

Figure 5. Planar snapshots from a full 3D mesostructure under 5C constant current discharge. In all cases, the current collector is at the top of the image, with the separator at the bottom. When not colored, the electrolyte and particle regions are light gray (particles are approximately spherical) and the binder region is dark gray. Figure sublabels (a–f) refer to rows containing information about a parameter of interest at four different states of charge.
Download figure:
Standard image High-resolution imageAs the boundary stiffness decreases, a number of changes are observed. First, the overall volume change of the particles increases slightly, to 0.37%. While the z direction is not constrained, there is still a significant mesoscale confinement effect in the particle network, manifesting itself by transmitting stress to the x and y boundaries. Also, as stiffness decreases, the volume change of the non-particle phases (CBD and electrolyte) actually decrease, even though the overall particle expansion is increasing. This is because the cathode has room to grow in the z direction, evidenced by a 0.28% increase in cathode volume.
Visualization of 2D cross-sections
Mesoscale simulation allows us to probe a number of different quantities relevant to cell performance. While we will quantify many of these quantities later, it is instructive to first visualize the relevant fields, as is illustrated in Fig. 5. These plots represent planar cuts through the 3D mesostructure taken at different times (25%, 50%, 75%, and 92% of theoretical total discharge) over the course of a single discharge simulation.
Figure 5a shows the variation of lithium concentration within the particles of the mesostructure. To highlight concentration differences, we show this as a scaled concentration difference from the mean value,  , where
  is the average lithium concentration at each given time. Smaller particles tend to discharge faster, meaning they display a concentration higher than the bulk average, while larger particles tend to respond slower to the applied current. This phenomenon is due to a larger surface area to volume ratio in the small particles, allowing the reaction to add more lithium per particle volume. This suggests that the reactions may be kinetically limited, which will be discussed in more detail later.
Additionally, we can see much more variance in particle concentration at 50% and 75% SOC than in the final snapshot. Small particles continue to more fully lithiate throughout the middle portion of the discharge, exacerbating the difference at those snapshots. However, toward the end of discharge, these particle become fully lithiated and no longer participate in the reaction, allowing the larger particles to "catch up" to their state of lithiation.
Finally, the largest particles show a measurable internal concentration gradient, particularly in moderate to late times. Lithium diffusion is driven by gradients in the electrochemical potential Eq. 5. In the middle portion, the equilibrium voltage curve becomes relatively flat (i.e. doesn't change much with concentration), making it harder to diffuse lithium and allowing gradients to build up.
Figure 5b displays the concentration of lithium ions in the electrolyte and porous CBD phases. The CBD/electrolyte boundary is shown as a black outline. This illustration shows the expected trend of Li+ diffusion, as there is a general decrease in concentration further away from the separator, exhibiting a 25% decrease across the thickness of the electrode. Furthermore, it is evident that areas with larger masses of binder display slightly lower ionic concentration, signifying more difficult transport through this porous phase (as it has only 5% of the diffusivity of pure electrolyte). However, subsequent sections will show that ionic gradients both across the cathode and within the porous CBD do not pose a limitation to the electrochemical reaction and thus do not measurably affect the macroscopic discharge performance. Note that literature in this area has shown that electrode thickness can have a significant effect on cathode utilization, particularly for thicknesses greater than 60 μm.14,78 While ionic gradients are not impactful in the domains studied here, mesoscale transport effects in thick electrodes warrant further study.
Over the course of discharge, this profile remains fairly consistent with no noticeable differences from 25%–75% SOC. However, near the end of the simulation, the gradient becomes much more pronounced near the largest particle in the domain. This is due to the variation in the state of lithiation for differently sized particles, as previously discussed. Near the end of the discharge, the smaller particles have already been fully lithiated. Thus, the larger particles assume all of the remaining reactive flux from the applied current. This forces a larger reaction rate at the surface of the few remaining un-lithiated particles, consuming Li+ faster than it can diffuse. In the 92% discharged snapshot, it is evident that the Li+ concentration is smaller near the largest particle due to this effect. This will, in effect, increase the local overpotential of the few particles continuing to contribute to the reaction and lower the macroscopically observed voltage (as will be shown later). Ultimately, this is evidence of local mesostructure influence on cell performance and highlights the need for simulation at this scale.
Mesoscale resolution also allows us to see the electrical current pathways through the system over the course of discharge, as illustrated by the magnitude of the current density in Fig. 5c. As the composite binder is much more conductive than NMC, there is a much stronger presence of current through the binder than the active material. Thus, the most efficient pathway to carry current from the collector to a reactive surface will be one that includes the most binder. However, there is still a large driving force for the electrochemical reaction at all NMC surfaces, whether coated with CBD or simply in contact with electrolyte. For electrons to reach the particle/electrolyte surfaces, they must pass through the low conductivity NMC, which can be seen in each snapshot as diffusive current regions near electrolyte interfaces in the larger particles.
Furthermore, this affects the voltage drop seen in Fig. 5d, which is displayed as the local solid or liquid phase voltage compared to the voltage at the relevant boundary (ϕs at the current collector, ϕl at the separator). As the current is directed through the active material, the increased resistance creates a significant voltage drop (as high as 100 mV) that can be seen by much higher solid phase potentials on particle/electrolyte surfaces. At late times, the largest particle has substantial current throughout, as it does not have enough CBD pathways to support the large reaction rate it sustains late in the discharge, also contributing to a drop in the observed macroscale voltage.
CBD has a strain-dependent electrical conductivity, which also plays a significant role in electrical current transport, as shown in Fig. 5e. As the NMC particles lithiate, they will swell, imposing a mechanical stress on the composite binder and deforming it. When this binder phase compresses, the carbon black becomes more densely packed, thus increasing conductivity. This phase is already much more conductive than the active NMC particles, but this difference is exaggerated as the cell is discharged. NMC lithiation decreases its conductivity, and its lithiation-induced swelling increases conductivity in the binder phase. By the end of the simulation, electron transport is extremely favored in the binder phase. It is also worth noting that the snapshots in line four are also a direct representation of binder strain, as it shares a linear relationship with conductivity.
This binder strain is a direct manifestation of the mechanical stresses generated by lithiation, shown using the Von Mises stress invariant in Fig. 5f. As was demonstrated by Mendoza et al.53 and Roberts et al.,54 even, though the articles are nearly spherical, their internal stresses are not uniform. Instead, is is the arrangement of particles at the mesoscale (combined with the mechanical boundary conditions applied) that constrains particle motions and leads to strong stress-supporting chains throughout the percolated particle network, highlighted by the stress concentrations near particle-particle contacts. These mesoscale stress effects strongly outweigh any stresses that would be observed for isolated particles. It is also the inter-particle effects that lead to the binder strain and increased binder conductivity, highlighting the importance of image-based mesoscale simulations for truly understanding performance of these battery materials.
Per-particle quantities
Perhaps the most significant advantage of the present mesoscale approach enabled by our meshing technique is the ability to extract data on a per-particle basis. This allows exploration of how particle attributes such as size or location can impact the cell characteristics during discharge.
In Fig. 6a, individual mean particle concentration is plotted vs particle size (volume to surface area ratio) at a single timestep. Here, it is clear that there is a general trend suggesting that smaller particles are at a higher concentration, which is consistent with results illustrated in Fig. 5. This apparent exponential decay would be expected for kinetically limited problems, where there are not strong concentration gradients within the particles and the concentration is limited by reaction rate at the surface.
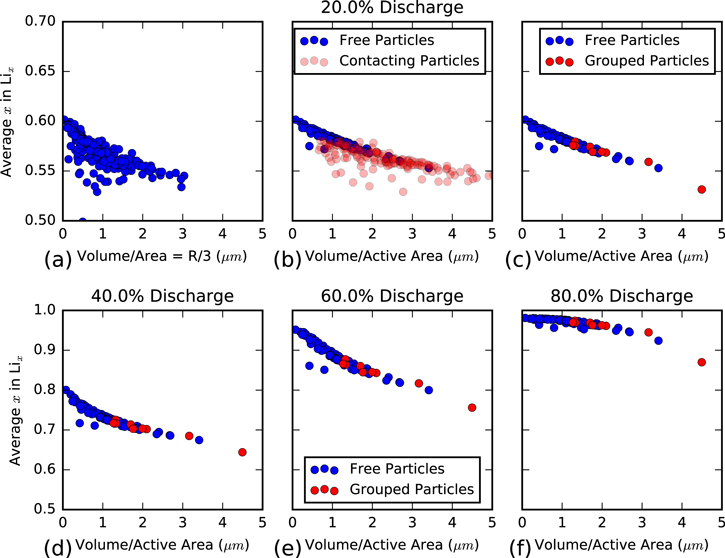
Figure 6. Mean lithium concentration in each particle plotted vs (a) particle volume:surface area ratio and (b) particle volume:active area ratio and grouped by free or contacting particles. (c) The same data from (b), but particles are further grouped where connected particles are considered to be a single particle. (a)–(c) are all snapshots from 20% discharge, while other states of charge are shown in (d) 40%, (e) 60%, and (f) 80%. Subplots (c–f) are all in the grouped format.
Download figure:
Standard image High-resolution imageHowever, there is significant scatter apparent in Fig. 6a with a large number of small particles displaying a lower concentration than the trend would suggest. We hypothesize two possible explanations or this scatter. First, if the reactions are primarily kinetically limited, then the surface area may not be the most accurate measure of reaction area, as some parts of the surface area are occluded by contact with other particles. Therefore, Fig. 6b has an x-axis where the volume is scaled by the particle active area (particle surface touching either electrolyte or porous CBD phases). While this somewhat reduces the scatter and makes the trend more pronounced, the scatter is still significant.
The second hypothesis is that particles that are touching allow lithium diffusion between them, making them act as a single apparent particle in terms of lithium volume for diffusion, while having a drastically different apparent area. Our mathematical model does not have any resistance to lithium diffusion between particles, making this plausible. The impact of a transport resistance between particles is an area of future study. To explore this, Fig. 6b shows particles in two colors. The blue markers are single particles; those not directly touching any other particle. The red markers are particles that are touching at least one other particle. Clearly the large majority of particles that do not fall on the expected volume to area trend line are contacting particles.
To further investigate this, we group particles together if they share any contact. If there was an unbroken diffusive pathway from one particle to another, they were considered part of the same "group" and displayed as such on Fig. 6c. With all grouped particles collapsed into a single marker, the trend is very clear. This suggests that the most important factor in a particle's discharge is not a transport property such as diffusivity or conductivity, but in fact is simply due to its surface area to volume ratio. Ultimately, it is the surface reaction rate which governs how quickly a particle will fill with lithium, and its volume determines the capacity to which it is filled.
Figures 6d–6f show that this trend remains throughout the course of the simulation, but undergoes an inflection in its concavity as time progresses. This phenomena was similar to the previous discussion about concentration in Fig. 5 and is due to smaller particles reaching capacity while larger particles still are significantly de-lithiated.
The process by which the per-particle concentration curves smooth out is further analyzed in Fig. 7. Subfigures b and c show per-particle and per-group concentrations, respectively. Each line in these subfigures is on a color scale determined by the particle (or group) volume. It is evident that smaller, disconnected particles discharge more quickly than larger particles. The value of ∂C/∂t in a given particle is also linked to the derivative of the OCV curve, shown in Fig. 7a. Ultimately, this derivative is defined by ∂C/∂t = r · (A/V), where r is the reaction rate, A is the particle surface area, and V is the particle volume. Here, r is determined by the Butler–Volmer boundary condition Eq. 10, which is exponentially dependent on the local overpotential. As we will show later, the voltage drop on binder/particle surfaces is fairly uniform throughout the electrode, so ϕs is fairly consistent for each particle. However, there is significant variation in ϕeq and the difference between ϕs and ϕeq is what ultimately drives the electrochemical reaction. In the flat regions of the OCV curve, the overpotential will increase in magnitude because ϕs drops while ϕeq stays close to the same value. This pushes the reaction forward and allows the particle to discharge faster. This change in slope corresponds between Figs. 7a and 7b. Note that the other term contributing to ∂C/∂t is the surface area to volume ratio, which scales as 1/R, providing further explanation why smaller particles discharge faster. As illustrated in Fig. 7c, grouping contacting particles together results in a more clear trend highlighting the importance of particle capacity.

Figure 7. Study of per-particle concentrations throughout discharge. (a) First derivative of the equilibrium potential with respect to concentration. (b) Per-particle concentration vs time colored by particle size, showing that smaller particles discharge faster early on, but reach a point where this slope flattens. (c) Concentration vs time again, but now particles are grouped as they were in Fig. 6c, showing the clearer trend of smaller particles/groups discharging faster.
Download figure:
Standard image High-resolution imageUse of this mesoscale approach not only provides per-particle data, but it can isolate per-surface data as well. The CBD placement algorithm selectively places the CBD phase in areas near particle-particle contact. This means that there will be some particle surfaces covered with the polymeric binder and some surfaces in direct contact with electrolyte. Through our post-processing, we are able to show differences in transport on these surfaces and suggest how they affect global discharge.
Figure 8 illustrates the difference in reaction rate at each particle surface at two separate states of discharge. For a large portion of the discharge time, the reactive flux on the electrolyte surfaces is higher than that of binder surfaces (Fig. 8a). However, as the simulation nears completion, this is no longer the case as binder surfaces begin to react as fast or faster than the electrolyte area (Fig. 8b). This is due to the behavior we discussed for Fig. 5. Later in the simulation when NMC particles become lithiated, their conductivity decreases. This results in a polarization loss that increases ϕs on electrolyte surfaces. As these interfaces depend on electron transport through the active material for the reaction, they will ultimately see a smaller magnitude overpotential as the solid voltage gets closer to the OCV. This slows down lithium insertion from these surfaces, suggesting that particles not covered in enough binder could contribute to capacity loss at high C-rate.
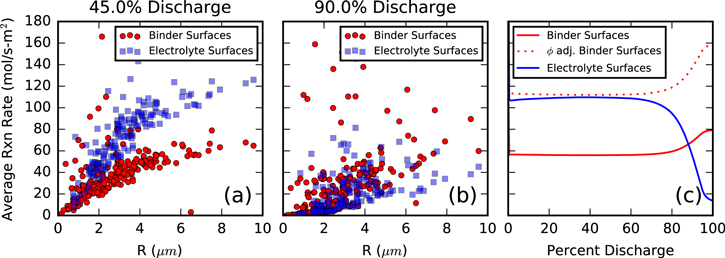
Figure 8. Per-particle reaction rates, sorted by binder or electrolyte surfaces at (a) 45% Discharge and (b) 90% Discharge. (c) displays the reaction rates vs time, corrected by the available surface area for reaction, due to nanoporosity in the CBD phase.
Download figure:
Standard image High-resolution imageAugmenting this phenomenon is the increased conductivity of the CBD phase late in discharge due to the compressive forces it is subjected to. While it becomes harder to get electrons to the electrolyte-exposed surfaces to react, it simultaneously becomes easier to get electrons to the binder-covered surfaces. Even though there is a 95% diffusion penalty for lithium ions through CBD, Fig. 5 showed very little effect of this penalty, as the lithium ion diffusivity is sufficiently high.
Binder surfaces only react at locations in contact with pore space (half of the total surface). When correcting the active area to provide a mol s−1 rate, as shown in Fig. 8c, it is apparent that the binder surfaces are comparable to the electrolyte surfaces throughout discharge and exceed their performance late in discharge. This means that there is not a transport limitation of Li+ to the particle surface, and the reaction is instead governed by the overpotential. This information can be useful when designing a cathode, as you simply need to consider the amount of available area for reaction when adjusting the weight fraction of porous binder during electrode manufacture.
Through our per-surface analysis, we can also look at the distribution of surface overpotentials and loss mechanisms which influence discharge characteristics. In Fig. 9a, total surface overpotential is plotted against particle size. As previously mentioned, this overpotential is fairly comparable for binder and electrolyte surfaces early on, but begins to deviate toward the end of the simulation with binder surfaces exhibiting higher overpotential and faster reaction rates. At 90% discharge (Fig. 9d), the discrepancy between surfaces is very apparent, particularly for the larger particles.
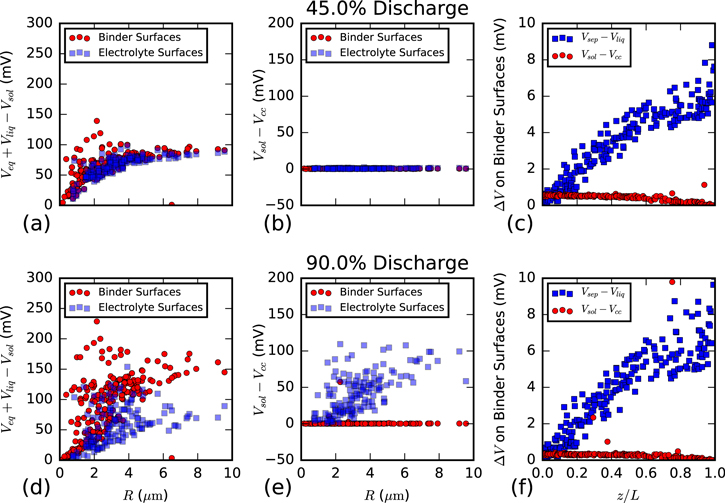
Figure 9. Polarization losses shown for two states of discharge (45% a–c, 90% d–f) and sorted by binder or electrolyte surfaces. (a) and (d) Reaction overpotential showing similar values on electrolyte and binder surfaces at 45% discharge, but binder surfaces showing a significant increase near the end of the simulation. (b) and (e) Voltage drop in the solid phase between the surface and the current collector. (c) and (f) Voltage drop on binder surfaces in the liquid phase due to ionic transport (blue) and in the solid phase due to electron transport (red).
Download figure:
Standard image High-resolution imageFigures 9b, 9e show the electrical transport loss to each surface. Early in the discharge, when NMC conductivity is relatively high, the losses to both exposed and binder-covered surfaces is negligible (Fig. 9b). However, later in the discharge (Fig. 9e), NMC conductivity is sufficiently low as to lead to significant losses transporting electrons from the CBD to electrolyte surfaces to react. On the largest particles, the electrolyte exposed surfaces can experience as much as a 100 mV penalty. This is the primary contributor to the lower reaction rates for electrolyte surfaces shown in Fig. 9d.
Figure 9c shows polarization losses through ionic transport (blue squares) and composite binder conduction (red circles). These voltages are very small, and thus do not significantly contribute to polarization throughout the cell. However, we do see the expected trends as ϕliq increases toward the current collector and ϕs increases toward the separator. Here we should note that our analysis did not show any significant dependence for particle discharge on distance from the current collector. This is likely due to the very small values we observe for the voltage drop in the liquid phase, thus suggesting very good ionic transport.
The results in this section have thus far suggested that neither species nor electrical transport place a significant transport limitation on cathode performance over the length scales studied here. The most successful predictor of a single particle's discharge state is its size, and thus, capacity. If this is the case and no transport limitations are strongly present, the volumetric reaction rate for each particle should be constant. Figure 10 illustrates this volumetric rate while utilizing the same particle grouping method from Fig. 6. Figure 10a shows the expected trend for volumetric reaction rate, as it is nearly constant for all particle groups. Only the largest diffusive network exhibits a slight decrease from this value, suggesting that extremely large particles can experience some transport limitation (which is illustrated in Fig. 5a). This Behavior begins to change at 60% discharge, as the smaller particles have become so lithiated that their overpotential drops and rate of reaction begins to slow, causing the left portion of the curve to significantly decrease. Near the end of discharge, Fig. 10c, only the largest particles have the capacity to add more lithium, and the curve shifts to suggest the majority of reaction is occurring on these large groups. While this demonstrates that transport limitations can play a role late in discharge, the most significant contributor to particle discharge performance is simply the particle's size.
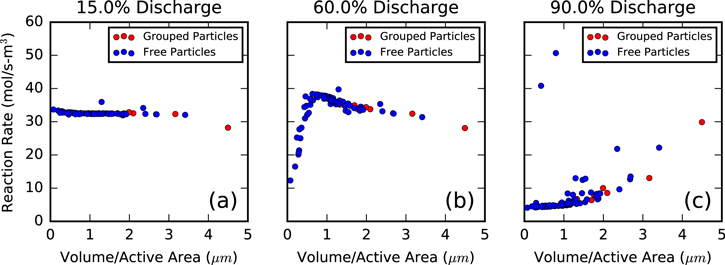
Figure 10. Volumetric reaction rates for particles grouped into continuous diffusive networks at (a) 15% Discharge, (b) 60% Discharge and (c) 90% Discharge.
Download figure:
Standard image High-resolution imageDischarge Rate Analysis
Battery performance is known to be heavily tied to discharge rate, showing that there is higher degradation and capacity loss at higher C-rates. Here, we focus on the same physical domain as in the previous sections, observing how cell behavior changes with varying applied currents.
While model parameters can be tuned to match a specific discharge curve, many approaches have difficulty capturing the correct discharge behavior at multiple rates. At higher C-rates, there is an initial polarization which shifts the voltage curve downward. This is illustrated in Fig. 11, which shows a comparison of the mesoscale model to the experimental half-cell results of Wu et al.94 Additionally, we include results from a standard Newman P2D electrochemical model11 which utilizes a commonly employed diffusion length method to account for solid-phase diffusion within spherical particles.104,105 All constitutive properties in the P2D model correspond to the mesoscale model, and we focus on the cathode half-cell discharge curve for comparison. Further details on the P2D model are provided in the Appendix.
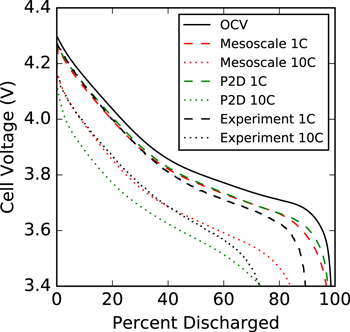
Figure 11. Discharge curve comparisons between the Mesoscale model (red), P2D model (green), and experiment Wu et al.94 (black). Results are shown at 1C (dashed) and 10C (dotted) discharge rates.
Download figure:
Standard image High-resolution imageIt is evident that both model approaches can reasonably match the experiment for a 1C rate, particularly early in discharge. However, the P2D model presents a significant departure from experiment at the 10C rate, while the mesoscale model matches well at lower states of discharge. Incorporation of mesoscale resolution allows us more accurately capture the coupled effects of electron, Li, and Li+ transport, leading to a more predictive model. Both approaches fail to capture the half-cell measurements as the curve tails off at toward end of discharge. This could be due to a number of factors, but it is important to note that many loss mechanisms can be dependent on the specific electrode properties, such as electrode thickness, porosity, CBD fraction, and particle distribution. Without comparing the exact material, manufacturing conditions, and mesostructure in both model and experiment, matching this portion of the discharge curve is unlikely.
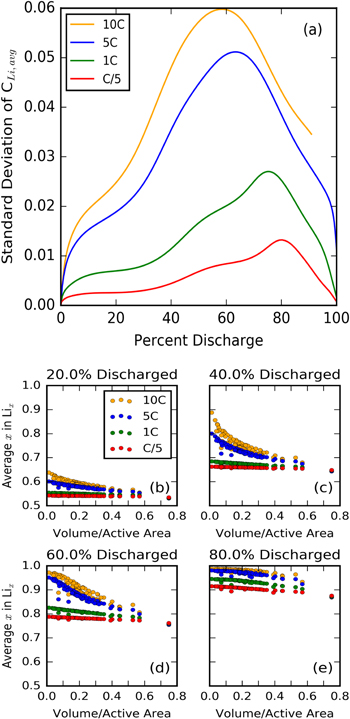
The rate of discharge also has an effect on the distribution of Li concentration in the active material. Figure 12a shows the standard deviation of the average particle concentrations. At higher C-rate, this value is fairly high, while lower C-rates allow the particles to reach a more uniform concentration. These curves also reach a peak before decreasing, which is consistent with the analysis done in previous sections. As small particles discharge quickly, they contribute to the variance in concentration. Eventually, they become nearly fully charged, and slow their reaction rate, resulting in a more flat distribution.
Figure 12. (a) Standard deviation of particle lithiation state over discharge rates ranging from 10C to C/5. Mean lithium concentration in particles grouped similarly to Fig. 6 shown over multiple discharge rates and at multiple states of charge ((b) 20%, (c) 40%, (d) 60%, (e) 80%).
Download figure:
Standard image High-resolution image
The per-particle scatter plots in Fig. 12 show the same trends as in Fig. 6, but scaled appropriately by the discharge rate. At lower reaction rates, the entire electrode reacts much more uniformly, as there are smaller lithium concentration gradients within the particles and therefore a more uniform surface overpotential and reaction rate between large and small particles. This effect is accentuated at the moderate states of charge, where the smallest particles show big differences in their average concentrations. At 80% discharged, it is only the biggest particles reacting, evidenced by nearly all particles having the same concentration, despite rate differences.
Conclusions
We have demonstrated a 3D image-based, particle-resolved, mesoscale model for coupled electrochemical-mechanical simulation of discharge performance of a NMC cathode. The addition of a realistic porous CBD phase based on the work of Trembacki et al.19,21 to the X-ray computed tomography derived particle phases provides a complete picture of the relevant mechanisms in this cathode material. Creation of a finite element mesh that is conformal to each particle allows a level of in-depth study of the interplay between particles and their percolated mesostructure that is unprecedented in detail and capability.
Macroscopically observable quantities of interest are presented. Discharge curves are shown that highlight polarization losses of 100 mV–200 mV and a loss of capacity of 10% at a discharge rate of 5C. In-situ estimates of the evolution of effective electrical conductivity show an increase of over one-order-of-magnitude throughout discharge, largely due to the increase in CBD conductivity from compressive forces from lithiation-induced swelling of the NMC particles. The impact of mechanical constraints (from the separator and pack-scale constraints) on swelling and compression are also shown.
Diving deeper into the mesoscale phenomena, we highlighted the interplay between various electrochemical loss mechanisms, including electrical conduction, lithium diffusion within particles, electrolyte diffusion, and interfacial charge transfer kinetics. Transport of lithium ions through the electrolyte does not significantly contribute to polarization losses, with drops of no more than 2 mV, even through the porous CBD. While the processes are primarily kinetically driven at high discharge rates of 5C, lithium diffusion and electrical conduction all play important roles at various stages of discharge and at different locations in the electrode. Specifically, solid-phase lithium diffusion is only influential for the largest particles, and electrical conductivity makes impacts on electrolyte-exposed surfaces late in discharge. The fairly high porosity of the selected domain may contribute to the limited ionic transport losses, thus we plan to further investigate this by analyzing more diverse manufacturing conditions, including electrode calendering pressures, in a future paper.
Heterogeneity throughout the electrode, from the polydisperse particle size distribution, mesoscale arrangement of particles, and CBD morphology, all significantly impact performance. Because of the impact of the finite rate of lithium diffusion on the surface electrochemical potential and the associated volume to surface area ratio of polydisperse particles, smaller particles lithiate earlier in the discharge process. This leads to the largest particles within the domain supporting a large portion of the current density late in the discharge process. At high discharge rates, this leads to more significant polarization losses and an underutilization of cathode material. A more uniform particle size distribution would help minimize these heterogeneities, improve material utilization, and reduce polarization losses late in discharge.
Particles that touch other particles act as if they are a single spherical particle with an effective volume and surface area derived from all particles that are touching and forming a connected particle network, allowing lithium to diffuse throughout the group. This highlights the importance of the mesostructure arrangement of particles, again suggesting that a method of improving performance and reducing heterogeneities would be to ensure intimate contact between all particles in the mesostructure.
Combining per-particle and per-surface capabilities with a realistic CBD phase enables isolation of impact of CBD on performance. While the CBD restricts ionic transport and reduces surface area available to reaction, it is evident that charge transport faciiltation from this phase actually creates a more complicated, and positive, response. CBD is necessary for efficient transport of electrons from the current collector to the interfacial reaction site, as it has two orders of magnitude higher electrical conductivity compared to NMC. This is even more important late in discharge, as the NMC conductivity decreases as the CBD conductivity increases. Over the last 20% of discharge, reaction is actually preferred at the CBD-particle interfaces over the electrolyte-particle interfaces, even though there is 50% less area available for reaction. Ensuring reasonable coverage of each particle with connected, porous CBD phase is necessary for efficient electrode operation.
Applied current has a significant effect on electrode performance, including voltage output and capacity loss. Increasing current density exacerbates heterogeneities within the electrode, including the spread of per-particle lithiation, which leads to the capacity loss at high currents. the importance of the mesoscale in these high current density cases, where transport limitations rule, is highlighted by favorable comparisons with both experiment and macrohomogeneous P2D models.
This work sets a foundation for future studies in understanding how the makeup of battery electrodes influences their performance. By understanding how individual particles, and their heterogeneities, combine with a CBD phase to form a percolated mesostructure, material designers have a tool to aid them in crafting their material constituents to minimize heterogenities, reduce transport losses, and optimize performance.
Acknowledgments
We appreciate Vanessa Wood's group at ETH Zurich for publishing their experimental mesostructure image stacks online. We also thank Katherine L. Harrison and Lincoln N. Collins for pre-submission internal peer review and for their insightful comments. Anonymous peer reviewers provided by the journal made several appreciated suggestions that improved the overall quality of this manuscript. This work was funded by the U.S. Department of Energy (DOE) Vehicle Technologies Office CAEBAT III program led by technology manager Brian Cunningham. Final manuscript preparation was also sponsored by the Laboratory Directed Research and Development program at Sandia National Laboratories. Sandia National Laboratories is a multi-mission laboratory managed and operated by National Technology and Engineering Solutions of Sandia, LLC., a wholly owned subsidiary of Honeywell International, Inc., for the U.S. Department of Energy's National Nuclear Security Administration under contract DE-NA0003525. This Paper describes objective technical results and analysis. Any subjective views or opinions that might be expressed in the Paper do not necessarily represent the views of the U.S. Department of Energy or the United States Government.
Appendix
In Fig. 11 above, we compare our mesoscale model to a simulated pseudo-2D (P2D) respresentation of a full cell. This Appendix presents a summary of the equations that constitute this model in Table II. While this does not provide a formal description of this approach, omitted details are abundant in the literature.11,105,106 Our model uses the diffusion length method to account for solid-phase diffusion within spherical electrode particles,104 a common approach used to reduce the numerical cost of the P2D model.105 We assume constant transport properties and lithium ion transference number (t+). To simulate discharge current density (Iapplied), a flux boundary condition is applied to the ϕs equation ( ) on the cathode boundary while a constant voltage boundary condition (ϕs = 0) is applied at the anode boundary. All other equation boundary conditions are zero flux conditions. Constitutive properties are the same as those listed in Table I. The bulk porosity for the domain is calculated to be ε = 0.29, and we assume a commonly used relationship for specific surface area, a = 3(1 − ε)/r.
Table II. Pseudo-2D (P2D) model equation summary.106
| Variable | Equation |
|---|---|
| Separator Region | |
| ϕe, electrolyte potential |

|
| ce, electrolyte Li+ concentration |
|
| Electrode Regions | |
| ϕe, electrolyte potential |

|
| ϕs, solid potential |
|
| ce, electrolyte Li+ concentration |
|
| cs, solid Li concentration |
|
| j, Butler-Volmer current density |
![$j={i}_{0}\left[\exp \left(\tfrac{{\alpha }_{a}F\eta }{{RT}}\right)-\exp \left(\tfrac{-{\alpha }_{c}F\eta }{{RT}}\right)\right]$](https://content.cld.iop.org/journals/1945-7111/167/1/013543/revision1/jesab632bieqn26.gif)
|
| η = ϕs − ϕe − ϕeq | |
| i0, Exchange current density |

|
| ϕeq, Equilibrium Potential94,106 |

|
 , solid Li surface concentration104 , solid Li surface concentration104 |

|
| Effective Transport |
 , ,  , ,  , τ = −0.5 , τ = −0.5 |
 , , 
|