
Abstract
Electrochemical Impedance Spectroscopy (EIS) in the past few years has been used to design gas sensors. EIS based gas sensing has been considered as an ultra-sensitive technique to identify and measure different toxic gases. Their sensing performance has been superior when compared to other conventional techniques. Impedance makes it possible to investigate the finer changes occurring on the surface of sensing layers leading to the identification of the target gases such as H2S. The measurements are carried out by scanning the electrode surface with a mixture of frequencies from 1 Hz to 10 MHz and recording the response as Nyquist and Bode plots. From these plots, the results can be used to elucidate the electrochemical phenomena. The acquired impedance data can be fitted into equivalent circuits and this is further modeled to obtain information about the interfacial phenomena like grain bulk resistance, grain boundary resistance, interface between electrode and sensing film resistance. These phenomena support the sensing of toxic gases from ppm - ppb level. This article focuses on impedance spectroscopy and its relevance to sensors, challenges in detecting toxic gases on the electrode surfaces prepared using semiconducting metal oxides, doped metal oxides and graphene based composites along with the research gaps, current innovations and future directions. EIS based gas sensors have high selectivity, sensitivity, reproducibility, long term stability and they also assist prediction of the electrochemical mechanisms for the analyte gases.
Export citation and abstract BibTeX RIS

This is an open access article distributed under the terms of the Creative Commons Attribution 4.0 License (CC BY, http://creativecommons.org/licenses/by/4.0/), which permits unrestricted reuse of the work in any medium, provided the original work is properly cited.
Air quality is the key factor for the good health of the citizens of a country which includes an environment free form pollution of harmful gases and dust. But, with the spurt in population and rapid growth in the social economic activity accompanied by industrialization along with the destruction of natural resources, there occurs the deterioration of the air quality. Toxic gases commonly present in the environment include NH3, CO, methanol, NO, NO2, H2S, SO2, etc. These gases are regularly emitted by chemical and gas industries, power plants, transportation, agriculture, bio waste and volcanic activity.1–13 In addition to pollution, air quality needs to be monitored and detected for toxic or flammable gases inside closed doors which include industrial environments, hospitals, kitchens etc. As the air quality deteriorates the lungs are the first organs to be affected by environmental toxicity and once damaged, the loss can be irreversible. The limit of exposure of humans to H2S toxic gas in terms of concentration ranges from 10–100 ppm and time of exposure from 1–10 min. During the exposure to humans, these toxic gases seriously damage the nervous system leading to fatal accidents within minutes of exposure even before first aid could be administered.14,15
Gas sensors play an important role in continuously monitoring the environment as detecting the leak of a toxic gas in ppm levels is the first priority to save humans from getting exposed. The reaction time is also very short to identify their presence and evacuate humans present in the site. Among various industrial houses that use or produce toxic gases, chemical and mining industries are the major sources of toxic gas storage accompanied by its pollution. All manufacturing industries require gas sensors to detect and prevent leakage during their production and storage process. The major challenge here is that these toxic gases do not have specific odor or color and also they have to be detected in ambient atmosphere along with other gases (N2, O2, CO2, etc.) present in air. Sensitivity and selectivity of a gas sensor have defined its wide spread usage accompanied by low cost, simple architecture and wide availability.16,17
Gas sensors are widely available in the market and they have been used to continuously screen the toxic gases present in trace levels. Typically they are based on the principle of detection—optical, electrochemical, conductivity, potentiometric, DC resistance, cyclic voltammetry, optical and surface acoustic wave etc. Metal oxide based materials are extensively used in the construction of gas sensors. Semiconducting metal-oxide nanomaterials are of recent research interest used for the detection of toxic gases. WO3, ZnO, SnO2 and TiO2 are among the commonly explored semiconducting metal oxides. Metal oxide, doped metal oxides and their composites are commonly used materials to fabricate gas sensors as these materials pocesses good electronic properties, high thermal and chemical stability. They are also simple to construct, cheap and consume low power. They show sensing properties of high selectivity, long time stability, repeatability, quick response and recovery under target toxic gas environmental conditions.18–22
Electrochemical Impedance Spectroscopy (EIS) is a technique that is currently used in various research areas like corrosion, fuel and solar cell, batteries and preparation of electrodes for various device fabrications and sensors. It works on the principle of application of an AC potential as a small excitation signal to an electrochemical system and the changes in the cell are followed by measuring its current.23–38 The EIS data recorded are presented as Nyquist and Bode plots. The EIS based gas sensing techniques are advantageous compared to other techniques (DC resistance, cyclic voltammetry, optical and etc.). Because EIS circuit fitting may provide "unique insight" into the mechanism of detection. The EIS can also define properties like grain bulk, grain boundary, interface between sensing layer and electrode. These properties aid to demonstrate the clear mechanism of a toxic gas sensor and its interaction with the target toxic gas.39,40
This paper brings out the importance and several contributions of impedance based gas sensors and their role in predicting the gas sensing mechanism for different gases and electrode types. On addition, the future practical applications are also highlighted.
Different Types of Gas Sensor
Optical based gas sensor
The sensing signals for sensors are obtained based on the changes in sensing material properties. Optical gas sensors are based on the changes in optical properties like fluorescence, scattering, absorbance, refractive index, reflectivity and optical path length to detect target gases. Various types of optical based gas sensors have been developed (Ultraviolet-Visible Spectroscopy, Infrared Spectroscopy, and Surface Plasmon Resonance, etc.) for detection of toxic gases. One of the advantages of optical based gas sensors over the conventional sensors is that they can be handled at room temperature.3,41–44
Paliwal et al.45 have reported the detection of CO gas based optical sensor using surface plasmon resonance (SPR) with a high sensing response and sensitivity ranging from (0.5–100 ppm) at room temperature.45 The CO gas sensing properties of ZnO thin films deposited on Au coated prism using RF magnetron sputtering through SPR are illustrated in Fig. 1. This sensor performance (Fig. 1a) shows a constant shift in θSPR towards lower angle (43.3°−39.0°), and an increase in Rmin(0.30−0.64) was observed with increase in CO gas concentration (0.5−100 ppm). Figure 1b shows the changes in values for θSPR and Rmin for prism/Au/ZnO/CO gas sensing system with increasing CO gas concentration (0−100 ppm). This variation in SPR is owing to the refractive index changes in ZnO film with the different concentration CO gas adsorption. In this gas sensing system, full width at half maximum of SPR curve increased continuously with the increasing concentration of CO gas, and the increase in Rmin indicates the increase in losses.3,45,46
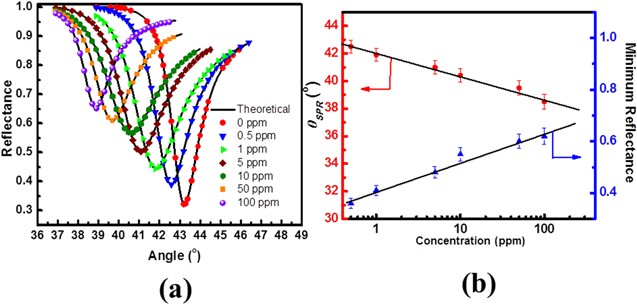
Figure 1. (a) Shows SPR reflectance for prism/Au/ZnO on exposure with different concentration of CO gas (0–100 ppm) and (b) SPR dip angle Variation (θSPR) and Rmin for the SPR gas sensing system with CO gas under different concentrations calibration curve.45
Download figure:
Standard image High-resolution imageQuartz crystal microbalance (QCM) based gas sensor
Typical quartz crystal microbalance (QCM) can be constructed by choosing the desired specific orientation with ultrafine quartz disks using gold electrodes. On application of an electrical input to the quartz crystal a shift towards a specific frequency occurs. This is accompanied by a change in mass on the surface of the quartz crystal at this particular frequency.
Kösemen et al.47 demonstrated that ZnO nano rods can be synthesized by electrochemical deposition on gold electrodes of QCM by varying the deposition time. Then, the V2O5 films were coated on ZnO nano rods to improve the gas sensing performance using thermal evaporation method.47 The fabricated gas sensors were exposed to various concentrations of volatile organic compounds (VOCs) at room temperature. The results in Fig. 2 show that with an increase in the concentration of triethylamine vapor from 720 to 3600 ppm, the response of S2 electrode towards the gas increases (Figs. 2a). Figrue 2b shows the sensing response of dimethyl methylphosphonate (DMMP) as S3 and S4 when exposed at different concentrations from 3–15 ppm. As the analyte concentration changes the frequency shift increased for S3 compared, S4 indicating the superior response towards DMMP and the overall response time of the sensors is fast compared to the recovery time of the sensor.47–49

Figure 2. Sensor responses of (a) Triethylamine (S2-Layer and nanorod preparation time (2000 s)) and (b) DMMP (S3-Layer and nanorod preparation time (2000 s and 3000 s) and S4- Layer and nanorod preparation time (2000 s, 3000 s and V2O5 coated)) at room temperature.47
Download figure:
Standard image High-resolution imageField effect transistors (FETs) based gas sensor
Field Effect Transistors (FET) based gas sensors are widely used as it has the advantages of being constructed as small devices with low power consumption, low cost and ease of fabrication. FET sensors consist of two electrodes of source and drain placed in between the sensing layer. Voltage to the gate electrode is applied by means of a dielectric thin layer that can be modulated through conductance of the channel. The change of the drain-source current (conductance changes) of the semi conductive sensing unit is used to detect the analytes. The principle is based on the changes that occur due to the adsorbed target gas molecules on the semiconductor surface. Graphene as a gas sensor using this principle has been developed. Graphene FET (GFET) was gated by an ionic liquid (IL) as given in Figs. 3a and 3b. The ILGFET gas sensor was fabricated and the drain source current and gate voltage (Ids – Vg) characteristics were analyzed under NH3 gas environment and the gate voltage for these experiments was set below 1 V.50
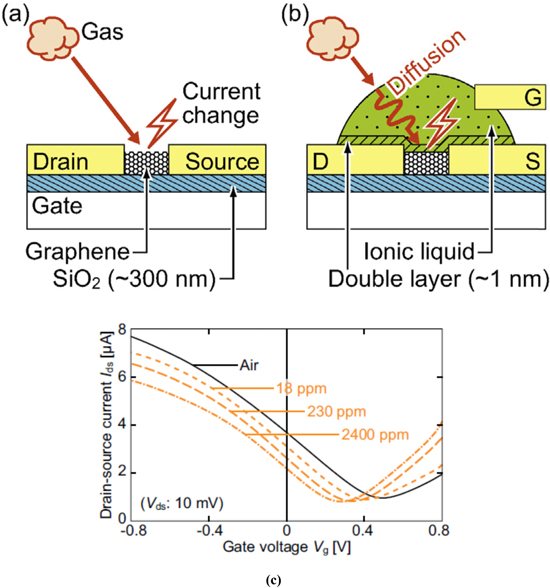
Figure 3. (a) Reported Conventional back gate Graphene FET sensor and (b) the proposed ionic liquid gate Graphene FET sensor and (c) the current–voltage response under air and various concentration of NH3.50
Download figure:
Standard image High-resolution imageFET based gas sensor current–voltage response is shown in Fig. 3c under air and various concentration of (18,230 and 2400 ppm) NH3. As the concentration of NH3 increases, Ids–Vg values move towards negative direction which confirms absorption of NH3 into the IL and to transfer of negative charges to the graphene channel. They reported the power consumption to be less than 100 nW which was computed based on the observed current and applied voltage. To obtain this result a lower gate voltage (−0.8 to 0.8 V) was used compared to a conventional GFET gas sensor.50–55
Chemiresistors based gas sensor
Resistance based gas detection systems are widely used for a variety of gases as they are easy to fabricate and operate, low cost, ability to reuse, high stability, sensitivity and simplicity of use. Their detection principle corresponds to the amount of adsorbed gas on the sensing layer that leads to a change in its resistance. To identify these changes, the sensing electrodes are coated as layers or further screen printed on an insulating substrates like silicon dioxide, alumina, etc. Some of the gas sensors are attached with a heater or the sensors are coated on a micro hot plate to obtain the finest operating temperature, as their sensitivity is temperature dependent and one of the major advantages of chemiresistors based gas sensor extraordinarily low power requirements, these type of gas sensor used at room temperature.56–61
Many firms around the world produces resistance based sensors with a well-built response to an extensive range of volatile organic compounds (VOCs) and toxic gases. Generally, these type of gas sensors have a plate or tubular configuration on an insulating substrate with interdigital electrodes (commonly Ag, Pt and Au) and attached with heating plate or coil for increasing the gas sensing temperature. The sensing materials are coated on these substrates using different methods.
Recently Suematsu et al.62 have reported on a 10 ppm hydrogen detection using electrodes made from SnO2 nano particles as a paste using α-terpineol.62 The electrode was fabricated on a comb type Au electrode using a screen-printing method on an insulating substrate of alumina size of 9 mm × 13 mm with 0.38 mm thickness and approximately 25 μm thickness of the gas sensing layer which is represented in Fig. 4a. The obtained device was dried and sintered to take away the organic binder and used to detect H2 in a 10 ppm range.
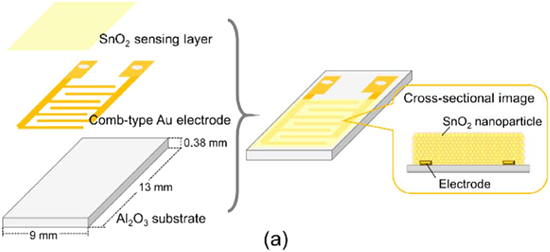
Figure 4. Schematic diagram of the (a) gas sensor device.62
Download figure:
Standard image High-resolution imageThe performance of these electrodes when tested in a dry atmosphere indicates that the logarithm of the resistance linearly decreased with the logarithm of PO2 which decreased in the presence of H2 as shown in Fig. 5a. The oxygen adsorption decreased as PO2 was reduced, due to consumption of adsorbed O2 by H2 on the surface of SnO2. In humid atmosphere, the resistances were considerably lower than those in the dry atmosphere over the whole PO2 range, due to the decrease in the presence of H2. The decrease in the electrical resistance with the increase in PH2O is shown in Figs. 5b and 5c). This drastic change was caused by adsorbed oxygen consumed by H2 and hydroxyl ion on the surface of SnO2.62–67
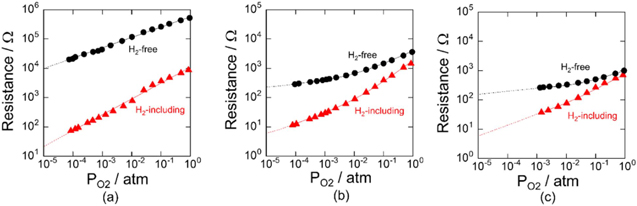
Figure 5. Oxygen limited pressure dependence of the resistance at 350 °C using SnO2 nano particles under H2-free and 10 ppm of H2 including atmospheres in (a) dry and (b) PH2O = 0.0048 atm, and (c) PH2O = 0.035 atm environments.62
Download figure:
Standard image High-resolution imageElectrochemical impedance spectroscopy based gas sensors (EIS)
The principle of EIS based gas sensors are completely different from other techniques (ex. Field Effect Transistor (FET), Optical Based Gas Sensors, Quartz Crystal Microbalance (QCM) and Chemiresistors) where the sensing material is coated between the electrodes. Electrochemical AC Impedance Spectroscopy (EIS) is one among the techniques wherein a small amplitude sinusoidal AC signal is superimposed on the DC potential of the electrode. The resultant impedance of the reactions occurring at the interface of surface of the electrode-electrolyte or medium are measured. Impedance can be explained as a complex number, where the resistance is the real component and the combined capacitance and inductance is the imaginary component. For a given circuit, the total impedance is obtained as a combined opposition of all its resistors, capacitors and inductors to the flow of electrons. EIS is considered as ultra-sensitive techniques where Nyquist and Bode plots of impedance and their equivalent circuits can be fitted and the values of the circuit elements can be monitored at different gas concentrations ranging from ppb–ppm. This technique supports us in the study of individual properties of the sensing materials like grain boundary, grain bulk, and border between electrode contact and sensing material and these types of sensors also improve in the analysis of sensitivity, selectivity, reproducibility, long time stability, response and recovery of individual materials with different gases. These parameters aid researchers to predict a suitable gas sensing mechanism as this steady state technique is capable of accessing relaxation phenomena whose relaxation times vary over many orders of magnitude. A frequency in the range of 10−4 to 106 Hz is normally used for finding out the interfacial processes. As the target gas is injected on sensing unit, a variety of reactions can occur on the sensing electrode surface and these reactions change with the changing sensing materials (ex., semiconducting metal oxide and its doped forms along with their composites). The electrode used for these sensors have been developed by spin coating, electrophoretic deposition etc. on various substrates and the sensing properties are studied using EIS measurements.39,68–70
A review of literature reports indicate the application of EIS to evaluate the sensing ability of a gas sensor and predict its sensing mechanism from the data obtained. Balasubramani et al., have developed a H2S gas sensor using impedance spectroscopy by fabricating a reduced graphene oxide (rGO) by incorporating it into ZnO (rGO/ZnO). An alumina substrate was used to develop the electrode using screen printing method.71
Figure 6 shows a typical Nyquist impedance with the corresponding equivalent circuit of ZnO/rGO composites that were exposed to air containing 2 to 100 ppm of H2S gas (Fig. 6a). The system was maintained at a working temperature at 90 °C. An analysis of the Nyquist impedance and equivalent circuit with fitting values and parameters clearly indicates the high response (response above 57) and grain boundary resistance highly decreased compared to grain bulk and interfaces between sensing layer and electrode contact resistance. The response calculated from Eq. 1 and the schematic sensing mechanism of H2S gas sensor is shown in Fig. 6b. In air, the adsorbed oxygen can capture free electron of metal oxide resulting in the formation of charge depletion layer which induces the resistance. The electron mobility is controlled by depletion layer of n-ZnO/rGO nanocomposites. When injecting the H2S gas, the previously trapped electron released from adsorbed oxygen into the metal oxide conduction band and electron concentration increased, and this effect can change of potential barrier height due to decrease in the grain-grain contacts. This indicates that the resistance of grain is highly affected by H2S gas.71

Where Za is the impedance of air, and Zg the impedance under H2S gas.

Figure 6. (a) Nyquist impedance of ZnO/rGO nanocomposites under air and H2S gas (2–100 ppm) and (b) Schematic representation of H2S gas sensing mechanism.71
Download figure:
Standard image High-resolution imageSpin coating based gas sensor
Suresh kumar et al.72 reported the use of Mn doped and pure ZnO sensing materials coated on alumina substrate for H2S toxic gas sensing applications. Electrochemical impedance was recorded with a frequency range from high to low (1 MHz to 1 Hz) and 10 mV sinus amplitude and without dc bias.72
The Nyquist plot in Fig. 7a clearly indicates impedance diameter of semicircle decreases with the increase in H2S gas (2–100 ppm) concentration. The equivalent circuit was fitted with Impedance data as shown in Fig. 7c. The equivalent circuit contained the following elements,72
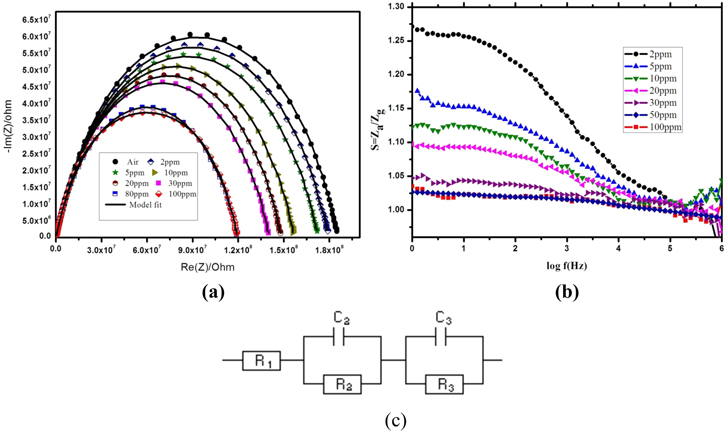
Figure 7. (a) Nyquist impedance of Mn doped ZnO exposed to air and different concentration of H2S gas (2–100 ppm) and (b) Gain curve obtained for Mn doped ZnO was exposed to H2S (2–100 ppm) gas concentration and (c) Equivalent circuit Mn doped ZnO.72
Download figure:
Standard image High-resolution imageR1—Resistance between silver electrode and sensing films,
C2, R2—Grain bulk capacitance and resistance,
C3, R3—Grain boundaries respective capacitance and resistance of Mn:ZnO grains.
The fitted values was reported72 with respect to concentrations of H2S gas and this clearly indicates decrease of R1, R2 and R3 with the increase in C1, C2, C3 and particularly R2 compared with R1 and R3 values drastically decreased with the increase in the concentration of H2S. This signifies that grain boundary resistance values are slightly decreased when compared to grain bulk and resistance between silver electrode and sensing films. It can be further noted that in Fig. 7b a higher sensitivity of H2S was observed from low frequency (1–100 kHz) and no major change in high frequency is observed. This clearly indicates that sensitivity is based on the charge grain and the authors concluded that Mn doped ZnO reveals the high response to H2S (2–100 ppm) toxic gas with response and recovery time at 22 s and 19 s, respectively.72
The authors also reported that Mn sensitized SnO2 for H2S gas (2–50 ppm) sensor at room temperature following the previous experimental procedure. They were able to obtain a sensor with a response (∼6 s) and recovery (∼8 s) with high selectivity towards other gases.73
The changes in EIS curves pattern are ideal in response to the changes in concentration and environment. Figure 8a reports Nyquist impedance for air and H2S gas (2–50 ppm) on exposure to Mn:SnO2 electrode and the semicircle diameter decreased when H2S concentration increased. Figure 8c shows that equivalent circuit of impedance and its fitted values clearly indicates that with the increase in the concentration of H2S (2–50 ppm), the resistance of grain bulk (R1) cannot change with the increase in the concentration of H2S (2–50 ppm). The grain boundary resistance (R2) decreased with the increase in the H2S concentration and constant phase element (Q2) due to increase in the H2S concentration. The potential barrier height grain boundary also decreased. R3 and Q3 indicate the Interface between the electrode and sensing layer resistance and this was also found to decrease with the increase in H2S concentration. Hence, they concluded that grain boundary potential barrier height decreases with the increase in the concentration of H2S as conformed from imaginary part of the impedance as shown in Fig. 8b.73

Figure 8. (a) Nyquist impedance, (b) imaginary part of impedance with frequency for Mn:SnO2 exposed to H2S (2–50 ppm) gas at room temperature, (c) Equivalent circuit.73
Download figure:
Standard image High-resolution imageGusain74 reported flexible Nitric Oxide (NO) gas sensor using PCDTBT—poly[N-9-heptadecanyl-2,7-carbazole-alt-5,5-(4,7-di-2-thienyl-2,1,3-benzothiadiazole)] as the gas sensing electrode. PCDTBT was coated on BOPET flexible substrate by spin coating method.74
Figure 9 shows variation of impedance measurement of PCDTBT film before and after gas (80 ppm) exposure. The measurements were obtained by maintaining the sinusoidal applied potential at 1V and the frequency range was varied from dc to 100 MHz. The Nyquist impedance semi circles plots obtained when exposed to NO gas and fitted with equivalent RC circuit are shown in Figs. 9a and 9b. The authors reported from equivalent RC circuit parameters that capacitance C decreased from 55.6 to 20 pF in NO gas. It represents capacitive impedance losses between the electrodes and PCDTBT sensing film. The PCDTBT film properties were highly affected from surface grain boundary changes. The introduction of structural or chemical changes on the surface of PCDTBT film resulted in changes in their work function. Impedance spectroscopic studies and gas sensing mechanism clearly verified on NO gas before and after the exposure. PCDTBT sensing film NO gas has very high response, selectivity, reproducibility and stability.74

Figure 9. Nyquist impedance semi circles plots when exposed to NO gas and fitted with equivalent RC circuit.74
Download figure:
Standard image High-resolution imageSputtering and spray coatings based gas sensor
Al-Hardan et al.75 reported pure and Cr doped ZnO for oxygen gas sensors. The oxygen gas response was high for Cr doped ZnO compared to pure ZnO. Impedance analysis was performed by varying the frequency of the input signal. Grain resistance (Rg), grain boundary resistance (Rgb) and capacitance (Cgb) values and their variations helped them to predict and analyze the sensing behavior of the developed electrodes. The total impedance calculated was from the following equation.75

Where Zg is the grain impedance and Zgb the grain boundary impedance.
The reports indicate that Semicircle plots [Fig. 10a] were obtained for Nyquist impedance which indicates the presence of a single time constant for pure ZnO and Cr doped ZnO. The diameter of the semicircles increased gradually when wet air was passed with further increase in concentration of oxygen (25% to 100%) it was high. The equivalent circuit containing Rgb, Rg and Cgb components are shown in Fig. 10c. They reported circuit fitting values of resistance and capacitance and the values clearly indicate the grain boundary resistance increased with the increase in the concentration of O2 (0%–100%) but no drastic change in capacitance was observed with change in concentration of O2. One of the significant features is that the presence of incomplete semicircles, Fig. 10b, arises due to the increase in relaxation time because of increase in the grain size and porosity developed in Cr doped ZnO which is totally different from pure ZnO. In the equivalent circuit the constant phase element (CPE) was substituted to Cgb and these value was fitted with CPE in order to describe the behavior of sensing film such as grain boundaries. From these circuit fitted values, Cgb slightly changed, Rg shows insignificant changes for different concentration of O2 (0%–50%). But the Rgb values increased with the increase in the concentration of O2 (0%–100%). Overall, both systems showed similar sensing response and with increase in resistance and the conductivity decreased because the n-type semiconducting metal oxide adsorbs O2 molecules which are converted into O2− ionized species by electrons extracted from the conduction band. The surface states were modified by reducing the carrier concentration and forming a depletion layer near the surface.75
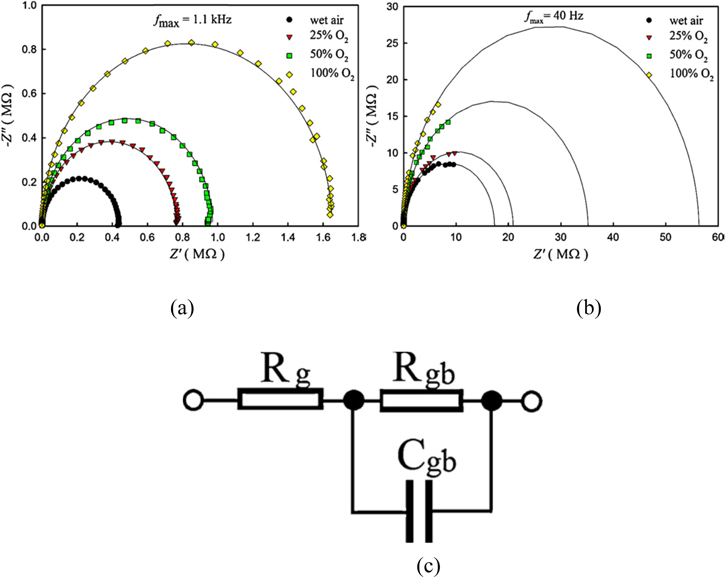
Figure 10. Nyquist impedance of (a) pure ZnO, (b) Cr doped ZnO under wet air and different concentration of O2 (25%–100%) at 350 °C and 250 °C, (c) equivalent circuit of sensor.75
Download figure:
Standard image High-resolution imageAl-Hardan et al.76 reported the deposition of ZnO coatings on Si substrates by radio frequency (RF) sputtering for hydrogen gas sensor application. Silicon dioxide (SiO2) coated on Silicon (Si) used as a substrate for sensing the device. After deposition of Pt metal electrodes and heating component were decorated on tantalum (Ta). The electrochemical impedance analysis was carried out in the frequency range from 100 Hz–2 MHz and 0.5 V ac signal amplitude. The heat treatment of sensing film decreased the resistance and this results in the enhancement in ZnO grain size with reduction in the grain boundaries and also improved the deficiencies of crystal lattice.76
The ZnO film with different concentration of H2 gas was detected at 400 °C and the corresponding plots are shown in Fig. 11. The diameter of the semicircle decreased with increasing concentration of H2 gas (200–1000 ppm) as shown in Fig. 11a. The reported circuit given in Fig. 11c for the fitted values indicates no significant change in capacitance which suggests that the surface charge region on the ZnO grains are affected by H2 gas and follows the reported mechanism.76

Figure 11. (a) The Nyquist impedance of ZnO, (b) H2 gas sensitivity of the ZnO film with different concentration of H2 gas sensor (200–1000 ppm) at 400 °C and (c) equivalent circuit.76
Download figure:
Standard image High-resolution imageFigure 11b shows H2 gas sensitivity of the ZnO film with different concentration of H2 gas sensor (200–1000 ppm) and observed that the sensitivity of the sensor remains constant within the frequency range 100–5000 Hz, which is the range where the space charge region rules the conductivity process. No drastic changes in the sensitivity of the sensor were noticed for the variations in concentration of H2 gas (200–1000 ppm). In the selected frequency values from 100–5000 Hz the curves remained constant. This indicates that the conductivity process is lead by space charge region rules. So, by selecting the ideal operating frequency range, EIS based gas sensor can be tuned to achieve maximum sensitivity.76
Kharashi et al.8 reported the electrochemical behavior of NO gas sensor using partially stabilized Y2O3-ZrO2 (PSZ) porous electrolyte with different concentrations of Al2O3. The addition of alumina increases the resistance of interface between the electrode and electrolyte. The impedance analysis and functional signal amplitude of 50 mV and over a frequency range (1 Hz–1 MHz), and analysis of equivalent circuit supports the electrochemical data using NO gas sensors with respect to electrolyte concentration of Al2O3.8
Figure 12a shows the impedance plots for NO sensors between PSZ and PSZ—2% Al2O3 electrolyte. The high frequency incomplete semicircles are described as electrolyte reaction and low frequency semicircle described as electrode and interfacial reactions. The impedance increases with the addition of Al2O3 due to electrical conductivity of Al2O3 leading to a decrease in the ionic conductivity of electrolyte. This is interconnected with a decrease in capacitance of bulk electrolyte. Consequently high frequency semicircle showed impedance which increased with Al2O3 addition to PSZ with the decrease in bulk electrolyte conductivity values. Al2O3 acts as an insulator and the electrochemical reaction sites are blocked from this along with triple phase boundary (TPB) which is located in Au electrode, PSZ electrolyte and sensing gas phases. The presence of Al2O3 assumes the place of PSZ nano materials along the TPB which leads to the reduction in density of TPB reaction sites, thereby, impeding interfacial reactions. The equivalent circuit elements are8:
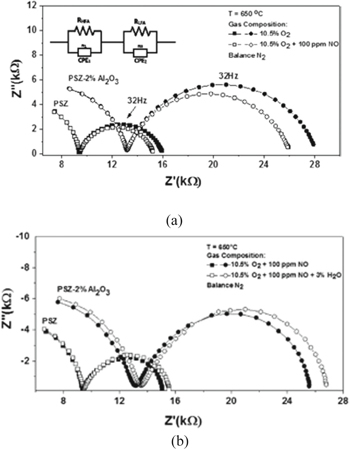
Figure 12. (a) Nyquist Impedance plot of partially stabilized Y2O3-ZrO2—2% Al2O3 for NO gas sensors with equivalent circuit and (b) under dry and humidified gas environments.8
Download figure:
Standard image High-resolution imageRHFA—Resistance of High Frequency Arc
RLFA—Resistance of Low Frequency Arc
The non-ideal capacitance could be settled for the constant phase elements (CPE1 and CPE), corresponding to HFA and LFA. On increasing the Al2O3 concentration to 5 wt% a slow increase in ∣Z∣ values of the sensor was obtained. This could be attributed to the upsurge in electrolyte bulk and grain boundary resistivity due to increase in Al2O3 concentration and this could be responsible due to RHFA. But a 10 wt% addition of Al2O3 hindered electrolyte reactions and interrupted PSZ contact along the TPB such that interfacial reactions were limited. Small changes in impedance arcs from their normal semi-circles were attributed to the presence of fitting elements CPE1 and CPE2. The CPE2 values decreased with Al2O3 addition and its capacitance values. These sensors can also be operated under humidified gas conditions that cause the impedance to increase in case of LFA shown in Fig. 12b. The chosen electrolyte material and its coating process differ with the behavior of NOx sensors in the water vapor environment as the operating parameters and material processing changes differ. Thus, higher interfacial resistance has limited TPB reactions and the same was observed with PSZ-Al2O3 sensors.8
Navale et al.77 reported hierarchical zinc oxide (ZnO) nanostructured films, composed of nanorods (NR's) and bunch of nanowires (BNW's) developed on a glass substrate by superficial thermal evaporation method.77
Figure 13a shows that Nyquist Impedance of ZnO NR's and BNW's sensor recorded under air and 100 ppm NO2 gas at 200 °C along with its equivalent circuit (b). The authors reported equivalent circuit shown in Fig. 13b fitted with values of bulk resistance (R1), capacitance (C1), grain boundary resistance (R2) and capacitance (C2) respectively. On exposure of NO2 gas to ZnO NR's and BNW's, the resistance of grain boundary increases accompanied by a decrease in capacitance value as NO2 gas reacts with the adsorbed O− and the later gets adsorbed on the surface of ZnO. On exposure to NO2 gas, oxidation takes place resulting in electron carriers which carry the bulk charge on ZnO surfaces. This is followed by an increase in electrical resistance as the charge carrier electrons on the surface of ZnO sensor decreases. The lowest concentration detection of NO2 was 1 ppm with this ZnO sensor possessing good response and recovery time77 and Cui et al. also reported similar EIS based NOx sensing.11
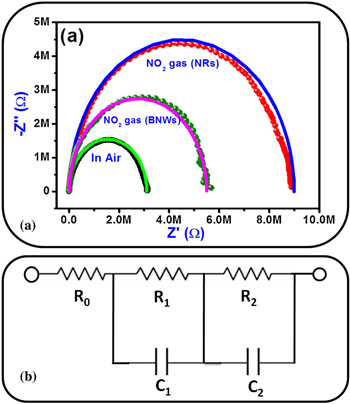
Figure 13. (a) Nyquist Impedance obtained for ZnO NR's and BNW's gas sensor under air and NO2 gas (b) equivalent circuit.77
Download figure:
Standard image High-resolution imageInterdigitated, screen printed and drop casting based gas sensor
Bhardwaj et al.78 reported detection of NO2 using Ni, Co, Fe composite with SnO2 as the sensing electrode to construct zirconia based sensors.78 Fe2O3/SnO2 (2:1) based NO2 gas sensor exhibited high sensitivity, quick response and recovery time [21 s and 58 s)], very excellent repeatability and high selectivity compared to other gases.
The Nyquist impedance plot given in Fig. 14a shows two semi circles where the first semicircle is for YSZ electrolyte. As the concentration of NO2 changes (0–100 ppm) another impedance semicircle (inset) is obtained for metal oxide sensing electrode with platinum as reference electrode and interfaces between sensing electrode and YSZ. Bode impedance shows considerable changes in imaginary part only in the frequency region of 1 to 0.1 Hz shown in Fig. 14b and the authors also reported equivalent circuit parameters. The reason for this type of impedance behaviors occurring at low frequency range is due to the polarization that occurs at the interface of SE/YSZ or diffusion-related reactions. The Zimg was decreases with the increase in NO2 concentration as the interfacial polarizations.78
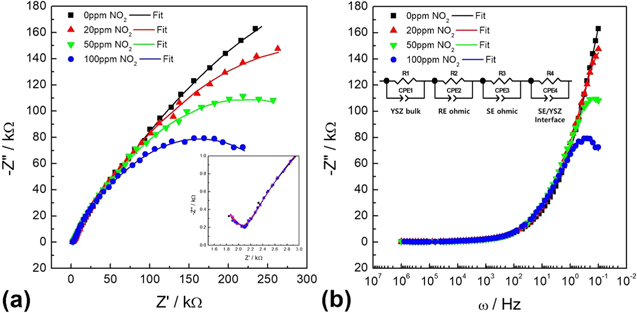
Figure 14. (a) Nyquist impedance plot (b) Bode impedance spectroscopy with equivalent circuit for sensor with Fe2O3-SnO2 with different NO2 (0–100 ppm) at 650 °C.78
Download figure:
Standard image High-resolution imageSchipani et al.79 reported conduction mechanisms of SnO2 nanowire based gas sensors. The equivalent circuit was simplified by removing capacitor element as the capacitance is around 0.01 pF and the substrate is represented by a constant phase elements (CPE) at the bottom. Figure 15a indicates that the impedance for controlled atmosphere (air and 5.0 grade N2). AC signal (amplitude−100 mV) was used without an external bias. The curves recorded for nitrogen and air look similar and the overlapping indicates that a change in conduction mechanism is improbable. As the temperature increases the diameter of the semicircle decreased and its conductivity increased which confirms that an elevated temperature is required to activate current transportation.79 Figure 15c shows the results of the EIS measurements carried out under air and 5.0 grade N2 as controlled atmosphere. A good agreement with the circuit is indicated for the entire frequency by comparing with the dashed lines. No change in conduction mechanism was found as both arcs were similar.79 As the temperature of the system was increased the semi-circle radius becomes smaller marking the fall in resistance values. This further confirms that temperature of the system is key to its sensing activity but a modest RC circuit cannot be used, as the semicircles have a reduced height with imperfections. Hence, Figs. 15b and 15d model was proposed as the data could be properly simulated.79
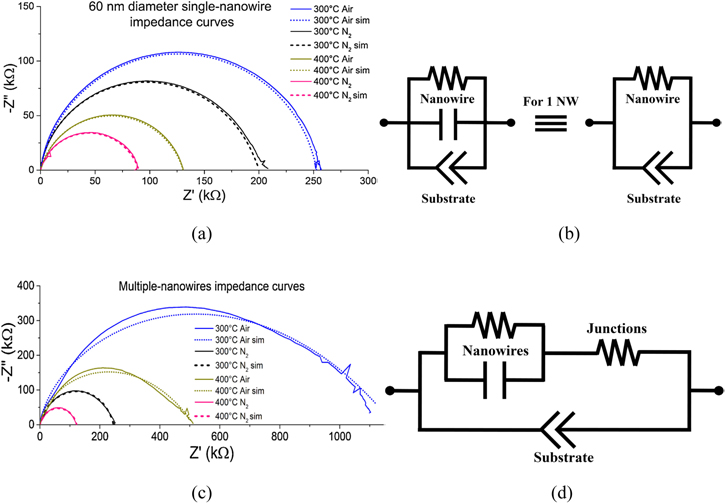
Figure 15. (a) and (c) Nyquist Impedance for different temperatures with N2 atmospheres for single and multiple nanowire based sensor, (b) and (d) Equivalent circuit.79
Download figure:
Standard image High-resolution imageBarbosa et al.80 reported a gas sensor to detect NO2, H2 and CO gas using Ag and Pd decorated on SnO. An increase in sensor response was observed for H2 and CO, but with NO2 oxidizing gas the sensor response to decreased. The various approaches to achieve maximum response and selectivity were presented by them.80
Figure 16 shows the impedance behavior of the gas sensor and Ag-SnO was found to have the maximum impedance values at all temperatures as shown in Fig. 16c. Second semicircle initiated at lower frequencies was carried out to study the processes that occur at the interface of the electrode discs. Ag-SnO electrode possesses has an electron depleted layer which is encouraged by Ag/Ag+ oxidation. In case of Pd sensitized electrodes there is a formation of a Schottky barrier accompanied by depletion of electrons near the semiconductor-metal junction, but with a lower barrier.80 The presence of active nanoparticles of Pd and Ag on SnO disks increased the sensor response to reducing (H2 and CO) a decreased response to oxidizing gases such as NO2. The sensor possesses noble response and selectivity due to its catalytic activity. The nature of catalytic activity is different for the two dopants. The presence of Pd results in chemical sensitization where H2 to 2H split-over conversion takes place tracked by spillover whereas for Ag it is electronic sensitization.80

Figure 16. Nyquist impedance for pristine SnO and Pd, Ag-decorated SnO with different working atmospheres and temperatures: Air (synthetic, dry) at various temperatures (a) 100 °C, (c) 200 °C and (e) 300 °C; (b) 20 ppm CO at 100 °C (d) 20 ppm NO2 at 200 °C and (f) 20 ppm H2 at 300 °C.80
Download figure:
Standard image High-resolution imageThe presence of Ag on the surfaces changes the conductivity primarily causing silver oxidation and reduction (Ag0/Ag+ equilibria) leading to electron-depleted regions on exposure to oxidizing and reducing gases. The sensor response is predicted based on the deconvolution of EIS curves. For Ag doped samples two semicircles have been obtained indicating the presence of two different time constants. The response to Pd doped and undoped samples was contrastingly different as the H2 gas interaction for Ag doped nanoparticles was controlled by interfacial resistance between Ag nanoparticles leading to lower stability of the device. Working temperature of the sensor plays a great role in deciding its performance as a change in the gas-solid interaction mechanism is found.80
The optimum temperature of operation changed according to each gas, as the result of the diverse properties. For Pd-decorated materials, CO sensor had a response with Pd doped nanomaterial at temperatures below 150 °C as the nature of absorption of CO by metal nanoparticles is preferred shown in Figs. 16a and 16b. For NO2 gas the sensor reaction was observed below 200 °C due to direct interaction with electron pairs shown in Figs. 16c and 16d and for H2 were interacts are related to the reaction with O2 species a higher temperature of 300 °C is obtained shown in Figs. 16e and 16f.80
Sekhar and Kysar using Pt electrode and ionic liquids as electrolyte fabricated ammonia gas sensor using paper substrate at different temperatures. The impedance analysis was carried out in the frequency range of 1 MHz to 0.1 Hz frequency with perturbation of 10 mV and total impedance of response and recovery tested at the frequency range of 0.1 Hz.81
The Nyquist plots obtained for the sensor on exposure to 15 ppm of NH3 and air (base gas) is given in Fig. 17. The major advantage of using EIS is to identify the influencing contributors to the bulk electrolytes and electrode-electrolyte interface with scattered frequency. The conductivity of the bulk sensor is a result of the combined effect of conductivity of the electrolyte, electronic conductivity of the electrode leads and the electrolytes ionic conductivity.81

Figure 17. Nyquist impedance under air and NH3 (15 ppm). In this curve, the higher frequency points are found towards the left and origin. The arrow mark indicates the higher frequency range (ω) points are to the left and toward the origin. A delicate difference is seen in the low frequency points which indicates that changes could occur at the Electrode/Electrolyte interface resistance on coming in contact with NH3 gas in comparison with air.81
Download figure:
Standard image High-resolution imageThe high frequency part in Nyquist plot is mainly composed of the ionic conductivity changes in the electrolyte. The changes in bulk conductivity of the sensor would be estimated from the ionic conductivity of the electrolyte. A very small change occurs in the low frequency range that could be attributed to the possible change in interfacial electrode-electrolyte resistance at the point when the electrode comes in contact with NH3 gas. The impedance data were fitted with an equivalent circuit to elucidate the phenomena. The circuit consists of R (two parallel branches) along with C connected in series to mimic the electrolyte (E) and I represents the interface of electrode/electrolyte/gas. On exposure to ammonia and air atmosphere RE was found to be 72.56 K ohm and CE 67.85 pF, whereas interface resistance equal to 256.2 K and capacitance value 9.91 μF. A change in interfacial resistance between ammonia and air was established to be 26.6 K. The Chi-square (χ2) value for all the plots is equal to 1E-5.81
Dai et al.82 reported impedancemetric based NH3 toxic gas sensor using Mg-doped lanthanum silicate oxyapatite (La10Si5MgO26) [LSMO] solid electrolyte and CoWO4 sensing electrode. The response and recovery time are very fast under NH3 at 0.1 Hz.82
The Fig. 18 represents the Nyquist impedance of NH3 (20–500 ppm) at different working temperatures (a) 400, (b) 550 and (c) 700 °C. The plots reveal that at the temperature of 400 and 550 °C, two semicircular arcs that are overlapping each other along with an incomplete semicircular arc is present. The semicircle arc corresponds to High frequency—grain impedance Middle frequency—Grain boundary impedance and Low frequency—Electrochemical reactions at CoWO4 electrode/LSMO/NH3. Increasing the temperature above 700 °C resulted in disappearance of the high frequency arc and complete appearance of low frequency arc. The semicircular arcs in Nyquist plots at 400 °C & 500 °C is contributed by the bulk impedance of LMSO electrolyte and impedance values of the electrolyte are not disturbed by the presence of NH3 gas. But it was observed that the electrochemical reaction taking place at the Triple Phase Boundary (TPB) is responsible for the low frequency arc and processes good sensitivity.82
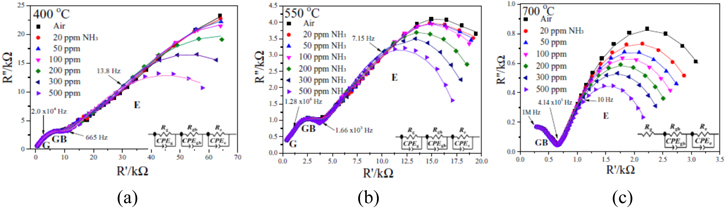
Figure 18. Nyquist impedance plot of NH3 (20–500 ppm gas sensor with fitted values as solid lines) with different temperature (a) 400, (b) 550 and (c) 700 °C (inset-equivalent circuit).82
Download figure:
Standard image High-resolution imageThe equivalent circuits proposed based on the Nyquist plots show the basic awareness into the operating mechanism of the fabricated sensor. There is respectable agreement between the measured and fitted values that is points and solid lines, respectively. In case of the fits for sensor tested at 400 °C and 550 °C, the equivalent circuit parameters Rg and CPEg correspond to the high frequency area and they describe the grain resistance and grain capacitance of this system respectively. Similarly Rgb and CPEgb resemble the middle frequency area of the plot which justifies the grain boundary resistance and capacitance respectively.82
Ramaiyan et al.83 reported yttria stabilized zirconia (YSZ) based gas sensor with different gases like NH3, NO, NO2, C3H6 and C3H8. Among them NH3 gas was found to have high response and high selectivity compared other gases.83
Figure 19 shows Au/YSZ/Pt sensor response under 100 ppm of different gases in 10% O2 and the remaining gas is N2 recorded at a temperature of 560 °C. The impedance curves can be divided into two halves low and high frequency regions. The two distinct curves were observed for the present system where at high frequency the test gas response is independent and points to the YSZ electrolyte.83

Figure 19. Nyquist impedance for the Au/YSZ/Pt gas sensor at operating temperature of 560 °C (a) zero bias with 100 ppm of different gases, (b) different bias in base gas and (c) Equivalent circuit.83
Download figure:
Standard image High-resolution imageIn case of low frequency response the gas environment plays a significant role and the curve is highly dependent on it points to the interfacial reactions which occur at the triple phase of YSZ, electrode and gas phase. The results indicate the changes occurring in the presence of test gases in the low frequency resistance cannot be directly correlated to the mixed-potential response. The selectivity of the device can be changed by operating the sensor under bias.83
Liu et al.84 reported stabilized zirconia based NO2 gas sensor using CoTa2O6 electrode. The samples were sintered at 1000 °C electrode to obtain high response and recovery time, selectivity, good reproducibility, and long-term stability.84
The complex impedance spectra were analyzed to study the NO2 selectivity of the sensor attached with CoTa2O6-SE sintered at 1000 °C and in the presence of other gases in the environment (Fig. 20). Based on literature reports the resistance at higher frequencies for the sensor is mainly donated to the bulk resistance of CoTa2O6. The intersection of the large semi-arc as observed from the curves gives the interfacial resistance given by the resistance value at lower frequencies with the real axis. In case of high frequencies, the resistance was almost constant irrespective of the test gas samples.84

Figure 20. Impedance for CoTa2O6 sensing electrode sintered at 1000 °C in air and 100 ppm of different gases under 50% of RH (Relative Humidity) and 100 ppm of NO2 under 20% RH at working temperature of 650 °C.84
Download figure:
Standard image High-resolution imageChanges in the interface resistance measured at different atmospheres revealed the electrochemical catalytic activity towards the examined gas species. Thus, it can be speculated from these changes in the interface resistance that the catalytic activity to the rate of electrochemical reaction of NO2 for the fabricated device at Triple Phase Boundary (TPB) was found to be higher. It causes increased sensing magnitude towards NO2. The electrochemical reaction to the catalytic activity of the reactant gas NO2 at TPB lower that 20% relative humidity was found to be high and is in line with the changes in the results of the response values.84–89
Balasubramani et al.90 reported the fabrication of SnO2/rGO based H2S gas sensor with detection limit ranging from 1 to 100 ppm at room temperature with high selectivity towards H2S compared to other gases.90
It was corroborated by Nyquist plot which strongly support the impedance finding. The grain boundary resistance and barrier height decreased when the concentration of H2S gas increased from 1 to 100 ppm. The results support the performance of stable H2S gas sensor on n-SnO2/rGO composites at room temperature. The imaginary part of impedance and Equivalent circuit graph are shown in Figs. 21b and 21c and similar results are discussed in detail in different types of gas sensor part.71,90 Nyquist Impedance spectroscopy analysis clearly gives the exact information about interaction between sensor surface and target gases.90 A comparison of the various impedance based gas sensor is summarized in Table I.

Figure 21. (a) Impedance (b) Imaginary part of impedance and (c) Equivalent circuit graph of SnO2/rGO under air and different concentration of H2S gas (1–100) ppm.90
Download figure:
Standard image High-resolution image
Table I. A comparison of Electrochemical Impedance Spectroscopy based gas sensors.
| Sensing Material | Analyte Gases | Temperature (°C) | Concentration/LODs (ppm) | Frequency Range | References |
|---|---|---|---|---|---|
| La2CuO4/YSZ/Pt | NO | 500 | 0–650 | 10 Hz to10 MHz | 91 |
| LSM/YSZ/LSM | NO2 & NO | 575 | 100 | less than 1 kHz | 92 |
| La10Si5MgO26 | NH3 | 400–700 | 20–500/10 | 1 MHz to 0.1 Hz | 93 |
| Au/YSZ/Pt | NH3 | 560 | 100 | 1MHz to 0.1 Hz | 83 |
| Ionic Liquid/Pt | NH3 | Room Temperature | 5–25/1 | 10 Hz to13 MHz | 81 |
| MnNb2O6 | SO2 | 700 | 5/ 50 ppb | 0.1 Hz–1 MHz | 94 |
| Li2CO3/ BaCO3/YSZ | CO2 | 873 K | 1.5 vol% | 1 Hz–1 MHz | 95 |
| PANI/PVS | NH3 | Room Temperature | 0–20 | 10 to 100 Hz | 96 |
| SnS2 | NO2 | 120 | 10/0.6 | MHz | 97 |
| TiO2 | NO2 | Up to 250 | 20 | 0.1 Hz to 10 MHz | 98 |
| Fe2O3-SnO2 | NO2 | 650 | 100 | 0.1 Hz–1 MHz | 78 |
| rGO/ZnO | H2S | 90 | 2–100 | 1 MHz down to 1 Hz | 71 |
| SnO2/rGO | H2S | Room Temperature | 1–100 | 1 MHz down to 1 Hz | 90 |
| Mn doped ZnO | H2S | 150 | 2–100 | 1 MHz down to 1 Hz | 72 |
| Mn sensitized SnO2 | H2S | Room Temperature | 2–50 | 1 MHz down to 1 Hz | 73 |
| WO3-SnO2 | Ethanol | 95 | 500–5000 | 100 Hz to 20 MHz | 99 |
The quality and accuracy of a sensor and its key characteristics can be evaluated based on two parameters namely Limit of Detection (LOD) and Limit of Quantification (LOQ). LOD refers to the least limit of detection of an analyte gas in a given sample and in its absence a null value should be detected. LOQ gives the merit of the standard curve from which the least analytical concentration can be determined. There are a few reports are available highlighting the LOD and LOQ for EIS gas sensors but more data are required to compare them.100–102
Conclusions and Future Directions
EIS has been playing a crucial role in the development of toxic gas sensors and it is one of the simplest methods for gas detectors. Nyquist and Bode plots combined with the fitting of equivalent circuits enable us not only developing the common electrode systems for gas detection but also predicting the suitable electrochemical mechanism behind it. The type of impedance data obtained for different gases and different substrates is always not the same. The impedance changes for a particular gas are commonly accredited to the transport phenomena consisting of adsorption and charge transfer. Several parameters including identification and quantification of the chemical reactants, chemical reaction and mass transfer rates to grain boundary resistance can be obtained. The challenges in sensor fabrication and development of portable EIS analyzers pose immediate tasks which need to be fixed. Further, understanding and detailed analysis of the spectra lead to elucidation of donor electron concentration, its depletion rate, interface phenomena according to the changes in each environment. Caution should be exerted in selecting the typical equivalent circuit model for the data they have produced for the simple reason that "best fit" condition alone cannot fit the experimental measurements. It must physically make sense what is already known for the material used and ideally modeled using the appropriate mathematical model.
The future success of commercialization of EIS based sensor is to produce portable EIS analyser equipment's that are required to be connected to the sensor and this would also reduce the cost of its implementation. But, considering sensitivity of the technique and toxic nature of the gases that are lethal to humans it can change the sensor market. The use of EIS for continuous monitoring of the environment also needs to be investigated. The combination of MEMS based micro heaters could solve the problems of detection at high temperatures, the long term stability of the sensors and in specific environments which could involve fouling to degradation have to be further investigated. Impedance spectroscopic techniques are more innovative compared to the existing techniques and can be further explored with a mixture of doped metal oxides, nanowires, nanoparticles, novel green synthesis methods to obtain them to the highly conductive graphene.
Acknowledgments
This work was financially supported by UGC SAP DRS-I (Ref. No. F.540/16/DRS-I/2016(SAP-I)), Department of Analytical Chemistry, GNR-Central Instrumentation Center (DST-PURSE), and DST-SERB (Ref No. EEQ/2018/000979), Department of Physical Chemistry University of Madras, Chennai, India. One of the authors V. Balasubramani was supported by Council of Scientific & Industrial Research with Senior Research Fellowship (Ref. No. 09/115/0791/2019-EMR-I), New Delhi, India.