
Abstract
Mass transport losses are one of the least understood contributors to the over potential in proton exchange membrane water electrolyzers. In order to explore the possible contribution of porous media two phase flow to these losses, we have used neutron-imaging techniques and took a closer look at water and gas distribution profiles at various current densities, ranging from kinetic to mass transport-governed regions at ambient and elevated pressures. Gas volume and velocity have been computed through quantified neutron images and the two-phase flow regime has been identified. Using sub-second imaging, information on dynamics of gas pathway establishment and re-imbibition during startup and shutdown of electrolyzers has been acquired. Using X-ray tomography and simulated mercury intrusion porosimetry coupled with capillary pressure calculations, the hydrophilicity of the internal surfaces of the porous transport layer material has been determined.
Export citation and abstract BibTeX RIS

This is an open access article distributed under the terms of the Creative Commons Attribution 4.0 License (CC BY, http://creativecommons.org/licenses/by/4.0/), which permits unrestricted reuse of the work in any medium, provided the original work is properly cited.
Due to increasing carbon emission limits, intermittent sources of energy are becoming more and more visible in overall grid capacity shares. Nowadays renewable sources of energy are covering circa 40% of the annual demand increase.1 Reducing CO2 and other emissions (e.g. NOx and SOx) released to the air is indeed an important issue, but it is equally as crucial to maintain the energy system stable and sustainable. To this end, it is imperative that the energy storage technologies are introduced on a large scale, what will utilize excess energy, suppress curtailment and serve as back-up energy source for the grid when the production cannot satisfy the demand. Polymer electrolyte water electrolyzers (PEWE) could be a part of the solution.2,3 An ability to start on demand almost immediately without lengthy run in procedures (e.g. heat up) makes PEWE a perfect candidate to be coupled with intermittent sources of energy, especially in remote areas.4,5 However, improvements related to durability, resistance to water impurities, and decrease of operation cost are considered key aspects for a successful techno-economical market penetration.3,6 There are also industrial niche markets like space applications and life support systems for enclosed environments where performance and cost are outweighed by the advantages specific to PEWE (e.g. gas purity of produced H2 and O2). For these applications, further development of the technology is of great interest.7–10
The sluggish anodic oxygen evolution reaction (OER) has a major impact on the performance, which is why many studies have been conducted in this field.11–17 To be able to minimize the losses associated to OER reaction; it is necessary to gain fundamental understanding of the thermodynamic and mass transport mechanisms. In PEWE the water necessary for the reaction is supplied through the anodic porous transport layer (PTL). The PTL is also responsible for extraction of reactant oxygen gas making the mass transport a two-phase flow problem.18 Due to possible gas blockage at the catalyst layer surface, local water depletion can be expected what promotes reduction of active catalyst area. Elucidating the underlying origins and processes behind mass transport is necessary to push the limits of PEWE performance and material development.
Currently, the theory behind two-phase flow in the porous transport layers of PEWE is not well established. Numerous experiments have been carried out on this topic and yet the conclusions seem to be contradicting each other.
Suermann et al.18 carried out extensive study of the impact of the sintered titanium PTL morphology (SIKA T5, T10 and T20; GKN) on the performance to explore mass transport limitations and define the optimal porous material geometry. By employing EIS techniques and overpotential breakdown, they were able to determine ohmic, activation and mass transport losses. Finally, it was concluded that in general, materials with smaller particles yield better performance. It was shown that mass transport overpotential tends to decrease with increasing pressure and increase with current density. Following up, the recent studies by Schuler et al.19,20 showed that the interface between PTL and CL has an impact on all three loss categories namely: kinetic, ohmic, and mass transport. The X-ray tomographic microscopy (XTM) characterization and in-depth electrochemical performance breakdown of a systematic matrix of titanium fibre materials revealed that the interfacial contact area (ICA) between PTL and CL is a correlation parameter. The catalyst layer resistance was identified to be the governing resistance for the mass transport loss for PTLs which is scaling with inverse catalyst activity/utilization as already shown in the field of polymer electrolyte membrane fuel cells (PEMFC).21 PTL transport resistance contributed only between 10 to 20% to the overall mass transport losses.
To investigate the topic of mass transport losses which potentially comes from a two-phase flow in PTL or/and CL various studies have been completed.
Lee et al.22 developed a PTL-on-chip with which a measurement of the gas transport through a defined porous media was possible. The PTL manufactured by lithography was enclosed in a flow cell through which, a solution of ethanol and fluorescent sodium salt was flown. The setup allowed the tracing of the gas pathways, which were percolating through the liquid. It was observed that the gas pathways are formed in one pore at the time and that with increasing gas flow rate the gas saturation decreased. In this study, neither typical PEWE materials nor representative fluids were used. The experiment itself however served as a qualitative input for two-phase flow modelling purposes. In the follow-up study, Lee et al.23 investigated the temperature impact on two-phase flow based on neutron imaging. It was shown that with increasing temperature the saturation of the PTLs decrease. According to the study it also appears that at elevated temperatures (60 oC and above), the current density has an impact on the saturation of the anodic PTL.
Hoeh et al.24 used an electrochemical cell with sintered titanium PTL on the anode side and carbon paper gas diffusion layer (GDL) on the cathode, which is nowadays widely used in fuel cells and electrolyzers in both industrial and scientific applications. Utilizing X-ray radiography, it was possible to capture the hydrogen gas bubble formation followed by its detachment from the surface of the GDL. X-ray radiography was performed in a through-plane configuration (beam direction normal to catalyst coated membrane (CCM) plane). After employing special flow field geometry authors claimed to have been able to separate signals from anode and cathode water. The study concluded that with increasing current density, more bubble formation areas can be observed on the surface of the GDL which is in contradiction with the study of Lee et al.22 The differences in wettability of carbon based GDL and Ti-based PTL makes the direct translation of gas saturation inside pore network from experimental conditions to technical scenario difficult.
Another study has been carried out by Selamet et al.,25 which was focused on implementing simultaneous optical and neutron imaging techniques. This requires the use of a special cell design and components, which are not present in the state of the art PEWE applications. Imaging was done in through-plane configuration which generates additional implications for the data interpretation as discussed by Hoeh et al.24 To mitigate the problem of mixing anode feed water and drag water signals, the group decided to excessively purge the cathode compartment with inert gas, but it was not possible to eliminate drag water entirely from the PTL. In addition, it was observed, that the cell performance was affected by the presence of drag water on the cathode side, since hydrogen removal from the cathode side seemed to be hindered.
The study released by Panchenko et al.26 employed an in-plane neutron imaging for two-phase flow within sintered and fibrous PTLs with interdigitated flow field channels. Because of the chosen geometry, water had to flow in in-plane direction through the PTL in order to leave the cell. This study focused on rapid starts of the cell to capture the gas pathways breakthrough patterns and determination of optimal water supply stoichiometry. The study concluded that the feed water stoichiometry λ should be above 100, otherwise the cell would be subjected to the discontinuous pulsed operation. Electrochemical analysis revealed 2–3 times lower optimum of lambdas for conventional through-plane transport.27
Arbabi et al.28 established a three-dimensional CFD model for oxygen bubble transport in PEWE PTLs. They assumed that the flow is capillary dominated and that viscosity forces are negligible. The model has been validated numerically but the flow regime has not been confirmed experimentally in operating electrolyzer cells.
Leonard et al.29 published a study where the two-phase flow transport was investigated using operando X-ray tomography shedding light on the oxygen bubble formation and its removal from the porous media. The bubble residence time and size were determined for current densities up to 200 mA cm−2 and validated by a simple model. Due to the X-ray imaging constraints the authors had to use carbon paper porous media which degrades under normal operation on the anode side. The authors assured however that in the experiment duration no significant damage was observed.
Seweryn et al.30 performed an operando neutron imaging study of PTL water saturation level for current densities ranging from 0.1 to 2.5 A cm−2. The results were counterintuitive at the first glance. Constant water saturation profiles were found to be independent of current density, implying that gas pathways are not a function of gas production rate. The study targeted the current densities in mass transport driven regimes and was conducted only for ambient operating conditions what lead to the parameter matrix expansion in further experiments.
The objective of this study is to elucidate missing fundamentals of the two-phase flow in PTLs and provide new insights into the controversially discussed topic of gas saturation profile and its establishment. The present study extends the parameter range in order to identify contributions of two-phase flow in the PTL to the mass transport losses. A current density range from the kinetic to the mass transport governed region was investigated for a variety of pressures. Additional part of study focused on transient flow mechanisms upon shutdown and start-up of the electrolyzer.
Experimental
Electrochemical cell
In order to achieve the high contrast from neutron imaging experiments, an in-house designed cell was used. The cell housing made of aluminium and steel was machined in a way that for both through and in-plane imaging configurations, the neutron beam has to penetrate the minimal amount of the material. The size of the active area was 1 cm2, and the catalyst coated membrane type used was commercial Nafion N117 provided by Greenerity (Ir-based anode and Pt-based cathode). Sintered titanium (Sika T10, GKN Sinter Metals Filters GmbH Germany) PTLs of 1 mm thickness were used. The experimental apparatus was equipped with heat controller (KSV Vario) which was coupled with K-type thermocouples and rod heaters used to heat up the cell body. Because of the high heat capacity of the cell and preheating of the water in the water tank, we did not observe any water temperature fluctuations upon changing operating conditions as well as in long-term experiments.
Sample preparation and experimental conditions
The cell has been assembled under wet state conditions in order to shorten the conditioning period as much as possible. Sintered titanium PTLs are commonly considered to be hydrophilic with contact angles of circa 50°,31 but the surface roughness, impurities, and storage conditions can heavily influence this value,32 which is why it is important to carefully pre-treat the PTLs. We found that ultra-sonicating PTLs for 30 min in Milli-Q water (18 MΩ cm) to remove gas bubbles and inorganic impurities, is enough. During the entire experiment, the feed water flow was kept at constant flow rate of 150 ml min−1. CCMs were immersed in the ultrapure water overnight in order to ensure proper membrane humidification prior to experiments. As a result, the dry reference images were taken after the experiments by drying the cell with dry nitrogen gas.
X-ray tomographic microscopy
Bulk properties of the PTL dry structure were characterized using a CT-scanner phoenix nanotom m (General Electric, Germany). To suppress beam-hardening effects, a 0.25 mm thick copper filter was used. Acquisition parameters were set to 60 kV, 310 μA and 1500 projections over 360° were acquired with an exposure time of 1500 ms. A voxel cube edge length of 2 μm was chosen. The substantial contrast between Ti and air enables a simple manual thresholding for segmentation. Continuous pore size distribution as well as simulated mercury intrusion porosimetry (MIP) were performed in the software ImageJ. A region of interest (ROI) of 2000 × 1000 × 800 μm was chosen, which is about ∼20 times higher than the representative elementary volume (REV) of T10.19 Continuous pore size distribution (PSD) was computed based on 3D maximum sphere fitting with ImageJ. Furthermore, it was of interest to quantify throat sizes representing the minimum pore size that connects two neighbouring pore volumes. MIP can quantify the accessibility of the total pore volume as a function of pore throat sizes. Artificial spheres with different radii are introduced into the pore space from a defined reference plane of the PTL facing towards the catalyst layer. The spheres are introduced in the direction perpendicular to the reference plane. Local pores, smaller than the introduced sphere sizes act as bottlenecks and limit the access to further PTL pore volume. Differences between PSD (fully available pore volume) and MIP PSD (bottleneck restricted pore volume) reveals limiting pore sizes.
Neutron imaging
To extract the data from raw neutron radiograms it is necessary to apply an advanced image processing sequence, which in general consists of filtering, averaging and referencing. Further information on the image processing can be found in the literature.33,34 Quantitative information can be obtained by adding an extra step to the processing, which utilizes Beer-Lamberts law:
where  represents the incident neutron beam flux,
  the attenuated neutron beam flux,
  the attenuating material thickness, and
  the neutron beam attenuation coefficient.
The neutron beam is attenuated by all matter it passes through, which makes the separation of the contribution of each of the components to the flux reduction necessary. To tackle this problem it is a common practice to use reference images, which serve as a base case that already includes information on the attenuation of all the components, which are not related to the experiment signal (e.g. cell housing, flow fields). Such data treatment procedure will reduce the image using the reference to the point, where only the signal from desired components will be isolated and presented.
An additional issue, which has to be addressed when considering quantification of neutron images, is the contribution of scattered neutrons to the transmission image. This concern can be solved by subtracting a scattered background (SBKG) image from experiment images. The SBKG is generated based on the image of the cell taken with so-called black body (BB) placed before the cell in the beam path. The BB is usually a grid of dots made of a material which strongly attenuates the neutrons, so that the signal which appears on the image behind the BB holds nothing else than the scattering contribution.
The data was obtained for two different neutron-imaging setups both measured at SINQ facility of the Paul Scherrer Institute. One was prioritizing spatial resolution in order to investigate steady state conditions measured at NEUTRA35 thermal neutron beamline. A pixel size of 6 μm in direction normal to CCM plane was reached thanks to the use of a tilted neutron detector configuration.34 The resolution provided by such setup is appropriate to capture phenomena in the PTL structure (1 mm thick) and membrane N117 PEM (177 μm dry thickness). The imaging acquisition time was set to 20 s. For each data point, at least 30 images were taken once the steady state was reached.
The second neutron imaging setup targeted transient phenomena and was realized at POLDI36 Neutron Time of Flight Diffractometer beamline adapted for neutron transmission radiography. The spatial resolution had to be reduced, resulting in a pixel size of 25 μm. The images were taken at various exposure times ranging from 10 to 200 ms. Due to safety measures and limited infrastructure capabilities, the cathode compartment was purged with inert gasses (dry N2(g)) and at higher current densities the flow of nitrogen was increased, which resulted in lower water thickness in the cathode PTL.
Flow characterisation calculations
Flow can be characterised by dimensionless capillary number  and viscosity ratio of fluids
  which are calculated according to Eqs. 2 and 3, where
  is the gas velocity,
  the dynamic viscosity and
  the interfacial contact angle.
The effective gas speed  is calculated based on the volumetric flux of oxygen
  according to Faraday's law, the difference in the water thickness in the PTLs
  at i = 0 mA cm−2 and at operation current density
  as well as total thickness of the PTL
Results and Discussion
The study comprises two data sets, where one focuses on high spatial resolution to resolve steady state phenomena whereas the second one was performed in a mode that allows short exposures to study transient flow mechanisms within the PTLs. In the steady state configuration, the impact of current density and system pressure on water/gas distribution have been investigated. Images taken at short exposure times were used to determine the periods needed to establish saturation profiles and to reinvade the pore network by water. Finally, the data served as an input for calculations necessary to obtain the flow characteristics and capillary pressures in the pore network.
Impact of current density on water distribution
Radiograms shown on Fig. 1a represent PTLs and their water content separated by the CCM. From these images, the saturation profiles were derived. The 2D saturation plots have been color coded, in a way that the deeper the blue the higher the water saturation. Figure 1b shows water thickness profiles as a function of the distance away from the CCM for both anodic and cathodic PTLs at 50 °C, ambient pressure and for a wide range of current densities from 0 to 1 A cm−2.
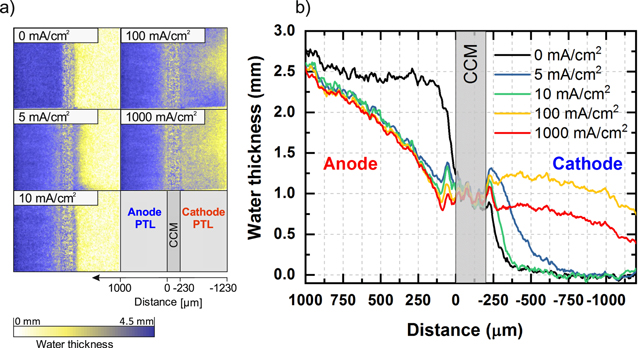
Figure 1. (a) Radiograms representing water thickness within membrane electrode assembly (MEA) for various current densities. (b) Water thickness profiles across the MEA obtained from respective radiograms.
Download figure:
Standard image High-resolution imageSince the neutron beam penetrates through the entire PTL in the direction perpendicular to the CCM plane, each pixel represents an average water saturation value. For each distance away from the CCM, the water thickness has been calculated and plotted for different current densities. The saturation level of the bulk area of the anode PTL stays unaffected regardless of the current density between 5 and 1000 mA cm−2 implying stable and established gas pathways independent of operating conditions. There is however, a significant peak in the water thickness very close to the CCM, and it is unclear to what degree this feature can be classified as contribution from water, catalyst layer, or being simply an imaging artefact stemming from resolution constraints and cell micro-movement over time, which would affect referencing in the image-processing step.
The water content on the cathode side increases with current density except for the case of 1 A cm−2 where it was necessary to increase the purging gas flow rate due to safety reasons as described in the experimental chapter. The conditions on the cathode do not affect the anode side gas saturation due tight separation by a thick solid membrane (N117), which a reason why changing gas flow rate on the cathode side was not considered as an issue during the experiments.
Pressure variation
For pressures ranging from ambient to 8 bar, a variation of current density and associated saturation profiles have been investigated. Relative water saturation profiles for 0.5 A cm−2 to 2 A cm−2 are presented as a function of the distance to the anodic catalyst layer in Fig. 2a.
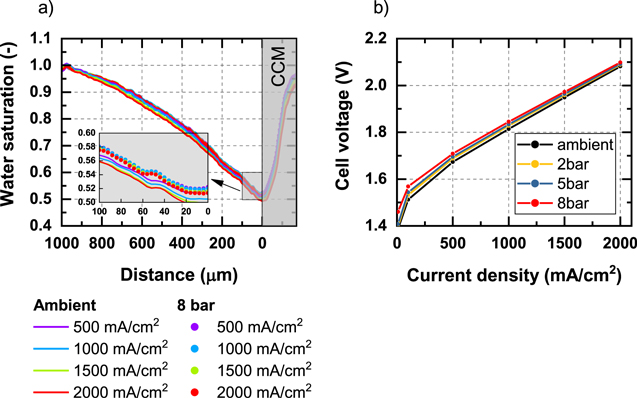
Figure 2. (a) Water saturation profiles across the anode PTL thickness for various current densities and operating pressures. (b) Polarization curves of electrolyzer cell under different balanced operating pressures.
Download figure:
Standard image High-resolution imageFigure 2a shows consistent trends for variation in pressure and current density. From these results, one can see how the water and gas distribution in the PTL is independent from operating pressure. This is also in accordance with recent studies by Schuler et al.19,37 highlighting that the interface between the PTL and the catalyst layer plays a major role in mass transport overpotential origins, rather than the bulk of the PTL. Furthermore the phenomena of consistently established gas pathways, independent of pressure and current density. This indicates that the two-phase flow within the porous network is purely capillary driven and the saturation profiles are governed by the microstructural properties of the PTLs (e.g. pore and particle size distribution, and wettability properties of the material).
The average water saturation at the interface between the PTL and CL is circa 50% for all shown cases. Possibly the gas is evolved underneath the titanium particle either at the surface of the catalyst layer or deeper inside the ionomer. Depending on the water diffusion within the membrane, the water saturation of 50% might be enough to ensure stable and efficient operating conditions. On the other hand, it is possible that the active sites of the catalyst layer are changing dynamically due to local dry outs within the ionomer which would not be observed by the HFR measurement. Further investigations on the interface between the CL and PTL is necessary to draw conclusions on this matter.
Flow regime identification
For all investigated conditions, the average gas saturation stayed unchanged regardless of the gas flow rate and gas velocity in the pore network, which are proportional to the current density. In order to validate the flow regime in the PTLs during PEWE operation the characteristic fluid transport parameters (capillary number and viscosity ratio) have been calculated and presented on Fig. 3b. The cell was operated at a temperature of 50 °C for which the viscosity ratio was calculated according to Eq. 5.

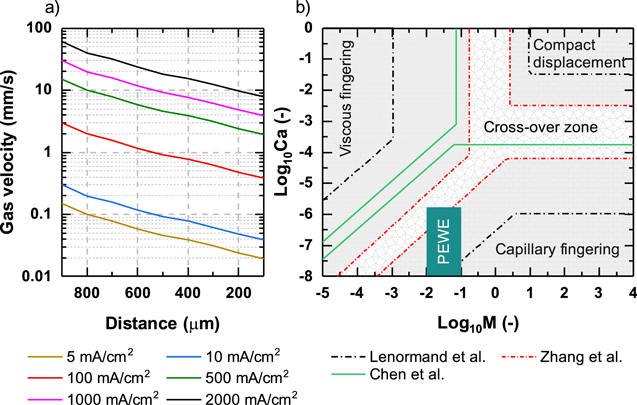
Figure 3. (a) Average gas velocities in the anodic PTL for given distances away from the CCM, (b) operation range of the PEWE in the current study on the regime graph.
Download figure:
Standard image High-resolution imageIn Fig. 3a, gas velocities are plotted for constant current densities up to 2 A cm−2 as function of distance to the anodic catalyst layer/PTL interface. The maximum local velocity of 60 mm s−1 for 2 A cm−2 has been calculated for the distance of 900 μm away from the CCM as interfacial processes and imaging resolution constraints will affect values laying closer to the flow field.
As mentioned in the experimental section, flow regimes can be characterised by the capillary number and the viscosity ratio of two fluids. Three different flow regimes: viscous fingering, capillary fingering and compact displacement are identified in literature according to Lenormand et al.,38 Zhang et al.,39 and Chen et al.40 and summarized in Fig. 3b. The range of capillary numbers and viscosity ratios for the present study are included in the flow regime graph and highlighted in green (Fig. 3b).
In Fig. 3b it can be seen that for the current study the gas transport in the anodic PTL occurs by capillary fingering. This is in agreement with the observations of constant, pressure independent saturation curves in the last section. The identification of the flow regime reveals new unaddressed questions. Considering that the gas transport in the PTL is purely capillary driven, the gas percolation will be governed by pore geometry and distribution alone, which can be considered a statistical problem stemming from the sintering process. With increasing distance away from CCM, the probability of merging the gas pathways increases since pores are connected in in-plane direction too, potentially explaining a linear slope of the saturation across the CCM.
Gas pathway establishment and saturation dynamics
By employing the fast imaging setup we were able to gain insight into transient process of the gas invasion into the PTL. Data points for the kinetic governed and mass transport driven regions were obtained. Figure 4 presents the water saturation profiles in sub-plot a) and an average water saturation of the PTL over time for current densities of 5 mA cm−2, 50 mA cm−2 and 2000 mA cm−2 in sub-plot b).
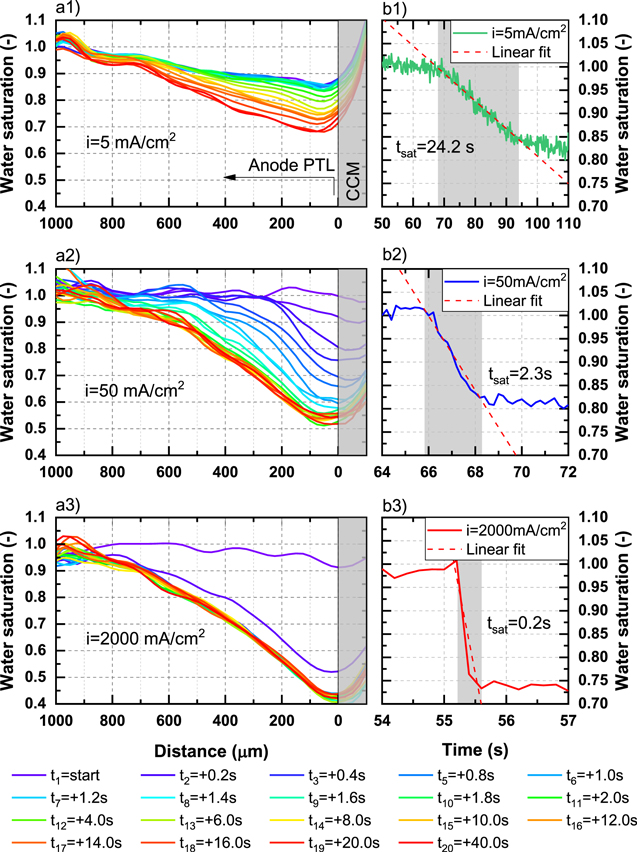
Figure 4. Water saturation establishment dynamics for various current densities, (a) profiles across the thickness of the PTL, (b) globally averaged water saturation over time.
Download figure:
Standard image High-resolution imageLinear fits were used for the average PTL saturation curves over time to quantify gas saturation kinetics. At 2000 mA cm−2 filling was too fast to be captured by more than two measurement points since temporal resolution was 200 ms. Linear behaviour suggests that the gas is uniformly filling the PTL over the entire area.
For the case of 5 mA cm−2, the water saturation was significantly lower than for the others as the current density of such a low magnitude proved to be challenging to measure and handle by our setup. We believe that some of the areas of the CCM were not activated, therefore the surface producing the gas would be reduced as well, which would lead to less established pathways and ultimately to the different distribution. These are, however parameters which are unlikely to be used during normal PEWE operation.
The re-invasion of water in the gas-filled pore networks was also monitored. The cell was operated at constant the current density in the steady-state conditions before a hard stop was simulated. The re-imbibition of water is significantly slower than expected from a highly hydrophilic material. Figure 5a shows a local propagation of the anodic water saturation profiles over time after operation was stopped ranging from 50 s to 550 s. The average PTL water saturation over time is reported in Fig. 5b. The reinvasion happens at relatively fast pace until 250 s from the shutdown after which it propagates at much slower rate suggesting that mechanism governing the invasion has changed. We believe that upon shutdown some pathways get disconnected from the main roots and oxygen gas can be trapped in pore voids slowly diffusing into water what explains elongated imbibition times. What also has to be mentioned is that the saturation levels of over 100% seen on Figs. 4 and 5 are resulting from various noise sources (e.g. camera, background) and imaging constraints.
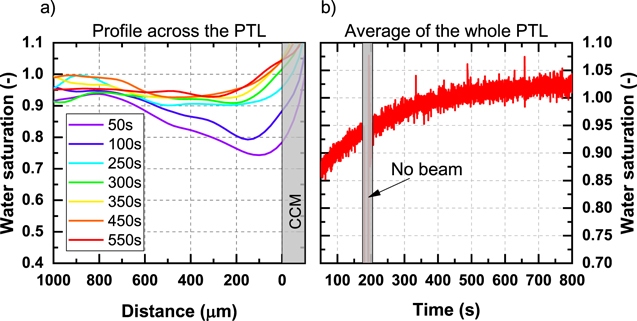
Figure 5. (a) Water saturation of the anodic PTL over time after PEWE shutdown, (b) evolution of the globally averaged water saturation with time.
Download figure:
Standard image High-resolution imageFinally, the results indicate that the filling of the void volume with water is a rather slow process (order of couple of minutes) in contrast to the establishment of gas pathways (order of seconds) even when hydrophilic materials are used. This is of particular importance for conduction of the PTL bulk analysis by neutron studies assuming fully saturated PTL pore structure. Between each measurement point, the waiting time needs to be set to at least 10 min to ensure that the PTL has been fully saturated with water again. Such behaviour suggests that sintered titanium PTLs are not fully hydrophilic inside the pore network and that there is a possibility of gas entrapment resulting in dead ended pathways.
Impact of material microstructure and wettability properties
There are two interactive effects, which actively affect the water and gas behaviour within the pore network of electrolyzer PTLs. The one is related to the general morphology of the material and the other to the material properties and pore-throat geometries. Starting with morphology the pore size distribution (PSD) of the GKN T10 PTL has been measured and the results are shown in Fig. 6a together with MIP simulations. Interpretation of the figure is as follows: pore frequency (right hand side axis) shows how many pores of the given size have been determined by both methods. The cumulative pore volume on the left-hand side provides insights into the accessibility of the pore volume as function of simulated pore/sphere diameter. The spheres of size smaller than 10 μm can access almost 100% of the pore volume. Increase of the size of the introduced sphere leads to significant change between available pore volume and effectively invaded pores. This means that there are areas where small throats will block the access to downstream pore volume and thus trapping the gas.

Figure 6. (a) Pore size distribution obtained by X-ray tomography and mercury intrusion porosimetry simulation based on obtained morphology. (b) Capillary pressures as a function of constriction size for pore sizes typical to GKN T10 sintered PTLs.
Download figure:
Standard image High-resolution image
Another effect stems from pore to pore connection geometries. The assumption of ideal cylindrical pore geometries does not hold up for the complex morphology of porous sinter materials. To account for the capillary pressure hysteresis induced by geometric constrictions during the water invasion, the calculations have been made according to the model proposed by Forner et al.41 for a wide range of contact angles and pore sizes (Fig. 6b). Literature states that depending on the surface condition, the contact angle of water on titanium can vary from 40° to 80°32,42 suggesting that a wide range of conditions may be expected within the pore network. To compute the capillary pressure curve, an average pore diameter as well as throat diameters are essential. Considering the average pore size of 36 μm, capillary pressure curves are computed for different contact angles in a range from 40° to 70° and different throat sizes up to 50 μm. Assuming that the material is highly hydrophilic (θ = 40°) and the average throat diameter is below ∼33 μm the calculation returns a positive capillary pressure. This means that there are areas in the PTL that do not wet spontaneously and imbibition happens only after reaching certain pressure. As expected, an increase in contact angle leads to a shift towards higher capillary pressures and to the increase in required throat sizes to achieve spontaneous imbibition. The MIP analysis indicated that a certain amount of pressure needs to be applied to saturate the PTL even for highly hydrophilic surfaces.
The results, therefore suggest that the water will not fill the PTL immediately after the gas production stops as the representative throat sizes for T10 are in the range from 25 to 30 μm. There will be certain pathways, which will be filled with water first, and there will be some amount of volumes with gas trapped inside, which will not contribute to two-phase flow. The pores will eventually be filled with water by either diffusion, condensation of vapour or dissolution of the gas in the water. These processes however will take significantly more time to fill the network. Simple calculations presented in supplementary information S2 estimate that the time constants for removing oxygen by permeation either through the membrane or through a blocking water layer are in the order of a few minutes, which can explain the long imbibition times observed for the PTLs shown in previous paragraph.
Conclusions
The two-phase flow within PTLs under steady-state and dynamic load of the electrolyzer have been investigated. The impact of wide range of current densities and pressures have been explored to investigate mass transport losses using high spatial resolution neutron imaging (6 μm pixel size, 20 s and 1 s exposure times). Furthermore, the two-phase flow upon start/stop operation was investigated using high temporal resolution imaging (36 μm voxel size and 20 ms exposure time). The main findings are summarized below:
- The current density does not affect the average water and gas distribution between 10 and 2000 mA.
- The pressure does not affect the saturation profile inside the anodic PTL between 1 bar and 8 bar.
- Therefore, the increase of the mass transport losses with increasing current densities and operating pressures was found to be unrelated to the two-phase flow in the bulk of the PTL. The origin of the increase most possibly lies in the interface between the PTL and CCM.
- Upon shutdown of a PEWE, the anode side PTL does not spontaneously imbibe fully with water. There are hydrophobic regions within PTL, which slow down re-saturation.
- Due to the hydrophobic character of certain areas in the PTL, the gas entrapment within the pore network is possible.
- The velocity of the gas in the PTL increases proportionally to the volumetric gas flux and exponentially with distance away from the CCM, as occupied pore space decreases.
- Viscous forces are negligible in the two-phase flow in the PTLs of PEWE. However, the flow character at the interface between the CCM and PTL is still an open question.
It has been shown that the two-phase flow in PTLs is purely capillary driven for a wide range of operating conditions. Pressure and current density show no significant impact on the water and gas distribution inside the porous media. The pore network of sintered titanium PTLs has a complex morphology, which contains hydrophilic and hydrophobic regions that prevent spontaneous imbibition of the whole pore network with water and promotes certain flow pathways leading to local gas entrapments after the device shutdown.
Acknowledgments
We would like to express our gratitude to Swiss Federal Office of Energy for financial support (project 8100066). We kindly acknowledge Paul Scherrer Institute (PSI) Neutron Imaging and Activation group for beamline operation and image processing guidelines. Finally, we would like to thank Adrian Mularczyk and Dr. Jongmin Lee for their valuable input to this work.