
Abstract
Cyclic voltammetry was applied to investigate the permselective properties of electrode-supported ion-exchange polymer films intended for use in future molecular-scale spectroscopic studies of bipolar membranes. The ability of thin ionomer film assemblies to exclude mobile ions charged similarly to the polymer (co-ions) and accumulate ions charged opposite to the polymer (counterions) was scrutinized through use of the diffusible redox probe molecules [Ru(NH3)6]3+ and [IrCl6]2−. With the anion exchange membrane (AEM) phase supported on a carbon disk electrode, bipolar junctions formed by addition of a cation exchange membrane (CEM) overlayer demonstrated high selectivity toward redox ion extraction and exclusion. For junctions formed using a Fumion® AEM phase and a Nafion® overlayer, [IrCl6]2− ions exchanged into Fumion® prior to Nafion® overcoating remained entrapped and the Fumion® excluded [Ru(NH3)6]3+ ions for durability testing periods of more than 20 h under conditions of interest for eventual in situ spectral measurements. Experiments with the Sustainion® anion exchange ionomer uncovered evidence for [IrCl6]2− ion coordination to pendant imidazolium groups on the polymer. A cyclic voltammetric method for estimation of the effective diffusion coefficient and equilibrium extraction constant for redox active probe ions within inert, uniform density electrode-supported thin films was applied to examine charge transport mechanisms.
Export citation and abstract BibTeX RIS
Polymeric materials composed of layered anion-exchange membrane (AEM) and cation-exchange membrane (CEM) phases, or so-called bipolar membranes, have been developing in recent years for applications in electrochemistry. 1–6 The membranes enable electrochemical devices (i.e., cells for desalination, chemical synthesis and energy conversion and storage) to operate with the anode and cathode near the pH optimum of the reactions of interest, providing a route to improved energy efficiency and substantial cost reductions. 2,4,5,7–10 In these applications, a bipolar membrane is often configured for operation under reverse bias (e.g., with the AEM toward the anode and the CEM toward the cathode), resulting in enhanced formation of protons and hydroxide ions at the AEM-CEM interface when the transmembrane potential reaches above the thermodynamic limit for water dissociation (ca. 830 mV). 4–6,8,11 The released protons transport through the CEM phase toward the cathode, while hydroxide ions transport through the AEM phase toward the anode, replenishing the H3O+ and OH− consumed during electrolytic transformations.
As bipolar membranes have progressed, studies that model the spatial distribution of ions and electric fields within the AEM-CEM boundary region have helped to identify factors that limit energy efficiency and guide strategies for improving device performance. 4,9,11,12 Simulations have shown gradients in the mobile ion composition across the AEM-CEM interface can vary from a few nanometers at transmembrane potentials near the onset of the ion-depleted, water enriched interfacial region to several hundred micrometers during operation at high bias voltages. 4,9,11,12 As a step toward experimental verification of these predictions, confocal Raman microscopy was recently applied to profile composition variation within a bipolar membrane. 13 The spatial resolution achieved, just below 2 μm, was sufficient to discern roughness at the AEM-CEM boundary on the order expected for the commercial membrane examined. To attain the nanoscale spatial resolution necessary to detect the early stages of interfacial charge separation, our group has been exploring the capabilities of neutron reflectometry (NR). 14 In depth profiling materials under ambient, and even in situ electrochemical conditions, NR has demonstrated spatial resolution down to 1 nm and below. 14–17 However, NR measurements require a high degree of sample in-plane uniformity (< 2% variation across the film) and are limited in scanning depth to < 500 nm. 14 Thus, model systems that meet these criteria are typically constructed to facilitate NR studies of layered polymers and buried polymer interfaces.
The work reported herein explores issues of stability and ion-transport selectivity in thin electrode-supported films prepared from ion-exchange polymers of interest for use in the construction of model bipolar membranes. The platforms examined will enable strategies for in situ confocal Raman microscopy 13,18 and NR studies to be advanced as progress is made toward measurements on membranes under well-defined bias potentials. 4,5 Cyclic voltammetry is applied to detect [Ru(NH3)6]3+ and [IrCl6]2− serving as the mobile charge compensating ions for the CEM and AEM phases, respectively. The voltammetric signals for each ion provide insights into the stability and ion-exclusion properties of the electrode-supported films. Results are analyzed in terms of the diagnostics for cyclic voltammetric characterization of reversible redox probes within electrochemically inert, uniform density ionically conductive films on electrodes. 19
Experimental
Reagents
Hexaammineruthenium(Ⅲ) chloride ([Ru(NH3)6]Cl3), potassium hexachloroiridate(Ⅳ) (K2IrCl6) and Nafion perfluorinated ionomer (20 wt. % in lower aliphatic alcohols) 20,21 were obtained from Sigma-Aldrich (Saint Louis, MO, USA) in highest purity and used as received. The ionomers Fumion (FAA-3-SOLUT-10, Fuel Cell Store, College Station, TX, USA) and Sustainion (XA-9, 5 wt% in ethanol, Dioxide Materials, Boca Raton, FL, USA) 22 were used as received. All other chemicals were reagent grade or better and used as received. Aqueous solutions were prepared from 18 MΩ-cm water delivered from a Barnstead Nanopure water purification system.
Working electrode preparation
Prior to use, carbon disk electrodes (3 mm diameter, CH Instruments, Austin, TX USA) were polished in a slurry of Al2O3 polishing powder (3.0 μm, Buehler, Bluff, IL) followed by thorough rinsing in deionized water aided by brief sonication in an ultrasonic bath. Modifying ionomer layers were prepared by casting from dilute dispersions. Nafion films approximately 150 nm thick were cast from 1.0 wt % dispersions prepared by dilution of the 20 wt % Nafion dispersion in ethanol. 23 A 7 μl aliquot was spread across the electrode surface and dried at ambient temperature for 5 h. Fumion was cast from a dispersion (7.2 wt%) in N-methyl-2-pyrrolidone (NMP). After spreading a 7 μl droplet of the dispersion across the carbon surface, the electrode was placed into a vacuum oven where the electrode was kept at 60 ℃ under reduced pressure (ca. 500 Pa) for 24 h to remove the NMP solvent. Films of Sustainion were prepared similarly by casting 10 μl of the 5 wt% dispersion and allowing the sample to dry under ambient conditions for at least 5 h. To ensure full hydration and ion-exchange, each ionomer-modified electrode was placed in the electrolyte containing the redox probe of interest for 12–24 h prior to measurements.
A bilayer on a carbon disk electrode was constructed by sequential casting of Fumion followed by Nafion. The NMP dispersal solvent required Fumion be cast directly onto the carbon surface, since deposition onto Nafion would cause partial dissolution of the Nafion film. Following Fumion deposition according to the procedure described above, the electrode was immersed for 24 h in 1.0 M KCl electrolyte containing 1.0 mM [IrCl6]2− to exchange the redox active iridium probe ions into the Fumion layer. Subsequently, Nafion was cast onto the Fumion-modified carbon electrode and the assembly was dried under ambient conditions for 5 h. Afterward, the bilayer-modified electrode was immersed in 1.0 M KCl electrolyte containing 1.0 mM [Ru(NH3)6]3+ to ensure exchange of the redox active ruthenium probe into the Nafion layer.
Bilayer durability was tested by cycling the electrode-supported film for a 20-h time period at 10 mV s−1 over the potential range between –0.2 V to 1.0 V to simulate extremes in the anticipated data acquisition time and applied potential needed for in situ spectral measurements. Ionomer layer thicknesses were estimated from scanning electron microscopy (SEM) cross sections (S-4300 Field Emission SEM, Hitachi) of films prepared by casting a known ionomer mass per surface area on silicon wafers. 23 Prior to film deposition wafer surfaces were cleaned by immersion in a 1:1:2 mixture by volume of concentrated sulfuric (J.T. Baker, VWR, Missouri, TX, USA) and nitric (Mallinckrodt (VWR)) acids and deionized water for 1 h at 60 °C followed by thorough rinsing in deionized water and drying under a stream of nitrogen gas.
Cyclic voltammetry
Cyclic voltammograms were recorded using a potentiostat (PC4/300, Gamry Instruments, Warminster, PA) and a three-electrode cell containing a Pt wire counter electrode and a KCl saturated silver/silver-chloride reference electrode (CH Instruments). The reference electrode was secured inside a chamber filled with the electrolyte used in the experiment (1.0 M KCl or 0.1 M KCl). The chamber was held behind a wetted stopcock and connected through a Luggin capillary to the cell compartment holding the working and counter electrodes. Prior to measurements, the electrolyte was degassed by bubbling Ar through the solution for 10 min. Electrochemical measurements were performed at the ambient laboratory temperature (21 ± 1 °C).
Results and Discussion
Voltammetry of redox probe ions in a single electrode-supported polymer phase
Cyclic voltammograms of [Ru(NH3)6]3+ and [IrCl6]2− redox probes at bare and ionomer-modified carbon electrodes are shown in Fig. 1. The ionomer film thicknesses targeted, approximately 150 nm for Nafion and 6 μm for Fumion, were of interest for bilayer preparation as discussed below.. The responses recorded at the bare carbon electrode are included for reference in Fig. 1 and are in good agreement with previous reports for the ions in aqueous electrolytes. 24 The formal potentials, −0.21 V for [Ru(NH3)6]3+ and 0.71 V for [IrCl6]2−, and current densities measured are consistent with the anticipated reversible transformations of the ions. The middle set of cyclic voltammograms in Fig. 1 shows responses for the probe ions in the presence of a thin Nafion surface modifying layer on the electrode. The Nafion ionomer contains a fixed negative charge imparted by pendant sulfonate groups on the side chains. 20,21 As expected, the Nafion modified electrode shows good permeability to [Ru(NH3)6]3+, as indicated by the strong voltammetric response characteristic of the ions, while excluding [IrCl6]2−. In electrolyte containing [IrCl6]2−, only background charging current is evident across the range of potentials associated with redox waves for the iridium probe. The top set of cyclic voltammograms in Fig. 1 shows responses for the probe ions at a Fumion-modified electrode. As an anion exchange polymer with fixed cationic sites, the Fumion-modified electrode is expected to show behavior opposite to that of the Nafion film coated electrode. The top voltammograms in Fig. 1 support this prediction. Only charging current is observed in the presence of [Ru(NH3)6]3+, but strong redox waves appear in electrolyte containing [IrCl6]2−.
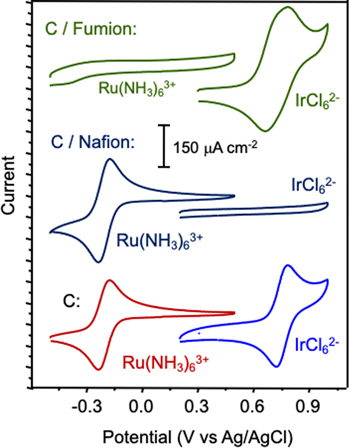
Figure 1. Cyclic voltammograms of C (bottom), C/Nafion (middle) and C/Fumion (top) electrodes in 1.0 M KCl containing 1.0 mM [Ru(NH3)6]3+ or 1.0 mM [IrCl6]2−, as indicated. Film thicknesses for Nafion and Fumion were approximately 150 nm and 6 μm, respectively. The potential scan rate was 100 mV s−1.
Download figure:
Standard image High-resolution imageVoltammetry of redox probe ions in a bilayer electrode-supported membrane phase
After establishing responses for [Ru(NH3)6]3+ and [IrCl6]2− ions at carbon electrodes supporting an individual ionomer phase (Nafion or Fumion), the probes were applied to investigate properties of bipolar thin films prepared by sequential coating of Nafion and Fumion layers on a carbon electrode. For a bilayer composed of Nafion overlaid onto a Fumion-modified carbon electrode (Scheme
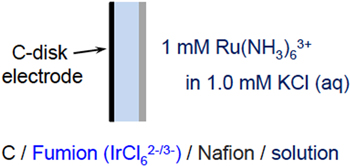
Scheme 1. Cross section of the polymer bilayer modified carbon-disk electrode in contact with aqueous 1.0 M KCl containing 1.0 mM [Ru(NH3)6]3+. The AEM (Fumion) layer was exchanged with [IrCl6]2− ions prior to capping with a thin CEM (Nafion) layer.
Download figure:
Standard image High-resolution image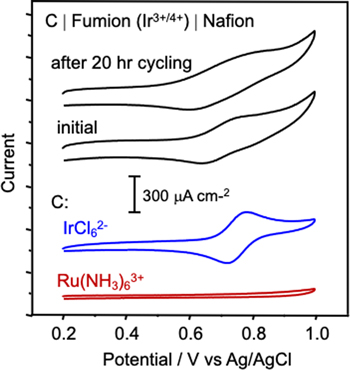
Figure 2. (Top, black) Cyclic voltammograms of bilayer thin film modified C (see Scheme
Download figure:
Standard image High-resolution image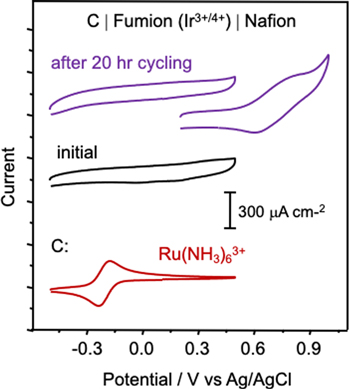
Figure 3. Same as Fig. 2, with the potential scan range extended to include [Ru(NH3)6]3+ waves. The CV responses for the bilayer electrode after 20 h of cycling are shown in purple.
Download figure:
Standard image High-resolution imageFocusing on the range of [IrCl6]2− redox activity (0.2 V to 1.0 V), the top two voltammograms in Fig. 2 demonstrate the ability of the electrode-supported bilayer to retain [IrCl6]2−/3− ions during the initial recording and throughout a 20-h period of durability cycling. The responses reflect transport of [IrCl6]2− and [IrCl6]3− within the Fumion phase near the boundary with the carbon electrode. The shape of the voltammograms is consistent with diffusion-limited transport of redox active probe ions within an electode-supported ionomer film. 19,23 The stability demonstrated in the entrapment of [IrCl6]2−/3− ions in Fig. 2 derives from the ion exclusion properties of the capping Nafion film. The ability of Nafion to prevent [IrCl6]2−/3− ions from diffusing from Fumion into solution is as anticipated, given the high permselectivity of ≥ 10 nm thickness electrode-supported Nafion films toward redox active probe ions. 23 The lower two voltammograms in Fig. 2 for [IrCl6]2− and [Ru(NH3)6]3+ ions at the bare carbon electrode confirm the potential region highlighted in Fig. 2 encompasses the range of redox chemistry for the [IrCl6]2−/3− probe.
Figure 3 expands the potential range into the region for [Ru(NH3)6]3+ redox activity. Voltammograms for [Ru(NH3)6]3+ at the bare carbon electrode and [IrCl6]2−/3− ions in the bilayer-modified electrode are included for reference. Over the −0.5 V to 0.5 V range, voltammograms for the electrode-supported bilayer show only charging current. The absence of redox waves for the [Ru(NH3)6]3+/2+ couple confirms the ability of the Fumion phase to exclude [Ru(NH3)6]3+ and [Ru(NH3)6]2+ cations, even after 20 h of durability cycling. The results in Figs. 2 and 3 demonstrate the model electrode-supported bipolar membrane prepared by casting thin films of ion-exchange polymers displays expected ion-exclusion and ion-exchange behavior toward redox active probe ions and motivate next steps that aim to reduce the inner layer thickness to the nanometer scale.
Important to consider, however, is the possibility for redistribution of electrolyte ions (K+ and Cl−) across the AEM/CEM interface in response to the reduction and oxidation of the redox probe molecules. 25 In the transformation of [IrCl6]2− to [IrCl6]3−, the added negative charge within the Fumion phase can potentially be compensated by loss of any Cl− present or gain of any K+ present within Nafion. Given the high permselectivity of the two phases, however, the likelihood for transport of Cl− ions into Nafion or K+ into Fumion is small. 25 Alternatively, the excess charge (relative to the ionomer fixed charge) imparted through electron transfer to iridium centers can accumulate at the AEM/CEM boundary. 12 Movement of excess [IrCl6]2− within Fumion to the interface with Nafion can be compensated by transport of K+ from solution into Nafion with subsequent migration of the excess positive charge to the AEM boundary. Resistance to this mobile ion redistribution may be an important factor contributing to the apparent quasi-reversible nature of the redox peaks for the Fumion-entrapped [IrCl6]2−/3− ions in Figs. 2 and 3 compared to the more reversible response for the ions within the Fumion monolayer in Fig. 1. The voltammetric responses also are expected to be affected by electrical double layer development at the AEM/CEM boundary and the accompanying changes in junction potential. 12,25
Voltammetry of redox probe ions in an electrode-supported Sustainion thin film
Recent practical interest in the Sustainion anion-exchange polymer for use in bipolar membrane construction 1 and its availability for dispersion casting from alcohol solvents led us to investigate the possibility of examining Sustainion as a substitute for the Fumion anion-exchange material. Sustainion ionomers are copolymers of vinylbenzene and imidazolium functionalized styrene. 22 The chemically bonded imidazolium group forms a quaternary ammonium center that imparts a fixed positive change to the polymer. A series of scan rate dependent cyclic voltammograms that show the response for the [IrCl6]2− probe following exchange into a Sustainion film cast from the dispersion onto a carbon disk electrode are displayed in Fig. 4. Evident is a difference in formal potential for the solution-free and polymer-entrapped probe (ΔE). Although it is possible the shift reflects the presence of a Donnan potential at the Sustanion-solution interface, 25 the low inner-film redox ion content (see below) and relatively high bulk solution electrolyte concentration are expected to minimize effects of electrolyte imbalance across the ionomer-solution interface. The direction and magnitude of the shift indicate conditions favorable for complex formation between [IrCl6]2− ions and pendant imidazolium groups on the ionomer. The interaction likely involves one or more imidazolium groups, accompanied by displacement of chloride ions from iridium, as similar types of complexes between iridium and imidazole ligands have been reported. 26,27 The shift of the formal potential negative upon complexation by an amount ΔE = 0.12 V suggests a weekly coordinating iridium-polymer interaction with formation constant on the order of 102. Also notable in the Fig. 4 (bottom) voltammograms is a minor wave near 0.7 V that likely reflects a population of free [IrCl6]2− ions within the electrode-supported Sustainion film. Thus, not all the [IrCl6]2− ions undergo complexation within the film.
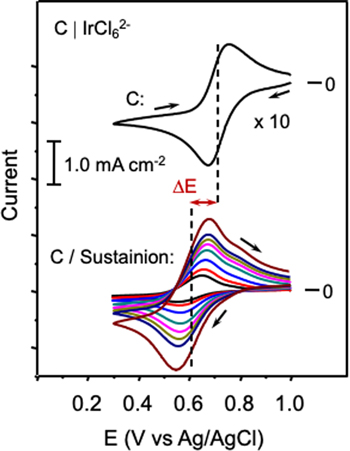
Figure 4. Cyclic voltammograms of 1.0 mM IrCl6 2− in 0.1 M KCl at the C (top) and the C/Sustainion (bottom) electrode. ΔE indicates the formal potential shift that results from [IrCl6]2− complexation to imidazolium sidechain end groups on the Sustainion ionomer. From the inner to the outer CV profile, the scan rates for the C/Sustainion electrode were as follows: 5 mV s−1, 10 mV s−1, 20 mV s−1, 40 mVs−1, 60 mV s−1, 80 mV s−1, 100 mV s−1 and 200 mV s−1. The CV for the bare C electrode was recorded at 60 mV s−1.
Download figure:
Standard image High-resolution imageThe scan rate dependent cyclic voltammograms for iridium species within Sustainion reported in Fig. 4 provide insights into film properties that limit charge transport. For redox active probe ions extracted into inert, uniform electrode-supported thin films, Leddy and co-workers identified experimental conditions that enable the diffusion coefficient for the entrapped ions (D
f
) and the equilibrium constant governing the extraction of ions into the film from bulk solution (κ) to be derived from cyclic voltammetry measurements.
19
The approach applies particularly across the range of potential scan rates that extend the redox probe diffusion layer (δ) a distance comparable to the film thickness ( ). Under these conditions, cyclic voltammograms of a redox probe undergoing a reversible, one-electron transfer reaction at the electrode surface have the familiar shape characteristic of responses under the control of linear diffusion.
19,28
The voltammograms in Fig. 4 for an iridium redox probe within a Sustainion film display this so-called avian
19
morphology across the full range of scan rates studied.
). Under these conditions, cyclic voltammograms of a redox probe undergoing a reversible, one-electron transfer reaction at the electrode surface have the familiar shape characteristic of responses under the control of linear diffusion.
19,28
The voltammograms in Fig. 4 for an iridium redox probe within a Sustainion film display this so-called avian
19
morphology across the full range of scan rates studied.
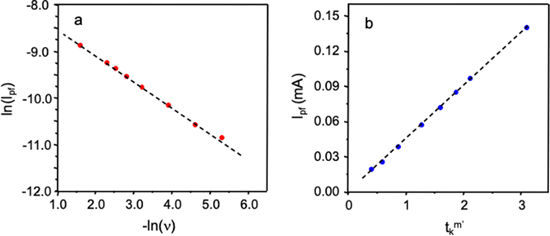
As a first step in applying the analysis strategy, a log-log plot was constructed to examine the dependence of peak current in the forward scans (i
pf
) on the potential scan rate (ν). Figure 5a shows the plot is linear for the voltammograms in Fig. 4 across the range of scan rates studied. Leddy and co-workers showed the slope of the plot (m') enables determination of the dimensionless parameter group  where Ds is the diffusion coefficient for the redox probe in the bulk electrolyte solution.
19
From the relationship, it is possible to derive κ from estimates of D
s
and D
f
. Therefore, as a second step in the analysis the scan rate dependence of i
pf
in the Fig. 4 dataset was scrutinized to estimate D
f
for IrCl6
2− in the electrode-supported Sustainion film. As discussed by Leddy and co-workers, plotting i
pf
versus ν-m
' should be linear with a slope dependent upon D
f
, D
s
and
where Ds is the diffusion coefficient for the redox probe in the bulk electrolyte solution.
19
From the relationship, it is possible to derive κ from estimates of D
s
and D
f
. Therefore, as a second step in the analysis the scan rate dependence of i
pf
in the Fig. 4 dataset was scrutinized to estimate D
f
for IrCl6
2− in the electrode-supported Sustainion film. As discussed by Leddy and co-workers, plotting i
pf
versus ν-m
' should be linear with a slope dependent upon D
f
, D
s
and  19
In their approach, scan rate was expressed in terms of a temporal parameter,
19
In their approach, scan rate was expressed in terms of a temporal parameter,  where for the cyclic voltammetry measurement
  and R, T, n and F refer to the universal gas constant, temperature, equivalents per mole of reactant and the Faraday constant, respectively. Note, in the present work m' ≈ −0.5, which gives the dependence of i
pf
on ν1/2 anticipated for a diffusional process.
28
and R, T, n and F refer to the universal gas constant, temperature, equivalents per mole of reactant and the Faraday constant, respectively. Note, in the present work m' ≈ −0.5, which gives the dependence of i
pf
on ν1/2 anticipated for a diffusional process.
28
Figure 5. Data derived from the Fig. 4 cyclic voltammograms of the C/Sustainion electrode. (a) Plot of ln ipf versus −ln ν. Regression yields ln ipf = 0.55 ln v – 7.99 and R 2 = 0.998. (b) Plot of ipf versus tk m '. Regression yields ipf = 0.046 [tk m '] – 4.0 × 10⁻⁴ and R 2 = 0.999.
Download figure:
Standard image High-resolution image
Figure 5b shows the i
pf
versus  relationship derived from the dataset in Fig. 4. The plot is linear with slope 0.046 mA s−1 and y-intercept close to zero. From the mass of ionomer deposited and electrode area, the Sustainion film thickness was estimated to be
  ≈ 2.2 μm. To complete the analysis, D
s
was determined in separate experiments from cyclic voltammograms of 1 mM [IrCl6]2− in 0.1 M KCl recorded as a function of scan rate (Fig. S1 (available online at stacks.iop.org/JES/169/026520/mmedia)). The plot of i
pf
versus ν1/2 (Fig. S2) was linear with a slope that enabled determination of D
s
= 4.5
≈ 2.2 μm. To complete the analysis, D
s
was determined in separate experiments from cyclic voltammograms of 1 mM [IrCl6]2− in 0.1 M KCl recorded as a function of scan rate (Fig. S1 (available online at stacks.iop.org/JES/169/026520/mmedia)). The plot of i
pf
versus ν1/2 (Fig. S2) was linear with a slope that enabled determination of D
s
= 4.5  10−6 cm2 s−1, close to previously reported values.
24
With approximate values for D
s
and
10−6 cm2 s−1, close to previously reported values.
24
With approximate values for D
s
and  Df
= 5.6
Df
= 5.6  10−8 cm2/s was calculated from the slope of the i
pf
versus
10−8 cm2/s was calculated from the slope of the i
pf
versus  plot in Fig. 5b. Finally, κ
  10.2 was estimated from Ds
and Df
.
10.2 was estimated from Ds
and Df
.
The Df
derived from the Fig. 4 dataset is close to values measured for [IrCl6]2−/3− species exchanged into electrode-supported anion exchange polymers with inner film redox ion concentrations below 0.1 M.
29,30
The κ derived predicts the iridium probe concentration within Sustainion is about 13 mM, well below this 0.1 M limit. To gain further insights into film properties from Df
and κ, possible effects of electron transfer need to be considered. Df
can be described as a composite mass transport coefficient with contributions arising from physical diffusional motion of redox active probe molecules within the membrane matrix as well as electron exchange between nearby redox centers (so called Dahms-Ruff diffusion).
30–33
In the case of Sustainion, the possibility for [IrCl6]2− coordination to imidazolium sites on the ionomer sidechains may enable an electron transfer (electron hopping)
30,34–36
contribution to Df
through self-exchange. The strong shift in the formal potential (ΔE, Fig. 4) for the polymer-entrapped versus the solution-free probe suggests translational displacements of [IrCl6]2− ions within the polymer matrix can be hindered by coordinative interactions with functional groups on the polymer sidechains. Thus, electron transfer (i.e., electron diffusion or hopping)
30,34–36
between coordinated iridium centers may be assisted by facile polymer chain segmental motions that facilitate charge transport within the electrode-supported, [IrCl6]2−-exchanged Sustainion films employed in the experiments reported in Fig. 4. In studies of osmium bipyridine coordinated to pendent pyridine groups within hydrated, cross-linked redox hydrogel films, Heller and co-workers observed transport coefficients attributed to electron diffusion that approach (1.6  10−8 cm2 s−1),
35
and even exceed (7.6
10−8 cm2 s−1),
35
and even exceed (7.6  10−7 cm2 s−1),
36
the value (5.8
10−7 cm2 s−1),
36
the value (5.8  10−8 cm2 s−1) for iridium complexes determined from the Fig. 5 analysis method.
It is worthwhile to compare the Df and κ measured for [IrCl6]2−/3− in Sustainion to corresponding physical parameters reported for transition metal centered diffusible redox probe molecules within the well-studied ionomer matrix Nafion. 19,31,32,37 The analysis approach detailed in Fig. 5 predicted similar values for ruthenium bipyridine complexes within proton-exchanged Nafion when the inner film probe concentration was low (∼0.05 M). 19 However, Df can become considerably larger as the inner film concentration of transition metal bipyridine complexes in Nafion reaches saturation. 37 The opposite trend in Df was observed for [IrCl6]2−/3− within electrode-supported anion exchange polymer films, with the variation in Df extending over the range between 10−8 cm2 s−1 and 10−10 cm2 s−1. 29,30 The differences reflect a balance between factors that facilitate electron hopping as the distance between redox centers decreases and electrostatic interactions that inhibit charge transport. 30–32,37
Additionally, transition metal bipyridine complexes have considerable bulk in comparison to the nanoscale, ionically conductive channels present in well hydrated Nafion membranes. As a consequence, co-transport of small electrolyte cations is necessary to achieve full charge compensation once the redox probe ions attain maximum density within the membrane. 32 Movement of electrolyte ions in response to polymer redox state changes also can be reflected in Df values. 35,37 For the Sustainion / [IrCl6]2−/3− system, we anticipate the smaller size 26,27,38 and greater hydrophilicity allows for faster transport and a somewhat higher inner film redox ion concentration relative to transition metal bipyridine complexes in Nafion.
Going forward, it will be of interest to explore redox probe transport within Sustainion in films characterized in terms of ion exchange capacity and under a wider range of experimental conditions (i.e., redox probe type, electrolyte nature and concentration) with the aim of shedding light on the nanoscale inner-film structure.
19,32,35,36
Furthermore, the Fig. 5 analysis approach predicts the dimensionless parameter group  a regime in which the current is not strongly sensitive to the experimental condition
  and the Fig. 5a log-log plot can appear linear across a wider range of diffusion layer thicknesses.
19
The planned variations have potential to sample a larger space for the parameter group by providing access to a broader range of Df
and κ values. It may be possible to gain additional insights into limiting charge transport mechanisms through examination of changes in the voltammetric peak shapes and cathodic-anodic peak separation for the redox probe in these measurements.
36
Finally, it would be valuable to adapt microelectrode array platforms that enable Df
determination independent of film thickness and redox site density.
35,36,39,40
and the Fig. 5a log-log plot can appear linear across a wider range of diffusion layer thicknesses.
19
The planned variations have potential to sample a larger space for the parameter group by providing access to a broader range of Df
and κ values. It may be possible to gain additional insights into limiting charge transport mechanisms through examination of changes in the voltammetric peak shapes and cathodic-anodic peak separation for the redox probe in these measurements.
36
Finally, it would be valuable to adapt microelectrode array platforms that enable Df
determination independent of film thickness and redox site density.
35,36,39,40
Conclusions
Bilayer membranes prepared by drop casting anion-exchange and cation-exchange polymers in alternate layers on a glassy carbon disk electrode demonstrate the stability and ion selectivity needed to support in situ characterization of composition within the boundary region between the ion conducting phases. The imidazolium groups on Sustainion ionomers have an ability to coordinate metal cations, a property deserving of further study for its potential to impact membrane ionic conductivity and ion-exchange selectivity in practical applications. In moving ahead, planned experiments will assess the performance of spin casting methods and the stability of bilayer membranes on electrode substrates that include electronically conductive silicon wafers and carbon and indium tin oxide coated optically transparent glasses. Silicon wafer substrates supporting bilayer membranes with < 200 nm phase thicknesses are needed for in situ NR measurements that probe the early stages of ion-depletion and water accumulation at the AEM-CEM interface. Alternatively, optically transparent substrates supporting films composed of thicker AEM and CEM layers, in the 10 μm–25 μm range, will be employed in confocal Raman microscopy experiments that investigate the development of composition gradients extending several micrometers across the phase boundary.
Acknowledgments
We gratefully acknowledge financial support from the U.S. National Science Foundation (NSF) through grant CBET-1922956 and helpful discussions with Dr Joseph Dura at the National Institute of Standards and Technology (NIST) Center for Neutron Research and Dr Bo Zhao in the TTU College of Arts & Sciences Microscopy Imaging Center. The electron microscopy instrumentation utilized was acquired with generous support from NSF grant DBI-0421032.