

Abstract
The redox behavior of terbium and praseodymium doped yttria-stabilized zirconia (YSZ) is studied. The aim is to identify spectroscopic probes and a suitable experimental procedure to monitor the oxygen activity in YSZ electrolytes in solid oxide cells with spatial resolution and at operation conditions (e.g. at high temperatures). Sintered ceramics and crystals with 0.3 to 10 at% content of Pr or Tb ions in YSZ were prepared. Upon equilibration in atmospheres from 10−20 to 100 bar PO2around 800 °C, the majority of these rare earth ions are in the 3 + oxidation state. At oxygen pressures above 0.001 bar, the small proportion of Tb4+ and Pr4+ formed give rise to intense optical absorption around 300–500 nm and to decreased reflectance. From the reflectance measurements it is shown that the Tb4+ concentration increases as PO21/4, as correspond to the trapping of the holes generated upon the oxygen incorporation as Tb4+. This competitive absorption causes a decrease of the Tb3+ luminescence. A quantitative relationship of the Tb3+ luminescence intensity with PO2 at 800 °C has been found, which is compatible with the trapping model. The spatial resolution of the experimental procedure could be very roughly estimated of the order of 100 μm.
Export citation and abstract BibTeX RIS

This is an open access article distributed under the terms of the Creative Commons Attribution Non-Commercial No Derivatives 4.0 License (CC BY-NC-ND, http://creativecommons.org/licenses/by-nc-nd/4.0/), which permits non-commercial reuse, distribution, and reproduction in any medium, provided the original work is not changed in any way and is properly cited. For permission for commercial reuse, please email: permissions@ioppublishing.org.
Yttria stabilized zirconia (YSZ) is the state of the art electrolyte in solid oxide fuel cells and electrolysers as well as an archetypal oxide electrolyte. 1,2 These devices are considered today one of the technologies that will contribute sensibly to reach a carbon-neutral economy in the near future. With respect to their optimization, there are still degradation issues that need to be harnessed. 3,4 One of the degradation processes that leads to the cracking of the electrolyte and/or delamination of the electrolyte—oxygen electrode interface, are known to be the very high oxygen activity and/or large gradients in regions of the electrolyte near to the oxygen electrode. 5,6,7–9 Red-ox dopants in the electrolyte can help to investigate these activity gradients.
Small concentration of red-ox dopants in YSZ (of the order of 100 ppm), such as titanium or cerium, strongly depress the oxygen chemical diffusion coefficient. These dopants trap the minority carriers, electrons or holes, and delay the establishment of the new steady-state oxygen activity profile inside the electrolyte upon a change in the surrounding oxygen activity. 10–13 However, very low dopant concentrations do not change the concentration of free minority carriers or its conductivity at equilibrium. 11 Sasaki and Maier performed a systematic study to determine the equilibrium concentration in different oxidation states of Ce and several 3d ions by monitoring in situ the optical absorption in YSZ single crystals or the EPR signals specific of one or both of the redox states of the dopant. 14 From this excellent work they provided expressions for the relative concentration of oxidized or reduced dopant vs the oxygen partial pressure (PO2 ). At 800 °C, the PO2 at which there are similar amounts of both oxidation states in YSZ goes from 10−24 bar for Ti3+/Ti4+ to 3 × 10⁻² bar for Mn2+/Mn3+. This value determines the oxygen activity range which each dopant can monitor.
In order to achieve spatial resolution to the oxygen activity monitoring in electrolytes, optical signals that can be detected through microscope objectives in backscattering geometry should be selected. For example, micro-spectroscopy involving electronic Raman scattering of Ce3+ in doped scandia stabilized zirconia, ScSZ, 15 or Raman of gadolinium doped ceria, GDC, 16 have been used to investigate degradation and oxygen activity in cross-sections of polarized cells. On the other hand, in-operando or in situ monitoring requires suitable probes for high temperature measurements. Raman spectroscopy has been used to analyze in situ interfacial and electrode processes in solid oxide fuel cells (SOFCs), as well as oxygen activity or stress in different layers of the cell, 17–21 by monitoring the Raman spectra of GDC in the electrolyte or the composite electrode. Specifically designed cells and systems were used by these authors to have optical access to the electrodes or to the region near the electrode-electrolyte interface. To allow optical access inside the electrolyte, cells built with YSZ single crystals as electrolytes could be used, with access through holes in the electrodes (working or counter electrode) or designing geometries with lateral optical access and meaningful polarization strategies. In addition to Raman, red-ox active luminescent probes, with sharp bands and small thermal quenching would also be appropriate, as luminescence usually produces more intense signals than Raman scattering. In this sense, most of rare earth ions dissolved in transparent oxides show sharp and rather intense luminescence bands, and some of them also persist up to high temperatures. In fact, Tb3+ or Eu3+ doped oxides have been evaluated as luminescence thermometers for high temperature applications. 22,23 In particular, 4 f ions are also easily introduced into the fluorite lattice of yttria stabilized zirconia (YSZ). 24,25
Among the ions of the 4 f group, those with the larger redox activity are Ce, Pr and Tb 26 and, in fact, solid solutions of ZrO2 with these rare earth oxides are being studied as oxygen storage compounds or for catalysis applications. 27 Cerium reduces to Ce3+ when the oxygen activity is low, having equal concentrations of Ce3+ and Ce4+ in YSZ at around PO2 = 3 × 10⁻¹⁴ bar (at 800 °C). 14 Ce3+ is optically active with an intense optical absorption band and electronic Raman activity, 10 but does not produce luminescence. The Ce3+ electronic Raman signal is no longer detectable at temperatures above approximately 300 °C, as proven in the course of this investigation. Pr and Tb are mainly in the 3 + oxidation state as dopants in YSZ, and show rich luminescence spectra. 28,29–32 Specifically, luminescence arising from radiative deexcitation of the 1D2 (Pr3+) and 5D4 (Tb3+) levels are intense. These levels are separated by about 7000 cm−1 and 15000 cm−1 from the next lower level, and therefore the thermal quenching of their luminescence is expected to be weak, as observed, 22 so that they could be useful as in situ probes.
The present work aims to study the changes in the optical spectra (absorption, reflectance and luminescence) of Pr or Tb doped YSZ upon different atmospheres. Ultimately, we seek to find the relationship between an appropriate luminescence signal and the oxygen activity inside the material, specifically in the relatively high oxygen partial pressure range, so that they could serve to monitor oxygen activity in the YSZ electrolyte near to the oxygen electrode.
Experimental
We have sintered samples with different concentrations of the dopants and solidified crystals of Tb doped YSZ to serve this study. Polycrystalline ceramic samples were prepared using solid state synthesis. Commercial powders of 8 mol% yttria-stabilized zircona (TZ-8YS, Tosoh Corp.) were weighed and mixed with Pr6O11 (99.9% Sigma Aldrich) or Tb4O7 (99.99% Thermo-Fischer Scientific) to obtain the desired dopant content. Sample acronyms and nominal compositions are given in Table I. Content of Hf and Y was analyzed for pristine TZ-8YS powder by X-ray fluorescence (THERMO ELECTRON, ARL series, model ADVANT'XP and the software UNIQUANT for semi-quantitative analysis).
Table I. List of acronyms and nominal compositions of the samples used in this work.
| Acronym | Dopant content (cation basis) | Nominal composition |
|---|---|---|
| YSZ-0.3Tb | 0.3 at% | (Zr0.843Y0.1484Hf0.0082)0.997Tb0.003O2−δ |
| YSZ-1Tb | 1 at% | (Zr0.843Y0.1484Hf0.0082)0.99Tb0.01O2−δ |
| YSZ-3Tb | 3 at% | (Zr0.843Y0.1484Hf0.0082)0.97Tb0.03O2−δ |
| YSZ-5Tb | 5 at% | (Zr0.843Y0.1484Hf0.0082)0.95Tb0.05O2−δ |
| YSZ-10Tb | 10 at% | (Zr0.843Y0.1484Hf0.0082)0.9Tb0.1O2−δ |
| YSZ-0.3Pr | 0.3 at% | (Zr0.843Y0.1484Hf0.0082)0.997Pr0.003O2−δ |
| YSZ-1Pr | 1 at% | (Zr0.843Y0.1484Hf0.0082)0.99Pr0.01O2−δ |
| YSZ-5Pr | 5.24 at% | (Zr0.843Y0.1484Hf0.0082)0.9476Pr0.0524 O2−δ |
The oxide mixture was mixed thoroughly with mortar and pestle. To prepare 1 gram of product, 5 drops of a 5 wt% polyvinyl alcohol (99+% Sigma Aldrich) solution in water were added to the powders to act as a binder. Cylindrical pellets of the powders were uniaxially pressed in a 13 mm diameter die applying 5 Tons for 5 min. The pellets were sintered at 1500 °C for 10 h, yielding fully dense pellets.
Single crystals were solidified using the laser floating zone method. 33 Feedstock rods with compositions YSZ-0.3Tb, YSZ-1Tb and YSZ-5Tb, approximately 2 mm in diameter, were prepared by isostatic cold pressing and sintering. The crystal was solidified pulling downwards at 50 mm h−1. After solidification the crystals were annealed in air at 1600 °C and cooled slowly (3 °C min−1) to relieve stresses. Analysis of the Tb content of the YSZ-1Tb solidified crystal was done by EDS (energy dispersive X-ray spectroscopy) in a field emission scanning electron microscope (FESEM, model Carl Zeiss MERLIN), using the equipment library of standards for quantification. This gave a Tb concentration of 1.03 at% Tb, standard deviation 0.07, in agreement with the nominal doping content.
Sets of both polycrystalline and single crystal samples were annealed at 900 °C for 2 h in different atmospheres and cooled to room temperature as fast as possible. Annealing conditions for equilibrium were previously determined by measuring diffuse reflectance of various samples with different annealing times, showing that 2 h long treatments are sufficient at 900 °C, while annealing at 800 °C needed 24 h dwelling times. Regarding the annealing media, flowing 5% H2-Ar, Argon, air or O2 at atmospheric pressure were used for anneals at PO2 up to 1 bar. The oxygen partial pressure was measured with a zirconia lambda probe for the treatments in flowing Ar and 5%H2-Ar at 800 °C. Pure static O2 in a pressurized chamber was used for anneals above atmospheric pressure. High pressure treatments were followed by free furnace cooling. When referring to samples annealed in the different media, −Air, −Ar or −H2 will be appended to the acronym listed in Table I.
Total hemispherical diffuse reflectance and optical absorbance measurements were carried out using a Cary 5000 UV–vis-NIR spectrometer (Agilent Technologies, Inc., USA). Most of the reflectance experiments were performed with a 110 mm diameter integrating sphere DRA-2500 (Agilent Technologies, Inc., USA). Unless otherwise stated, an 8 mm diameter diaphragm on the reflectance port to hold the sample and a Halon plate as reflectance standard. The reflectance spectra of the YSZ-5Pr sample was measured using a Praying Mantis accessory, and pressed BaSO4 as reference standard. For reflectance characterization, the pellets were ground with Carbimet SiC P320 grinding paper (Buehler) in order to assure an equal finish of the pellet surfaces. For optical absorption, crystal pieces were lapped and polished with diamond paste on both faces to get plane-parallel longitudinal slices around 1 mm thick.
Luminescence measurements were carried out using an excitation wavelength λ = 488.0 nm from an Ar+ laser source (INNOVA 200, Coherent, Palo Alto, CA, USZ) or a krypton-argon laser (Melles Griot, Carlsbad, CA, USA), with backscattering geometry. An optical microprobe spectrometer (Model XY, Dilor, France), equipped with a CCD detector and an Olympus BH-2 microscope, and a x50 long working distance (0.55 NA) microscope objective were used. Excitation output power were around 150 mW and less than 10 mW for YSZ-Pr and YSZ-Tb samples respectively, to avoid saturation of the CCD detector. The reported luminescence spectra are the average of at least 10 measurements on each sample. Raman spectra were measured with the same equipment, using appropriate laser lines for excitation.
The structure of the sintered and solidified samples was characterized by Raman spectroscopy. The spectra of the samples, ceramics and crystals, are given in the supplementary information, Fig. SI1 (available online at stacks.iop.org/JES/169/044503/mmedia). They show the typical spectra of cubic or t´´ zirconia. 34 As expected, the Raman shift of the O–Zr stretching mode (around 620 cm−1) moves towards lower energies as the dopant content increases, supporting the formation of a solid solution. 35
Results
Evolution of the optical absorption upon red-ox treatments
Reflectance spectra of Pr doped samples are given in Fig. 1a. In the SI (supplementary information), Fig. SI2, the spectra for 0.3% Pr and 5%Pr doped pellets are given. The spectra show a high reflectance background at long wavelengths with the corresponding absorption bands due to Pr3+ ions. These are intraconfigurational transitions from the ground state multiplet (3H4) level to excited levels within the 4f2 electronic configuration, and are clearly seen as valleys in the spectra. Broad and intense absorptions in the region from 2400 nm to 1200 nm correspond to transitions to multiplets 3H6, 3F2, 3F3 and 3F4. The band around 1000 nm corresponds to the transition to 1G4. The bands from 600 to 550 nm correspond to the transition to 1D2 and the ones with maxima from 487 nm to 450 nm to the transitions to 3P0, 3P 1, 3P 2. 30,36

Figure 1. (a) Total hemispherical reflectance of YSZ sintered pellets doped with 1%Pr (cation basis, nominal concentration). Different curves show the measurement on samples annealed at 900 °C in different atmospheres (5%H2-Ar (black, dotted line), Ar (red, dashed line), air (green, continuous line)). (b) Total hemispherical reflectance of YSZ sintered pellets doped with 0.3% (cyan, dash-dot line), 1% (green, dotted line) or 5% Pr (red, dashed line) (concentrations in cation basis, nominal concentration), annealed in air at 900 °C for 2 h (0.3% and 1% Pr) or in O2 at 600 °C for 48 h (5% Pr). (*) The measurement on the 5% Pr sample was made with the Praying Mantis accessory. For qualitative comparison with the other curves in the plot, this reflectance spectrum was multiplied by an arbitrary factor.
Download figure:
Standard image High-resolution imageAt short wavelengths the reflectance diminishes as the oxygen partial pressure increases, due to absorption. The sample annealed in air shows a broad absorption around 500 nm, which can be more clearly distinguished as the dopant concentration increases (see Figs. 1b, or SI2). Therefore, it is reasonable to associate this band to absorptions involving oxidized dopant species, such as interconfigurational Pr4+ transitions or charge transfer bands (from occupied O= orbitals to unoccupied Pr+4 orbitals), both of which are expected to have large optical activity (strong absorption). Hoefdraad 37 assigns similar absorption bands in oxides with 8-coordinated Pr4+ to charge transfer bands, which would appear at lower energies than interconfigurational transitions.
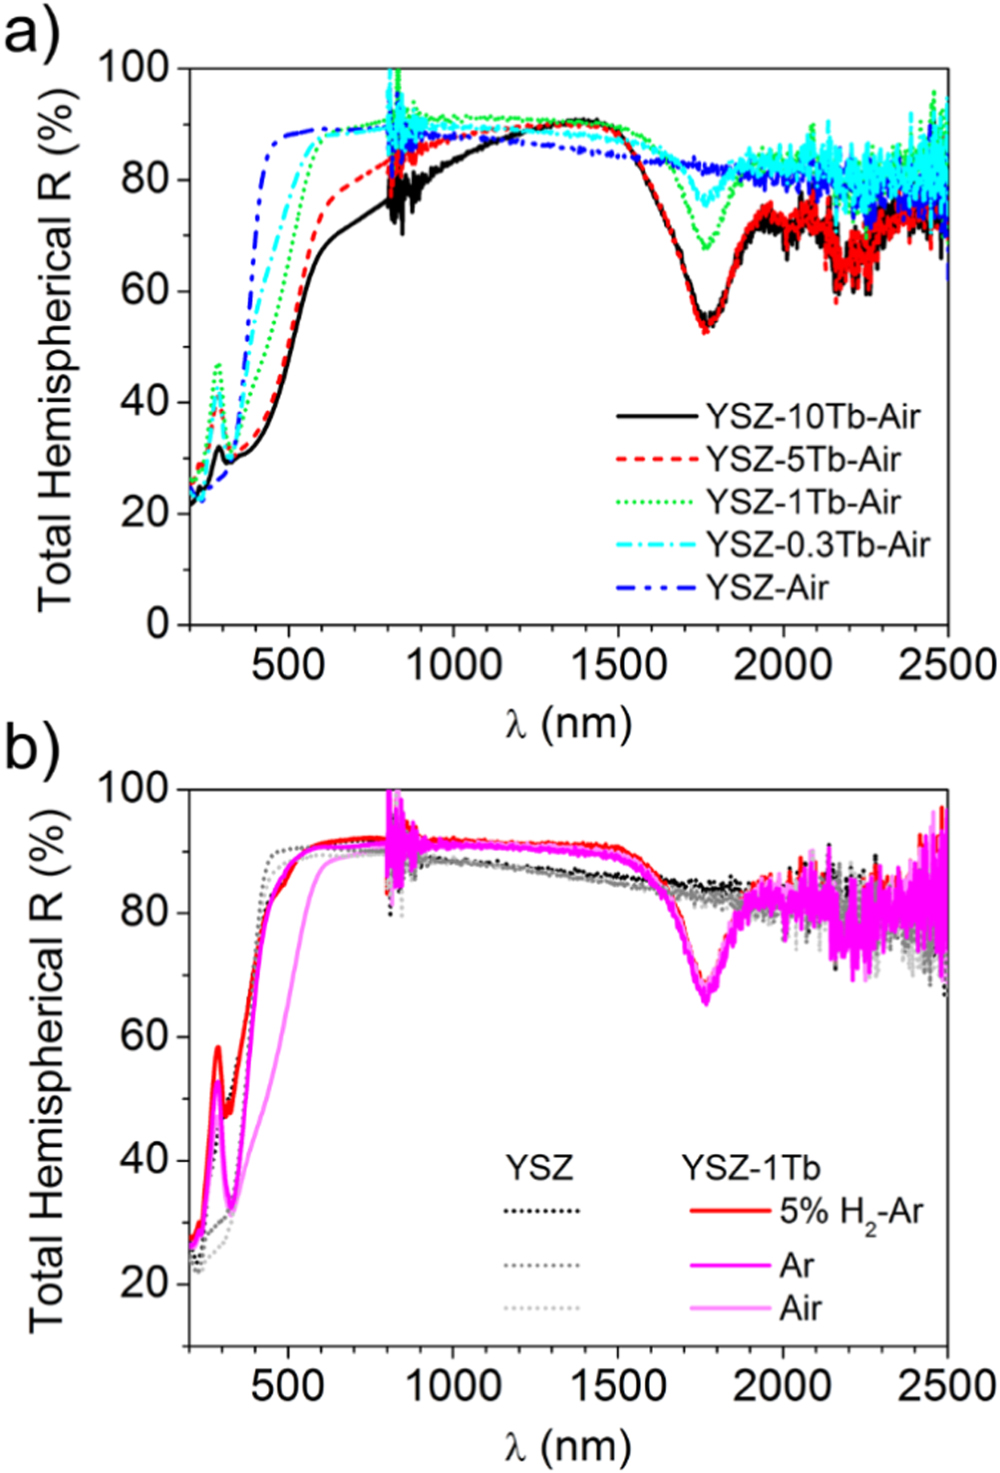
As in the Pr doped samples, the reflectance spectra of Tb doped pellets (Figs. 2a and 2b) show a high reflectance background with strong absorption in the UV absorption edge. In the SI, Fig. SI3, the spectra for the same samples annealed in argon and 5% H2-Ar are given, while Fig. SI4 gives the spectra for the sample YSZ-5Tb. In the near infrared (NIR) region, absorption bands (valleys) due to Tb3+ ions transitions within the 4f8 electronic configuration are clearly seen. These are absorptions due to transitions from 7F6 to levels 7F0, 7F1 or 7F2 multiplets. 38,39 Much weaker are the Tb3+ absorption bands in the visible region, 40 which are hard to distinguish in Fig. 2. Figure 3 shows the optical absorption spectra of 1at% Tb doped single crystals, in the VIS-UV range. Small absorption bands corresponding to excitations to the 5D4 level at 487 nm and to the 5D3 at 380 nm can be seen in the inset. It shows the absorption of the sample annealed in 5% H2-Ar from 360 to 500 nm. Another broad absorption band in this region of the spectrum, with maximum at around 360 nm (3.45 eV) and full with at half maximum (FWHM) around 1.2 eV, is evident in the absorption spectra of the crystal annealed in air. This absorption band together with the specific scattering gives rise to the reflectance spectra as broad, diminished reflectance in the short wavelength side (λ < 500 nm), being more intense the higher the dopant concentration (see Fig. 2a) and the higher the oxygen activity of the annealing atmosphere (Fig. 2b).

Figure 2. (a) Total hemispherical reflectance of YSZ sintered pellets, undoped and doped with Tb and annealed in air at 900 °C for 2 h, followed by quenching: undoped (blue, dash-dot-dot line), YSZ-0.3Tb (cyan, dash-dot line), YSZ-1Tb (green, dotted line), YSZ-5Tb (red, dashed line) and YSZ-10Tb (black, continuous line)). (b) Total hemispherical reflectance of YSZ (dotted lines) and YSZ-1Tb (continuous lines) sintered pellets, annealed in different atmospheres at 900 °C for 2 h. In air: light grey and light pink; in Ar: grey and magenta; in Ar-5%H2: red and black lines.
Download figure:
Standard image High-resolution image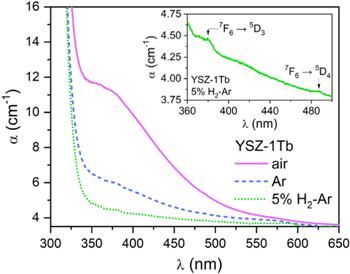
Figure 3. Optical absorption spectrum of YSZ-1Tb single crystals annealed in different atmospheres at 900 °C for 2 h. Dotted line: YSZ-1Tb-H2; dashed line: YSZ-1Tb-Ar and continuous line: YSZ-1Tb-air. On the inset, detail of the peaks corresponding to Tb3+ absorptions in the YSZ-1Tb-H2 crystal.
Download figure:
Standard image High-resolution imageNote also that the reflectance of the undoped sample decreases as wavelength increases (Fig. 2a). We can attribute this behavior to the smaller scattering as wavelength increases expected for well-sintered YSZ. This leads to a fraction of the incident light intensity escaping the experiment (either as forward transmittance or through the sample edges). As the dopant content increases, this tendency is less evident (see also Fig. SI3 in SI, for reflectance spectra of the samples annealed in 5% H2-Ar).
The reflectance spectra for highly doped, oxidized samples show also a large absorption tail extending from the VIS up to 1200 nm, caused either by the large width of the optical absorption band or by other, less intense and broad absorptions extending towards lower energies. The optical absorption measured on a nominally 5 at% Tb doped crystal is proportional to the one shown in Fig. 3 with appropriate scaling for concentration and scattering and/or reflectance at the crystal surfaces. The spectra are shown in SI (Fig. SI5). It is clear that this absorption is due to oxidized species related to the Tb dopant, that on the same grounds than in Pr doped zirconia, can be assigned to charge transfer (from occupied O= orbitals to unoccupied Tb+4 orbitals). Broad band assigned to Tb4+ CT transitions have been reported by van Vugt et al. in ZrO2, 41 Hoefdraad in ThO2 and other oxides, 37 Verma et al. in MO-Al2O3 phosphors 42 or E. Zych et al. in Lu2O3 scintillators. 43
Finally, note in Figs. 2b and SI4 (reflectance spectra), as well as in absorption (Fig. SI5), that the large increase in absorption in the visible–UV range associated to the formation of oxidized species is not accompanied by a decrease in absorption of the Tb3+ absorption bands, for example the ones in the NIR. The same is true for the Pr doped samples (see Fig. 1), and was also observed by Savoini et al. investigating the absorption spectra of single crystals. 30 That is, only a very small fraction of rare earth dopant has been oxidized in the air anneals. The NIR absorption spectra of the 5% Tb doped crystal allows estimating an upper limit of 0.1% of Tb3+ oxidized to Tb4+ upon annealing in air at 900 °C.
Luminescence
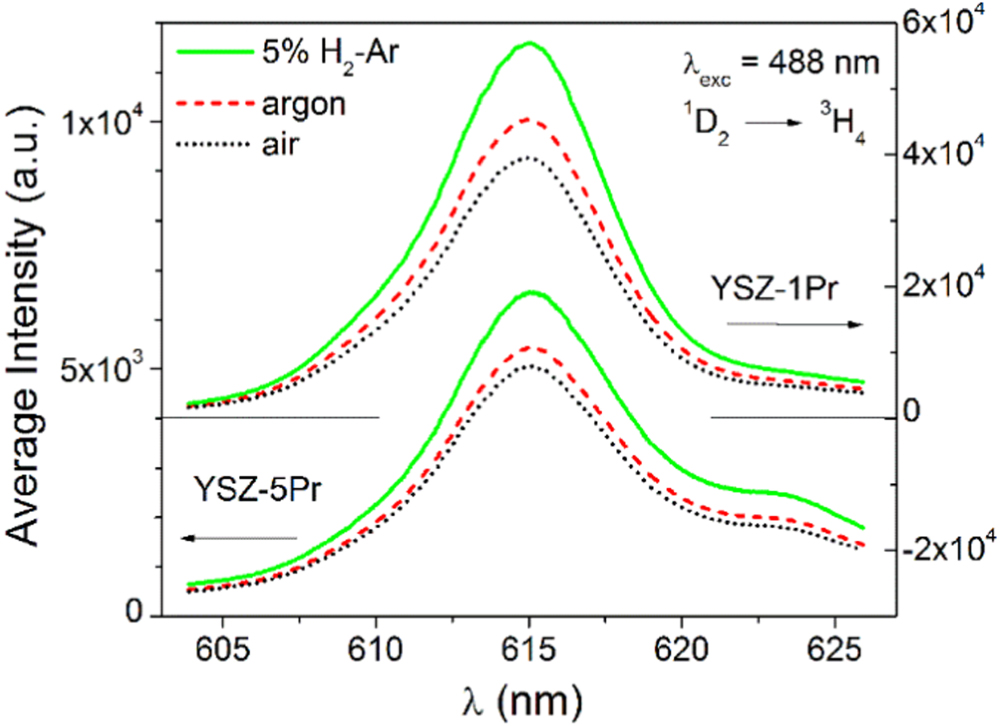
The observed luminescence spectra of the YSZ doped samples annealed in air, Ar or 5%H2-Ar flows correspond to luminescence of the dopants in the 3+ oxidation state. The luminescence spectra of Pr3+ and Tb3+ ions in YSZ have been previously reported. 28,30,32 Here we are interested in the most intense luminescence bands in the VIS from levels with small thermal quenching. Excitation with the 488 nm Ar+ laser line is resonant with the 3H4 → 3P0 and 7F6 → 5D4 absorptions of Pr3+ or Tb3+ respectively, and produces luminescence bands in the visible region. In YSZ:Pr3+, the most intense band appears around 615 nm arising from radiative deexcitation of the 1D2 level to the ground state (3H4 multiplet). In YSZ:Tb3+ the strongest luminescence is the one around 550 nm, produced by radiative deexcitation of the 5D4 level to the first excited multiplet (7F5).
The spectra of samples with 1 at% and 5 at% doping of the respective ions, and annealed in the different atmospheres at 900 °C are given in Fig. 4 (YSZ-xPr) and Fig. 5 (YSZ-xTb). Quantitative details are collected in Table II. For both dopants, the samples annealed in reducing atmosphere show the strongest luminescence. The intensity ratio of each sample vs its value in the reduced sample is also given in Table II. This ratio changes consistently (above the uncertainty of the measurement) and is smaller in the samples with 5 at% Tb. Note for example that the measured luminescence in the samples doped with 5 at% Tb annealed in air are around 1/3 of the one measured for the samples annealed in H2. For 1 at% Tb or Pr doped samples the ratio is around 0.7 to 0.8.

Figure 4. Luminescence spectra corresponding to the transition 1D2 to 3H4, excited with λ = 488 nm (Ar + laser line), measured at room temperature on Pr doped YSZ pellets previously annealed at 900 °C in different atmospheres. Upper plots and right-hand side scale: YSZ-1Tb; lower plots and left-hand side scale: YSZ −5Tb. Treatments in 5% H2-Ar (dotted black lines), Ar (dashed red lines) and air (continuous green lines).
Download figure:
Standard image High-resolution image
Figure 5. Luminescence spectra corresponding to the transition 5D4 to 7F5, excited with λ = 488 nm (Ar+ laser line), measured at room temperature on Tb doped YSZ pellets previously annealed at 900 °C in different atmospheres. Upper plots and right-hand side scale: YSZ-1Tb; lower plots and left-hand side scale: YSZ −5Tb. Treatments in 5% H2-Ar (dotted black lines), Ar (dashed red lines) and air (continuous green lines).
Download figure:
Standard image High-resolution imageTable II. Average Intensity (I, arbitrary units) at the maximum of the spectra plotted in Figs. 4 and 5, standard deviation (σd) and their ratio (3th and 6th columns).
| Sample | I at 543.6 nm (σd)-Tb | Ratio I vs H2 (σd)-Tb | Sample | I at 615 nm (σd)-Pr | Ratio I vs H2 (σd)-Pr |
|---|---|---|---|---|---|
| YSZ-1Tb-H2 | 24025 (930) | — | YSZ-1Pr-H2 | 56901 (4966) | — |
| YSZ-1Tb-Ar | 23664 (1206) | 0.98 (0.06) | YSZ-1Pr-Ar | 45418 (4545) | 0.80 (0.11) |
| YSZ-1Tb-Air | 16891 (375) | 0.70 (0.03) | YSZ-1Pr-Air | 39506 (3308) | 0.69 (0.08) |
| YSZ-5Tb- H2 | 96787 (6992) | — | YSZ-5Pr-H2 | 6542 (603) | — |
| YSZ-5Tb-Ar | 68670 (2445) | 0.71 (0.06) | YSZ-5Pr-Ar | 5434 (867) | 0.83 (0.15) |
| YSZ-5Tb-Air | 31874 (1639) | 0.33 (0.03) | YSZ-5Pr-Air | 5052 (398) | 0.77 (0.09) |
The dependence of the average peak intensity with concentration is different for each dopant (Table III). On the one side, YSZ-5Pr samples show smaller luminescence intensity than YSZ-1Pr, as well as a change in the shape of the spectra. Savoini et al. 30 observed a faster decay monitoring the 1D2 to 3H4 luminescence in YSZ doped with 6.3 at% Pr, ascribed to concentration quenching by cross-relaxation, 44 which explains the strong decrease of the luminescence intensity, as also recently observed by Wang et al. 45 for YSZ doped with Pr at concentrations above 1 at% Pr. This luminescence band also overlaps the rather intense low energy feature of the absorption corresponding to the transition 3H4 to 1D2. 46 We did not use confocal diaphragm to register the luminescence, so that light emitted at planes below the surface comes inside the spectrograph and CCD detector. The attenuation of the emitted light by self-absorption can contribute to the change of the luminescence band profile of sample YSZ-5Pr with respect to the one of YSZ-1Pr. In addition, other luminescence lines from deexcitation of the 3P0 to the 3H6 multiplets might become apparent as the intensity of the 1D2 to 3H4 luminescence decreases by cross-relaxation, and thus change the shape of the spectrum. Note that this luminescence intensity ratio is only slightly dependent on the thermochemical treatment, compatible with processes related to Pr3+ to be the responsible ones for the change in intensity.
Table III. Ratio of the Luminescence Intensity at maximum between the 5 at% doped sample and the 1 at% doped sample and their standard deviations (calculated from the data compiled in Table II).
| Sample | Ratio at 543.6 nm, Tb | σd | Sample | Ratio at 615 nm, Pr | σd |
|---|---|---|---|---|---|
| YSZTb-H2 | 4.03 | 0.33 | YSZPr-H2 | 0.11 | 0.01 |
| YSZTb-Ar | 2.90 | 0.18 | YSZPr-Ar | 0.12 | 0.02 |
| YSZTb-Air | 1.89 | 0.11 | YSZPr-Air | 0.13 | 0.02 |
In the Tb doped samples there is a very slight broadening of the spectra and a shifting of the maximum towards higher energies (by 4 cm−1 approx.) with the increase in the Tb concentration. There is also a more intense luminescence as the Tb concentration increases. This is clearly seen in Fig. 6, where the intensity values at maximum have been plotted with respect to the Tb dopant concentration. This luminescence is not expected to be strongly affected by concentration quenching. 47,48 The dependence is sublinear, that is, the measured luminescence intensity increases slower than the Tb concentration.
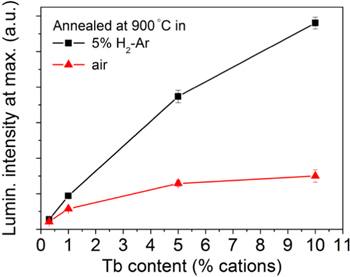
Figure 6. Intensity of the luminescence at 543.6 nm in Tb doped YSZ pellets. The error bars have a length of twice the standard deviation for 5 measurements on each sample surface. The samples have been annealed at 900 °C in 5%H2-Ar (black squares) and in air (red triangles).
Download figure:
Standard image High-resolution imageDiscussion
For the purpose of monitoring oxygen activity in YSZ, the results presented in the previous sections show that both dopants, Tb and Pr, show red-ox activity with clearly observed reflectance variations in the blue to green region of the spectra (350 to 500 nm), for cation dopant concentrations above around 1%. The maximum variation of optical activity observed takes place at oxygen partial pressures above 10−4 bar (equivalent to flowing Ar). Both 3 + ions also show intense luminescence peaks in the VIS, whose intensity changes consistently with the redox treatment. The luminescence measured at 615 nm of Pr3+ doped samples is affected by concentration quenching and self-absorption, which in practice hinders quantitation of the oxygen activity.
On excitation of YSZ:Tb at 488 nm, the ratio of the luminesce intensity in the reduced samples with respect to the oxidized ones (annealed in air) is higher the higher the Tb content, according to the results shown in Fig. 6 and Tables II and III. This behavior can be easily understood as a competitive absorption of the incoming radiation at 488 nm by the Tb3+ ions, whose concentration remains practically unchanged upon the thermochemical treatments, and the absorption associated to (the small amount of) Tb4+. As the absorption coefficient of Tb3+ at 488 nm is very small (see Fig. 3, inset) for YSZ-1Tb and, in samples annealed in Ar or higher oxygen partial pressure atmospheres, the attenuation of the incoming radiation is almost fully due to the absorption assigned to the O2− to Tb4+ charge transfer band. The luminescence intensity will be an indirect measurement of this absorption. From Fig. 6 it is clear that the most sensitive measurement for up to 0.21 PO2 (air) will be the one performed with YSZ-10Tb doped ceramics. For higher values of the oxygen partial pressure, lower dopant concentrations would be better in order to keep the sensitivity.
The precise, quantitative relationship between oxygen activity and luminescence intensity will be dependent on the dopant amount and the excitation and collection optical systems, including also the sample scattering as all together determine the volume of sample explored in the experiment. For this reason, it is not straightforward to establish a direct relationship between the information supplied by the reflectance measurements and the luminescence ones. In order to establish a quantitative relationship between oxygen activity and optical signal, we have chosen 3 at% Tb doped YSZ (YSZ-3Tb), 800 °C annealing temperature and extended the PO2 range up to 100 bar. The total hemispherical reflectance and luminescence spectra are given in Fig. 7.

Figure 7. Hemispherical reflectance (a) and room-temperature luminescent emission spectrum of the Tb3+ 5D4 → 7F5 transition with excitation at 488 nm (b) of YSZ-3Tb samples, annealed at 800 °C for 24 h in different atmospheres. In this case a 3 mm diameter diaphragm was used on the sample at the reflectance port of the integrating sphere. A logarithmic scale is used for luminescence intensity in figure (b). The thin, black, dotted straight line in Fig. 7a is Rwhite, as explained in the text.
Download figure:
Standard image High-resolution imageQuantitative analysis of the reflectance spectra
NIR reflectance allows a rough upper limit estimate of the proportion of Tb ions oxidized from the NIR reflectance spectra, giving that less than 1% of Tb ions were oxidized by the annealing in 100 bar O2. Therefore, a relative quantification of the Tb4+ content will be possible following the variation of the optical signals.
In the absence of light emission, the measured total hemispherical reflectance (Fig. 7) is the amount of the incident light intensity that is neither absorbed nor transmitted by the sample, that is,

where R, T and A being total hemispherical reflectance, forward transmittance and absorptance. Outside the absorption bands, the forward transmittance increases with wavelength due to decreasing scattering. One can take out transmitted light from the equation (and the attenuation of the rays that end up forward transmitted) by dividing the measured reflectance by the reflectance that would be measured in a sample without absorption, that we will call Rwhite. We can estimate Rwhite with the dotted straight line plotted in Fig. 7a. Rnorm is calculated as

and plotted in Fig. SI5. Now, we approximate the above Eq. 1 to

where Rnorm is the normalized reflectance as described, and A is the absorptance.
For small enough absorption coefficient it is reasonable to assume that the volume of sample explored in the reflectance experiment at each wavelength is determined by the microstructure (and possibly sample thickness according to the present normalization) and is independent of the absorption. Upon this assumption, from A it is possible to estimate the optical density (OD) or absorbance with

or

OD is proportional to the absorption coefficient and the length of the light path in the material. If the length of the light path is constant, OD is a measurement of the absorption coefficient, which is the product of the molar absorption coefficient times the concentration of the optically active species. We have the measurement of the Tb4+ relative concentration.
The values of the calculated OD for selected wavelengths as a function of PO2 are given in Fig. 8. On the same plot, with open symbols, we give also the OD estimated for a 2 mm thick YSZ crystal doped with 3 at% Tb. These have been estimated from the OD measured for YSZ-5Tb crystals annealed at 900 °C in Ar or air (see Figs. 3 and SI5) as proportional to the respective dopant content. Note that at λ = 500 nm, both estimates coincide nicely for samples annealed in Ar (absorption coefficient ≈ 0.52 cm−1) or air (absorption coefficient ≈ 3.0 cm−1). This means that 2 mm is a reasonable estimate for the 500 nm light path length in the ceramics in the course of the reflectance measurement. The reasonable agreement between both estimates of absorption at 500 nm but large disagreement at 400 nm, tells also that in the latter case, the estimate of the OD from reflectance measurements as proportional to the absorption coefficient is valid up to OD values of around 0.15 (absorption coefficient of the crystal smaller than 2 cm−1).
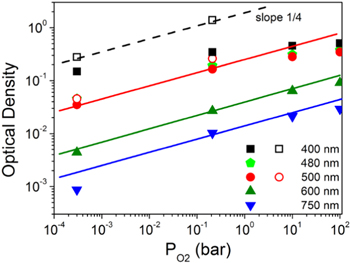
Figure 8. Estimated Optical Density for YSZ-3Tb at selected wavelengths, as a function of the annealing oxygen partial pressure. Full symbols: estimates from the reflectance of YSZ-3Tb ceramics as OD = −log(Rnorm); open symbols: estimates for a 2 mm thick crystal with 3 at% Tb, using the measured absorption coefficient values of the YSZ-5Tb single crystal. The lines, with slope ¼, are guides to the eye.
Download figure:
Standard image High-resolution imageAt 750 nm and 600 nm, the assumption of small absorption coefficient (α) holds. From the absorption spectra in a sample annealed in air (Figs. 3 or SI5) one can infer that it is smaller than α = 0.3 cm−1, so that, after a light path (d) of around 2 mm, OD = 0.434αd would be below 0.03. All OD values in Fig. 8 for 600 and 750 nm are below 0.1. As indicated by the lines, this OD is approximately proportional to  At shorter wavelengths (larger optical absorption), the proportionality of OD with
  is observed for the measurements in the single crystals (λ = 400 nm or 500 nm), or for the estimates in the ceramic samples when OD remains below around 0.15.
At large OD, for example for λ = 500 nm and very oxidized samples or for λ = 400 nm, there is a deviation of the  that might be expected as the absorption coefficient cannot be so easily extracted from Rnorm, or otherwise stated, the OD value estimated as –log (Rnorm) is no longer proportional to the absorption coefficient. The light path decreases as the optical absorption coefficient increases.
The proportionality of the absorption coefficient with  is in agreement with the absorption being due to oxidized species trapping one electron hole. In YSZ, an oxide ion conductor with large concentration of oxygen vacancies, the incorporation of oxygen fills-in a small proportion of oxygen vacancies and introduces electron holes. The latter ones oxidize Tb3+ ions to Tb4+, ultimately responsible for the observed absorption. The concentration of Tb4+ species depends on the PO2
.
49
The equilibrium with the atmosphere through oxygen exchange
is in agreement with the absorption being due to oxidized species trapping one electron hole. In YSZ, an oxide ion conductor with large concentration of oxygen vacancies, the incorporation of oxygen fills-in a small proportion of oxygen vacancies and introduces electron holes. The latter ones oxidize Tb3+ ions to Tb4+, ultimately responsible for the observed absorption. The concentration of Tb4+ species depends on the PO2
.
49
The equilibrium with the atmosphere through oxygen exchange

for constant concentration of oxygen vacancies and oxide ions states that

Local redox equilibrium (hole trapping)

tells that

From Eqs. 5b and 6b it results,

Where ![${\left[T{b}_{Zr}\right]}_{0}$](https://content.cld.iop.org/journals/1945-7111/169/4/044503/revision3/jesac60f2ieqn5.gif) is the total concentration of Tb, and P0
is a temperature dependent parameter that encloses the proportionality constants of Eqs. 5b and 6b. We have used Kröger-Vink notation.
is the total concentration of Tb, and P0
is a temperature dependent parameter that encloses the proportionality constants of Eqs. 5b and 6b. We have used Kröger-Vink notation.
In the present case where only a negligible proportion of Tb is oxidized, ![$\tfrac{\left[T{b}_{Zr}^{\times }\right]}{{\left[T{b}_{Zr}\right]}_{0}}$](https://content.cld.iop.org/journals/1945-7111/169/4/044503/revision3/jesac60f2ieqn6.gif) ≪1,
≪1,

P0 , the pressure at which the concentration of reduced and oxidized Tb species is equal, takes in this case extremely high values, higher than 108 bar.
Quantitative analysis of the luminescence for YSZ-3Tb
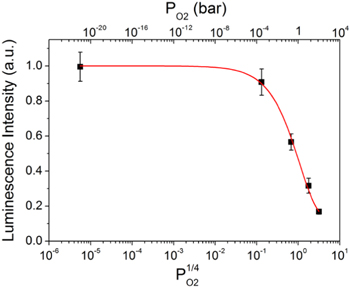
The luminescence intensity values at the peak maximum (543.6 nm) as a function of oxygen partial pressure of thermochemical treatment are given in Fig. 9. As already argued above, the measured Tb3+ luminescence is excited with the amount of incident light intensity that is available after reflection at the incident sample surface and absorption by the oxidized species into the volume of sample intervening in the experiment. Therefore, only the non-absorbed light is available for excitation, or 1−A = Rnorm if one would measure the back scattered reflectance in the optical configuration used to measure the luminescence. As above, Rnorm can be written as 10−OD. Let us assume that the participating volume is small enough such that it is the same at all conditions (small optical density also in the most oxidized sample). This assumption is expected reasonable for excitation and collection through a microscope objective, and it results in OD (λ1) being proportional to the absorption coefficient and therefore to the concentration of the oxidized species, ![$\left[T{b}_{Zr}^{X}\right].$](https://content.cld.iop.org/journals/1945-7111/169/4/044503/revision3/jesac60f2ieqn7.gif) λ1 is the excitation wavelength, 488 nm. Similarly, the emitted light, with wavelength λ2 = 543.6 nm, suffers scattering and absorption before reaching the objective towards the detector. After reflection, scattering and absorption, the luminescence intensity will be proportional to
λ1 is the excitation wavelength, 488 nm. Similarly, the emitted light, with wavelength λ2 = 543.6 nm, suffers scattering and absorption before reaching the objective towards the detector. After reflection, scattering and absorption, the luminescence intensity will be proportional to

where we have assumed that the proportion of light reflected at the incident surface is constant, independent of the sample oxidation state. Both optical densities are proportional to  and therefore a functional dependence such as

is expected. To better fit to the experimental data, a constant independent term has been added. The continuous line in Fig. 9 is a fit to the data with the expression

which gives a = 0.124 ± 0.014 and b = 0.41 ± 0.03 bar−1/4, with R = 0.9964 and PO2
given in bar. Figures after ± are standard errors. This rough approximation cannot explain the extra term needed to fit the data. b has to be compared with the known values of extinction coefficients. From the reflectance spectra (Figs. 7 or SI5) of the sample annealed in Ar (low absorption), one can estimate OD (λ1)/OD (λ2) = 2.5. Then one can split the total OD (λ1) + OD (λ2) =  between both wavelengths. Let us take
  as 0.21 bar. Then OD (λ1) + OD (λ2) = 0.28, and OD (λ1) = 0.20. From the single crystal optical absorption spectra we can estimate the absorption coefficient as 3.4 cm−1 at 488 nm for 3Tb-YSZ. With this value, one can estimate the path-length the light has travelled in the sample in the luminescence experiment as
If we force to a = 1 in the fitting, b decreases to 0.31 and the estimate for d goes to 1.1 mm. This estimate for d is near to the one estimated in the reflectance experiments, although somewhat smaller as expected by the different optical arrangement. The actual distance that the light has travelled into the sample would be much smaller than 1.1 mm due to scattering. For example, in dense Al2O3-YSZ-YAG micro-composites produced by controlled solidification of eutectics, Mesa et al. 50 estimated 5 times longer path-length than sample thickness. A better knowledge of the light scattering in these ceramic pellets, which contain tiny residual porosity, is needed to know the real volume that participates in the experiment. Based on the present results, the depth of sample explored by the backscattering luminescence experiments might be of the order of 100 μm.
Figure 9. Luminescence intensity of YSZ-3Tb at room temperature vs the annealing  at 800 °C. The continuous line is a fit to the data (see text).
Download figure:
Standard image High-resolution image
It is relevant to note that in the range from 10−4 to 100 bar, there is an almost linear relationship between luminescence intensity and  that can be used to monitor the oxygen activity in these YSZ electrolytes.
Conclusions
Pr and Tb dissolve into the YSZ lattice mainly as 3 + ions, with less than 1% in a higher oxidation state when the samples are equilibrated in air at atmospheric pressure. The high optical activity of these 4 + ions provides measurable optical signals (absorption coefficient, reflectance and luminescence) that correlate with the oxygen activity. The experiments show that terbium is better suited for quantification than praseodymium as concentration quenching and superposition of luminescence bands with the one of interest are absent in the first case. The Tb4+ absorbance is proportional to  as expected for an ion having trapped one hole. In the backscattering geometry used in the experiments, a relationship between the luminescence intensity and PO2
has been found, that is consistent with the trapping model and can be used to quantify PO2
(oxygen activity) in the range form 10−4 to 102 bar. This range is relevant to investigate the oxygen activity near to the oxygen electrode in solid oxide cells, mainly when operated as electrolysers.
as expected for an ion having trapped one hole. In the backscattering geometry used in the experiments, a relationship between the luminescence intensity and PO2
has been found, that is consistent with the trapping model and can be used to quantify PO2
(oxygen activity) in the range form 10−4 to 102 bar. This range is relevant to investigate the oxygen activity near to the oxygen electrode in solid oxide cells, mainly when operated as electrolysers.
Acknowledgments
This work was financially supported by grant RTI2018-098944-J-I00 funded by MCIN/AEI/ 10.13039/501100011033 and by "ERDF A way of making Europe" and Grant RYC2018–025553-I funded by MCIN/AEI/ 10.13039/501100011033 and by "ESF Investing in your future." The Departamento de Ciencia, Universidad y Sociedad del Conocimiento del Gobierno de Aragón is also acknowledged for the financial support to the Research Group T02 20 R. Adrián Robles-Fernández thanks for the grant BES-2016–078508 funded by MCIN/AEI/ 10.13039/501100011033 and by "ESF Investing in your future." Authors would like to acknowledge also the Servicio General de Apoyo a la Investigación SAI, Universidad de Zaragoza.