
Abstract
Aquotris(benzotriazole)sulfatocopper(II).benzotriazole (BTAH-Cu2+) framework was assembled (exploiting π-π interactions) on MWCNTs modified glassy carbon electrode (GCE/MWCNTs@BTAH-Cu2+) for efficient sensing of hydrogen peroxide in pH 7 phosphate buffer solution (PBS). The modified electrodes showed stable and well-defined surface confined redox peak at an apparent electrode potential, Eo' = −182 mV vs. Ag/AgCl with surface excess value of 5.519 nmol cm−2. Structural, physicochemical and electrochemical characterizations of modified electrodes by single crystal XRD, FESEM, Raman spectroscopy, FTIR, QCM and control electrochemical experiments revealed the crystal structure of BTAH-Cu2+ and it's adsorption on MWCNTs. Highly redox active GCE/MWCNTs@BTAH-Cu2+ showed excellent H2O2 sensing in comparison to GCE/BTAH-Cu2+ in pH 7 PBS highlighting the importance of MWCNTs. Amperometric i-t sensing of H2O2 on MWCNTs@BTAH-Cu2+ revealed suitability of this sensor for the linear range, 20–200 μM. The sensitivity and detection limit values are 0.153 A M−1 cm−2 and 3.3 μM respectively. Koutecky-Lévich analysis of H2O2 reduction reaction on GCE/MWCNTs@BTAH-Cu2+ confirms the two electron reduction reaction of H2O2. The ability of the MWCNTs@BTAH-Cu2+ for routine analyses was demonstrated by employing this sensor for H2O2 detection in commercial cosmetic samples.
Export citation and abstract BibTeX RIS
H2O2 sensing is considered as the most important aspect of pharmaceutical, clinical, mining, textile and environmental sciences. H2O2 is a cytotoxic material for living organisms, and play a vital role in biological processes where it acts as a signalling molecule in controlling diverse biological processes such as immune cell activation, vascular remodelling, apoptosis, root growth and stomatal closure.1–3 In many biochemical reactions catalysed by enzymes such as glucose oxidase, cholesterol oxidase, oxalate oxidase etc. H2O2 is generated as a by-product4–6 Hence, quantitative sensing of H2O2 is considered as an important area of research both in academic and industrial R&D. Many of the conventional techniques such as fluorimetry,7 fluorescence,8 chemiluminescence9 and spectrophotometry10 used for H2O2 detection are very complex and time consuming. In contrast, electrochemical sensing of H2O2 is rapid, simple and cost effective. As H2O2 is amphoteric, it can be sensed either by oxidizing into oxygen or reducing into water using ordinary solid electrodes. Due to the heavy overpotential involved during H2O2 sensing on these electrodes coupled with lower sensitivity towards H2O2 in presence of other electroactive interferences such as ascorbate, urate, bilirubin etc., many electrode modification strategies were adopted to reduce overpotential and to improve sensitivity. Towards this end, the solid electrodes modified by metal phthalocyanines,11 redox proteins,12,13 transition metal oxides,14,15 transition metal,16 transition metal complexes,17,18 metal organic frameworks,19 dyes,20,21 redox polymers,22,23 nanostructured materials24 and carbon nanotubes25 were adopted for H2O2 sensing.
Recently, many metal organic frameworks (MOFs) have been shown to be promising for electrochemical sensor applications. The variable valency of the metal in MOFs coupled with their diverse structures make them highly suitable for sensing. In addition to sensors, MOFs have received considerable attention in other electrochemical fields such as supercapacitor,26 lithium-ion battery27 and fuel cells.28 Zhang et al. developed a Cu based MOF with 3D superamolecular architecture for H2O2 sensing in 0.1 M NaOH solution, which exhibited a sensitivity of 78.22 μA μM−1 in the concentration range of 0.1 μM to 2.75 μM.29 Similarly, Yang et al. reported a Co-MOF for H2O2 sensing in 0.1 M NaOH solution, with a sensitivity value of 0.083 A M−1 cm−2 in the concentration range 5 μM to 9.0 mM.30 Although, variety of MOFs are known for sensing, one could not realize a single component MOF based electrochemical sensors due to their poor electronic conductivity.31 In order to utilize MOFs effectively, new strategies were adopted to improve their conductivity in electrodes. Most common method is incorporation of conductive phase such as carbon nanotubes and carbon blacks with MOF.32–35 Wang et al. demonstrated a Ni-MOF anchored on CNTs to be effective H2O2 sensor in 0.1 N NaOH solution.32 Zhang et al. developed a composite of Cu-MOF with macroporous carbon for NADH oxidation and H2O2 reduction in neutral solution.33 Recently, Meng et al. prepared a composite of acetylene black(AB) with Cu-MOF ({[Cu2(bep)(ada)2.H2O}n, where beb is 1,4-bis(2-ethylbenzimidazol-1-ylmethyl)benzene and 1,3-H2ada is 1,3-adamantanediacetic acid)) for H2O2 sensing. Cu-MOF with 2 wt. % of AB added showed nearly two times increase in sensitivity (5.56 μA μM−1 cm−2) in comparison to that of 0 wt. % of AB mixed Cu-MOF.36 Ehsani et al. have used p-type conducting polymer (polyaniline) to enhance the conductivity of the Polyaniline-Cu-MOF (Cu-bipy-BTC, where bipy = 2,2'-bipyridine and BTC = 1,3,5-tricarboxylate) nanocomposite.37 In many of these studies redox active metal-organic complexes drop casted on carbon materials such as multiwalled carbon nanotubes (MWCNTs) were used as sensors.18,38,39 Parnell et al. have used Co(III)-amidomacrocyclic ligand based complex drop casted on MWCNTs to obtain a H2O2 sensor. They were able to detect H2O2 in the concentration range of 5 × 10⁻⁸ M to 1 × 10⁻⁴ M.18 Zhuang et al. have employed Cu-triazole mixed with carbon paste (Cu-CPE) as a sensor for H2O2 and nitrite.38 Chen et al. demonstrated H2O2 sensing on a trinuclear copper (I) complex covalently attached to the Au surface.39 This material could sense H2O2 in the concentration range of 0.05 μM – 60 μM at 0.22 V in pH = 7. Although many copper complexes have been reported for sensing application,36–41 MWCNTs/BTAH-Cu2+ (where BTAH is benzotriazole) modified glassy carbon electrode (GCE) is not explored for sensing application.
One of the drawbacks of the drop casting technique is that there is no guarantee for the complete immobilization of the redox active material deposited on the carbon materials. Moreover, drop casting may not provide uniform coating and hence reproducibility could be an issue. In this study, we have used π-π interactions to assemble the BTAH-Cu2+ on to the MWCNTs modified GCE surface. The role of MWCNTs are two fold, one is to anchor the BTAH-Cu2+ and the other is to provide electrically conducting path up to the BTAH-Cu2+ MOF. BTAH-Cu2+ anchored MWCNTs showed high reproducibility and exhibited a surface confined redox feature and its mediated H2O2 sensing in pH 7 phosphate buffer solution.
Experimental
Materials
1,2,3-benzotriazole (BTAH) and multiwalled carbon nanotube (MWCNT, >90% carbon basis, diameter: 110–170 nm; length: 5–9 μm) were purchased from Sigma Aldrich. Graphite fine powder was obtained from Lobachemie Pvt. Ltd., Mumbai. CuSO4.5H2O, hydrogen peroxide and tetra sodium pyrophosphate were procured from Rankem, India. L-Ascorbic acid, uric acid, dopamine and sodium nitrite were purchased from SRL, India and used without further purification. Glycerol was obtained from Fisher Scientific. Aqueous solutions were prepared using Millipore water (18 MΩ). Nitrogen saturated phosphate buffer solution (pH 7 PBS) of ionic strength, I = 0.1 mol L−1 was used as supporting electrolyte in this study.
Instrumentation
Cyclic voltammetric measurements were carried out with Auto Lab Potentiostat/Galvanostat 502 N Netherland. A three electrode setup involving either glassy carbon electrode (GCE) or its chemically modified electrode as a working electrode (5 mm diameter), Ag/AgCl as a reference electrode and platinum wire as a counter electrode was employed. The bioanalytical system (BAS, U.S.) polishing kit was used to polish the GCE surface. 5mm diameter GCE embedded rotating disk electrode (RDE, pine instruments) coated with BTAH-Cu2+ was also used to estimate the number of electrons involved during H2O2 reduction through Koutecky-Levich analysis.42 Quartz crystal microbalance (QCM) experiments were carried out using a gold coated quartz piezo electric crystal of geometric surface area of 0.38 cm2. Piezoelectric crystal was controlled using Auto Lab Potentiostat/Galvanostat 502 N Netherland. Single crystal XRD study (Bruker Apex II) was performed to understand the structure and lattice parameters of BTAH-Cu2+ MOF. Hitachi S4800 high resolution field emission scanning electron microscope instrument was employed to understand the morphology and elemental distribution of the samples. FT-IR and Raman spectroscopy (1064 nm) analysis were carried out using JASCO 4100 and BRUKER RFS 27, respectively. Sample mixed KBr pellet was used in the FT-IR and Raman spectroscopy. Powder X-ray diffraction (PXRD) was performed on the samples using Bruker 8 fitted with Cu Kα X-ray source at a continuous scan rate of 1° 2Θ/min and step size of 0.02° 2Θ.
Preparation of BTAH-Cu2+
An aqueous solution (1 mL) of CuSO4.5H2O (0.001 mol) was added to an ethanol solution (1 mL) of benzotriazole (0.002 mol). After stirring for 30 min. at 25°C, a blue solution was obtained, which was filtered and the filtrate was evaporated slowly for one week. Blue colored crystals of BTAH-Cu2+ was obtained. A single crystal was chosen for crystal structure analysis.
Preparation of MWCNTs modified electrodes
The surface of the GCE electrode was cleaned both by mechanically and electrochemically. GCE was polished with 0.5 μm alumina powder, followed by washing with Millipore water and sonicating for 5 min in water. Cyclic voltammograms (CVs) of the polished electrode are obtained in the potential window of −0.2 to 1 V vs. Ag/AgCl at a scan rate of 50 mV s−1 in pH 7 PBS. MWCNTs coated GCE was prepared by drop casting 5 μL of colloidal dispersion containing 2 mg MWCNTs in 500 μL ethanol, followed by air drying for 3 min at 25°C.43–45 Thus obtained GCE/MWCNTs electrode was immersed for 1000 seconds in a PBS solution containing 3 mM of BTAH-Cu2+, for adsorbing the BTAH-Cu2+ on to the surface of the MWCNTs, to afford a surface modified electrode, GCE/MWCNTs@BTAH-Cu2+. To understand the redox activity of GCE/MWCNTs@BTAH-Cu2+ electrode, CV was done in pH 7 PBS, until a stable CV was realized, thereafter the electrode is ready for sensing the H2O2. Gold surface of the QCM crystal was coated with the 9.7 μL of colloidal dispersion of MWCNTs followed by air-drying, and is called as Au/MWCNTs electrode.
Sample preparation for the physical characterizations
For the FT-IR, Raman and SEM analyses, as prepared GCE/MWCNTs@BTAH-Cu2+electrode was dried in a vacuum desiccator for overnight. MWCNTs@BTAH-Cu2+ film on the modified GCE electrode carefully peeled off from the GCE surface using a doctor's syringe and examined further.
QCM experiments were performed to understand the amount of BTAH-Cu2+ adsorbed on the MWCNTs, as the frequency change of the quartz crystal is related to the mass change as per Sauerbrey equation (Equation 1).46
![Equation ([1])](https://content.cld.iop.org/journals/1945-7111/164/12/B591/revision1/d0001.gif)
Where A is the area of the gold coated quartz crystal (0.38 cm2), ρ is the density of the crystal (2.648 g cm−3), k is the shear modulus of the quartz AT-cut crystal (2.947 × 10¹¹ g cm−1 s−2), Δf is the measured frequency change, and f0 is the oscillation frequency of the crystal (8 MHz).
Computational methods
Theoretical calculations were performed at the B97D level of theory with the 6–31G(d) basis set by employing the Gaussian 09 suit.47 Furthermore the accuracy of B97D (D stands for dispersion) for describing the weak interactions has been recently established.48 On the basis of previous theoretical calculations and considering the computational cost, we used C54H18 as a model of graphene sheet to predict π-π interactions between BTAH and C54H18.
Results and Discussion
Crystal structure characterization
Single crystal XRD study of BTAH-Cu2+ reveals formation of monoclinic crystal, space group p 21/c1, with lattice parameters of a = 7.2927 4 Å, b = 19.7429 (14) Å, c = 19.2265 (12) Å, α = 90°, β = 97.054 3° and γ = 90°. Table I shows the detailed crystal structure data of the BTAH-Cu2+ [Cu(SO4)(H2O)(BTAH)3]. Fig. 1 shows the structure of BTAH-Cu2+ complex. Figs. 2a and 2b show the a-axis and c-axis view of the unit cell of the BTAH-Cu2+. The crystal contains 5-coordinated BTAH-Cu2+ molecules having a tetragonal pyramidal symmetry, wherein Cu2+ is co-ordinated to the N(1) nitrogen of three benzotriazoles, a sulfate and a water molecule. A BTAH molecule acts as a bridge between two BTAH-Cu2+ molecules. Fig. 2c shows the framework of the H-bonded network present in the crystal viewed along 'a' axis and hence BTAH-Cu2+ is a MOF. Crystal structure of the BTAH-Cu2+ framework is reported earlier.49
Table I. Crystal data for BTAH-Cu2+ complex.
| Chemical Formula | C24H22CuN12O5S |
|---|---|
| Formula weight | 654.13 g/mol |
| Crystal system | Monoclinic |
| Space group | P 21/c1 |
| Unit cell dimensions | a = 7.2927(4) Å |
| b = 19.7429(14) Å | |
| c = 19.2265(12) Å | |
| α = 90° | |
| β = 97.054(3)° | |
| γ = 90° | |
| Volume | 2747.3(3) Å3 |
| Z | 4 |
| Density (calculated) | 1.582 g/cm3 |
| Absorption coefficient | 0.932 mm−1 |
| F(000) | 1340 |

Figure 1. Structure of BTAH-Cu2+ complex.
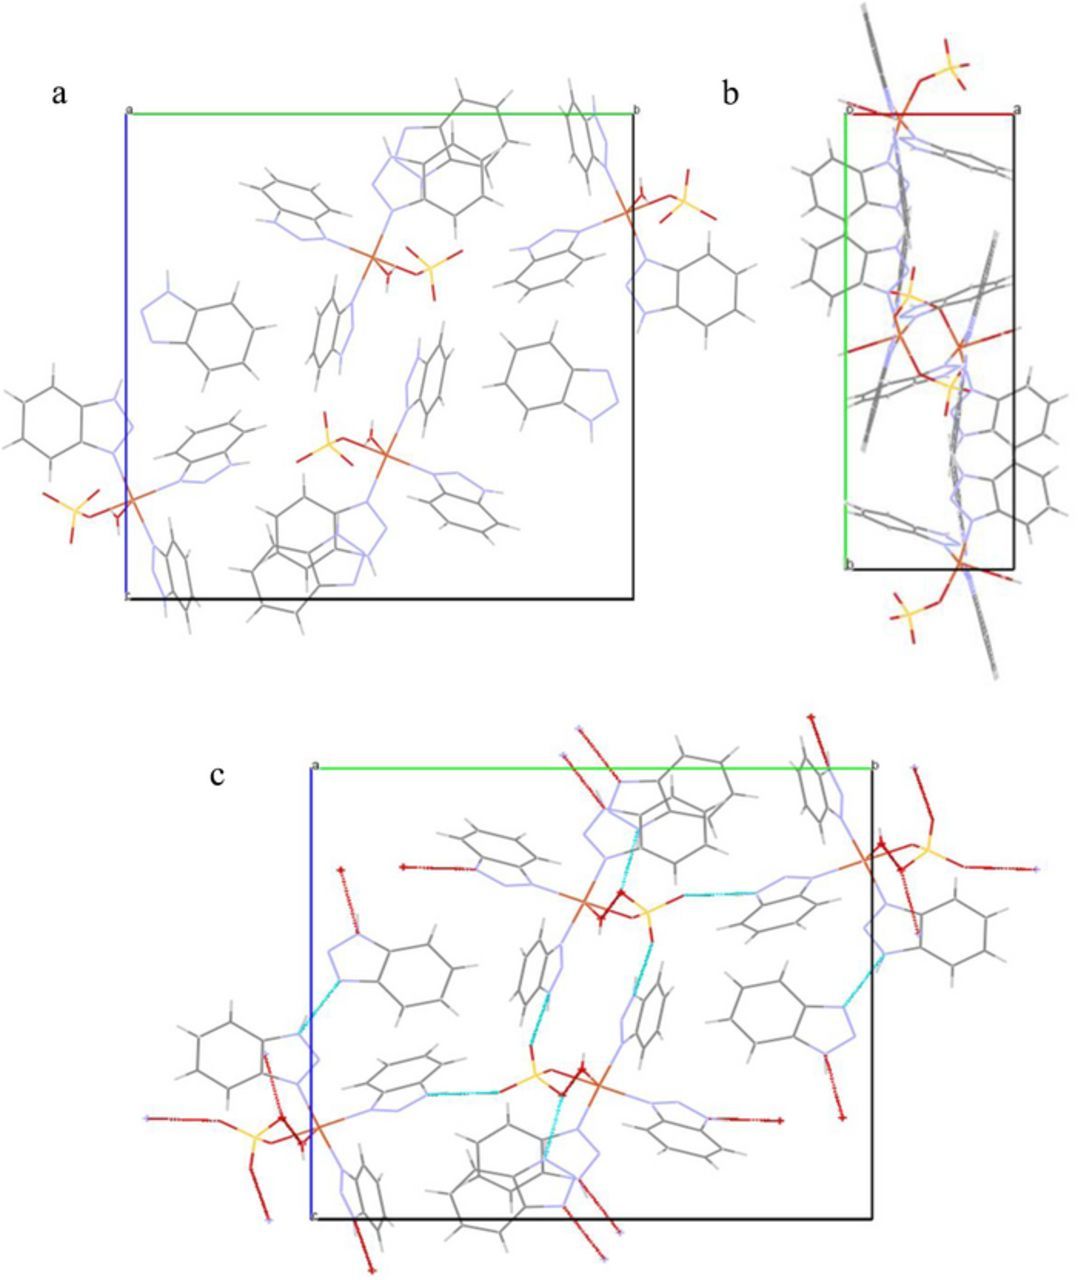
Figure 2. (a) a-axis view and (b) c-axis view and (c) a-axis view showing H-bonded network (cyan colored lines denotes H-bonding) of BTAH-Cu2+.
Electrochemical behavior of GCE/MWCNTs@BTAH-Cu2+
Fig. 3A shows the change in frequency of the QCM crystal as a function of time while the Au/MWCNTs was let immersed in PBS solution containing 3 mM of BTAH-Cu2+. At the end of 1000 seconds, a frequency change of 120 Hz was obtained, which corresponds to a mass change of 1.475 μg of BTAH-Cu2+ complex. This experiment confirms adsorption of BTAH-Cu2+ onto MWCNTs, possibly due to strong π-π stacking. After adsorbing the complex from the PBS on to the Au/MWCNTs, the electrode was cycled 40 times in deaerated PBS solution. The last 20 cycles are shown in Fig. 3B. As one can see, the voltamograms are stable and reproducible from the 20th cycle onwards (Fig. 3B). From the 40th cycle data, the area under the anodic and cathodic peaks were calculated to be 5.41 × 10⁻⁴ (±0.10) C cm−2 and 5.83 × 10⁻⁴ (±0.10) C cm−2 respectively. The areas under the peaks were nearly equal suggesting that the peaks were belonging to the same redox couple, Cu2+/Cu+. The steep reduction current observed at around −1.0 V vs Ag/AgCl is due to H2 evolution. From the area under the peaks, the amount Cu2+ present in the complex is estimated to be 2.299 × 10⁻⁹ moles (0.146 μg). Subtracting the mass of Cu, SO42− and H2O from the weight observed in the QCM measurement, the amount of BTAH calculated to be 9.285 × 10⁻⁹ moles (1.106 μg). The molar ratio of Cu2+ to the BTAH suggests that there are four BTAH ligands associated with one Cu2+. This result is in conformity with the single crystal data of BTAH-Cu2+.
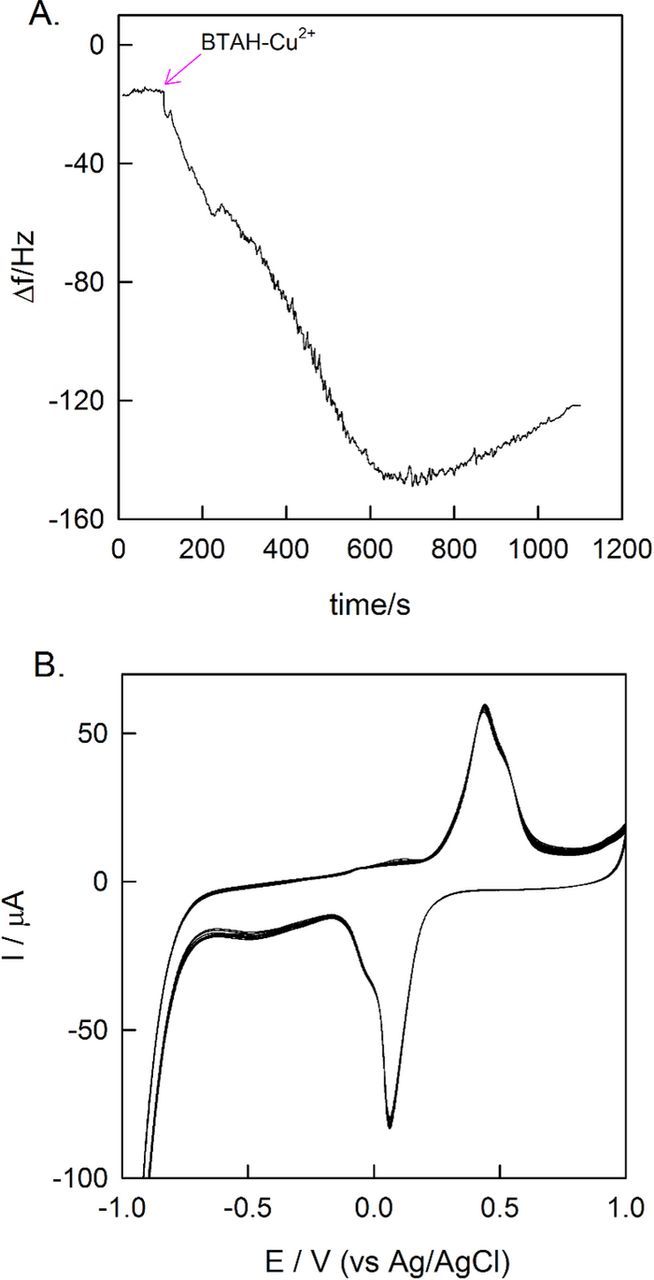
Figure 3. (A) QCM response (frequency change vs. time) for adsorption of BTAH-Cu2+on Au/MWCNTs (B) CV of Au/MWCNTs@BTAH-Cu2+ in pH 7 PBS measured at a scan rate of 50 mV s−1.
GCE@BTAH-Cu2+ electrode was prepared by dipping GCE for 1000 seconds in PBS containing 3 mM BTAH-Cu2+. CV of GCE@BTAH-Cu2+ is devoid of any redox signature in the potential range between −0.4 to 1.0 V vs. Ag/AgCl (Fig. 4A). Hence, presence of MWCNTs are essential for immobilizing the BTAH-Cu2+ in appreciable quantity. Reduction current observed below −0.4 V is due to H2 evolution originating from the electrolysis of water. CVs (20th-40th cycles) of GCE/MWCNTs@BTAH-Cu2+ shows a quasi-reversible redox peak due to Cu2+/Cu+ redox couple (Fig. 4B) with ΔEp (peak to peak separation) of −311 mV and E° value of −182 mV vs Ag/AgCl. E° value was obtained from the peak potentials of the cathodic (Epc) and anodic peaks (Epa) as shown in Equation 2.
![Equation ([2])](https://content.cld.iop.org/journals/1945-7111/164/12/B591/revision1/d0002.gif)
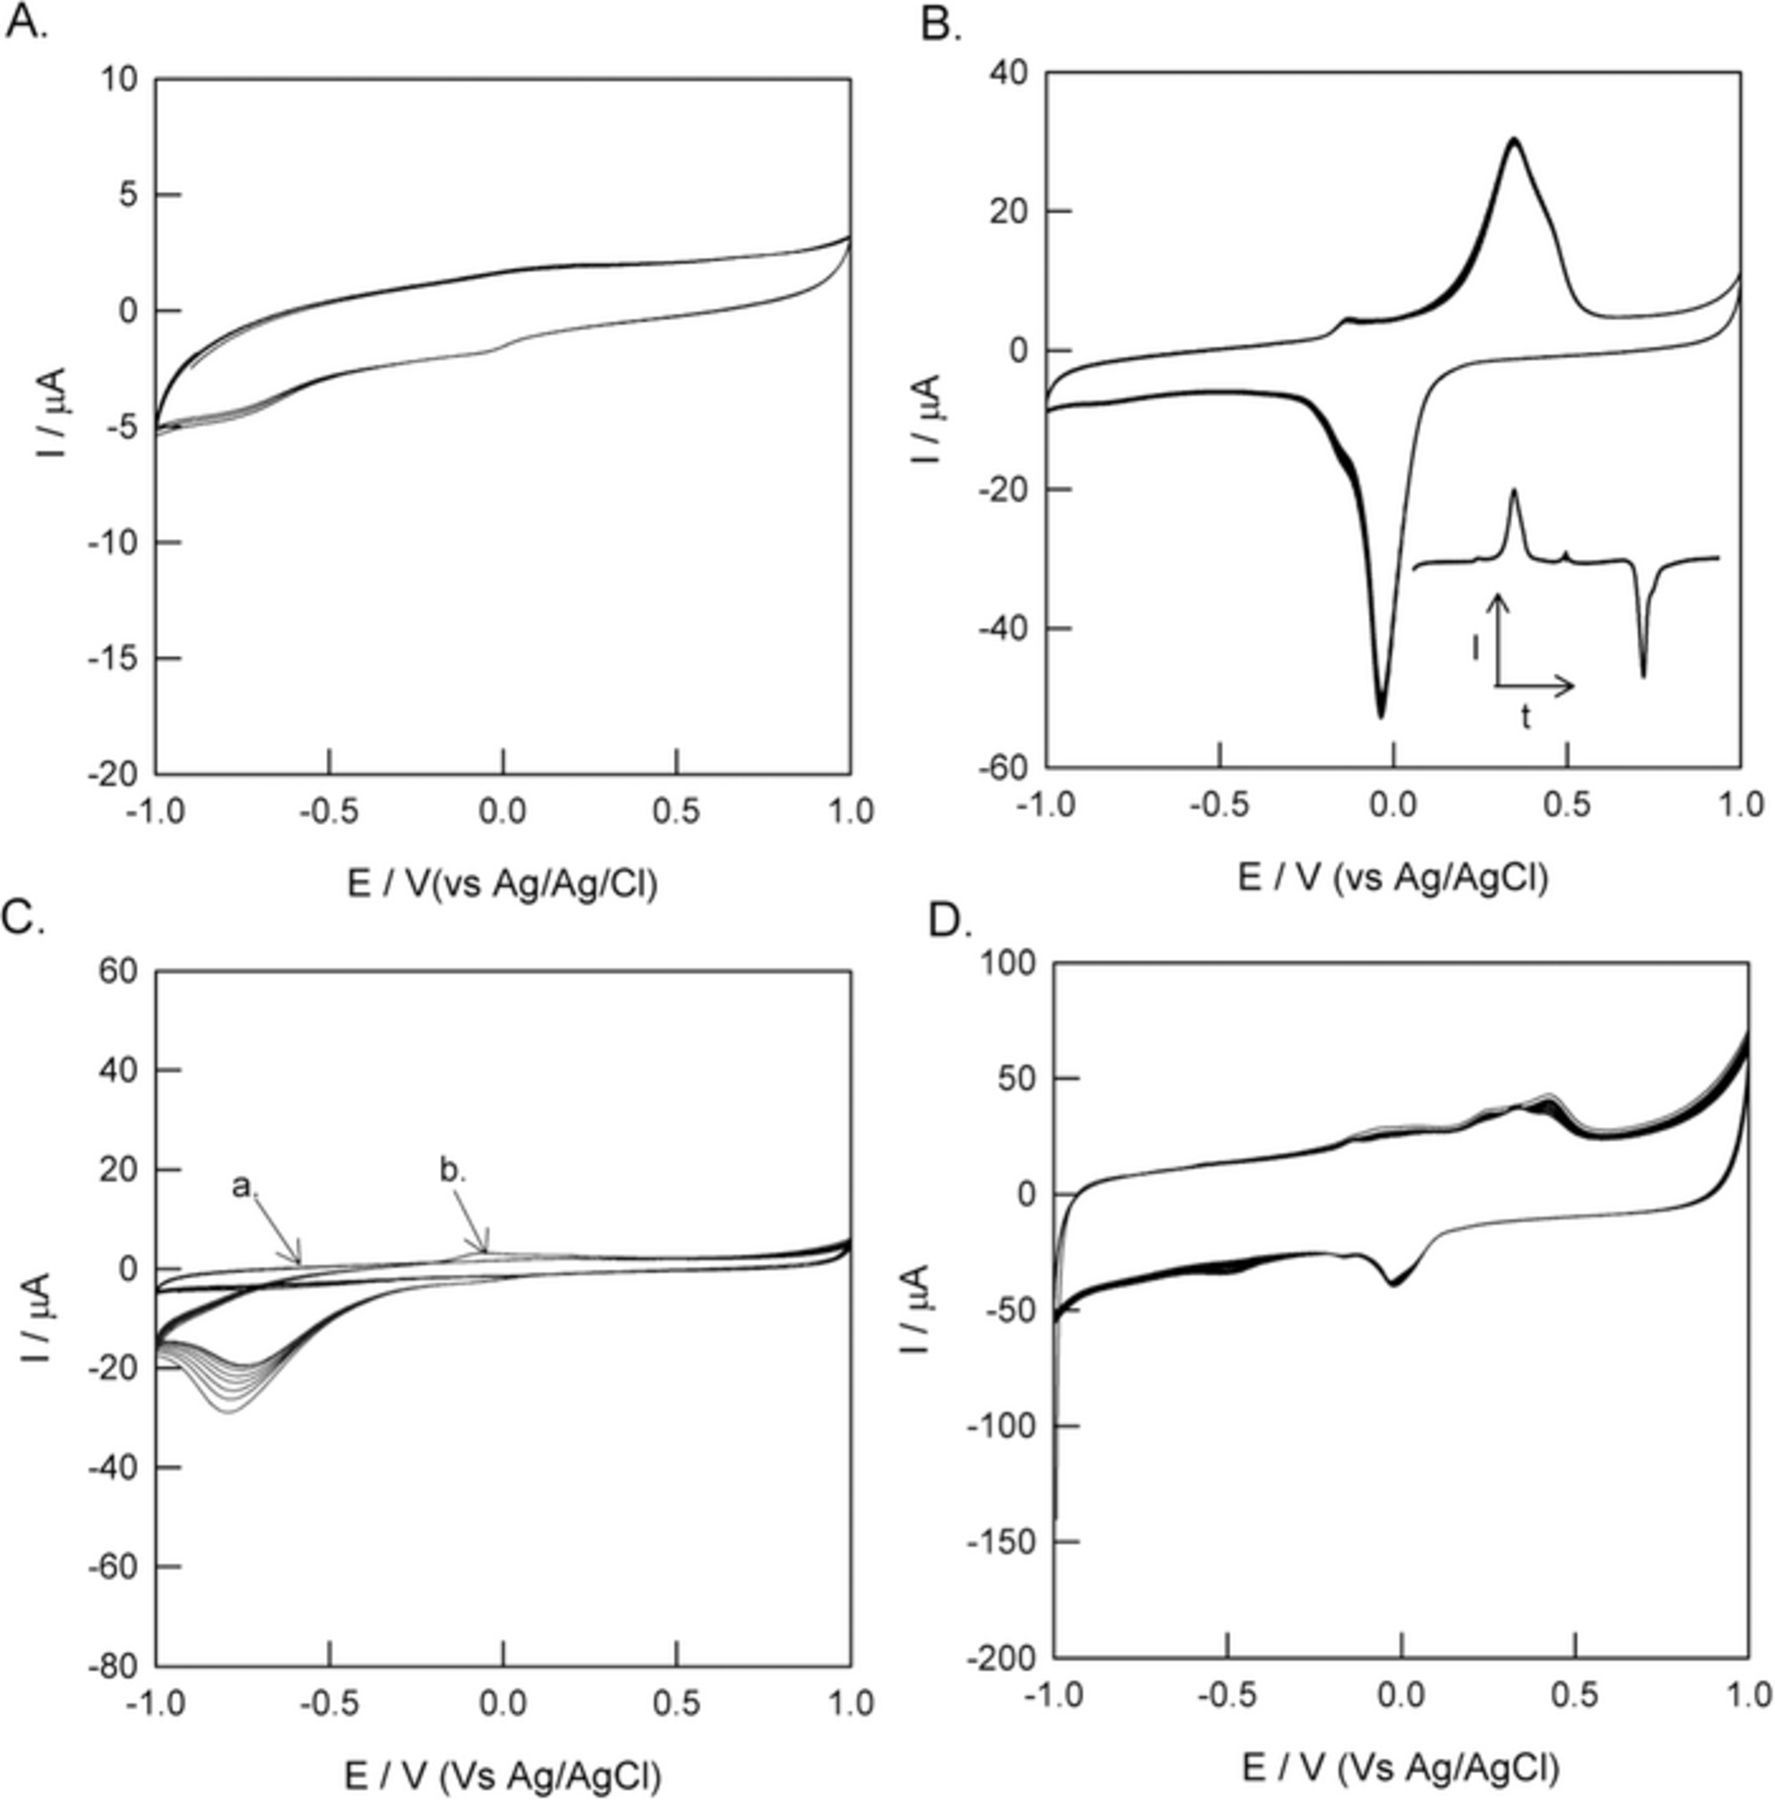
Figure 4. CV of (A) GCE/BTAH-Cu2+ (B) GCE/MWCNTs@BTAH-Cu2+. (C) GCE/MWCNTs@BTAH (curve a) and GCE/MWCNTs@Cu2+ (curve b) and (D) GCE/GC@BTAH-Cu2+. Condition employed: Medium = pH 7 PBS, scan rate = 50 mV s−1, temperature = 25°C. Inset to Figure B shows the base line corrected CV plotted as I vs time.
Integration of the anodic and cathodic peak applying the polynomial correction (5th order) to the baseline yielded charge values of 5.32 × 10⁻⁴ (±0.12) C cm−2 and 5.70 × 10⁻⁴(±0.13) C cm−2, respectively. Baseline corrected CV is shown as inset to Fig. 4B. As the loading of MWCNTs on the Au and GCE electrodes were same, the amount of charge density estimated from the peak area for Au/MWCNT@BTAH-Cu2+ and GCE/MWCNT@BTAH-Cu2+were same. This clearly indicates that the substrate used for this study (Au or GCE) do not have any influence on the amount of the BTAH-Cu2+ adsorbed on MWCNTs. Fig. 4C shows the CV of GCE/MWCNTs@Cu2+ and GCE/MWCNTs@BTAH controls. As one can see, there is no redox behavior in absence of either BTAH or Cu2+, indicating that the redox property exhibited in Fig. 4B is solely due to the BTAH-Cu2+ complex. The surface excess (Γ) calculated from the anodic peak area of the 40th cycle of CV shown in Fig. 2B is 5.52 × 10⁻⁹ mol cm−2 of Cu2+/Cu+-BTAH. The relative standard deviation (RSD) calculated from the 20th–40th CV is 2.7%, which is below the allowed limit of 5%. In order to confirm adsorption of complex by π-π interactions, we have explored the graphite (as it contains graphitic carbon) in place of MWCNTs and generated a GCE/GC@BTAH-Cu2+ electrode. It's CV in pH 7 PBS is shown in Fig. 4D. The calculated Γ value is (from the anodic peak area) 3.4 × 10⁻⁹ mol cm−2. Γ value of GCE/GC@BTAH-Cu2+ is about 1.6 times lesser than that of the GCE/MWCNTs@BTAH-Cu2+cogener. This indicates that, presence of π-π interaction between graphitic carbon containing materials (graphite and MWCNTs) and BTAH-Cu2+. Surface confined CV response of the adsorbed species is considered as a proof of π-π interaction in the literature.50
A linear increase in the peak currents (ipa/ipc) with the scan rate was observed (Figs. 5A and 5B) and it suggests presence of surface confined electron transfer reaction of Cu2+/Cu+ redox couple. Effect of solution pH (pH 3 to 11) on the peak potential of GCE/MWCNTs@BTAH-Cu2+ is shown in Fig. 5C. As BTAH-Cu2+ MOF is unstable in pH < 3 it is not explored at low pH solutions. A plot of Epc versus solution pH (Fig. 5C) shows a linear line with a slope of −54 mV pH−1 indicating a Nernstian type mechanism with the involvement of equal number of e− and H+ during the reduction of Cu2+ into Cu+. Similarly, with the plot obtained for anodic process between pH 7 and 11 a slope of −64 mV pH−1 was realized. However at pH < 7, the slope was about 21 mV pH−1 indicating a deviation from the Nernstian type mechanism. This could be the reason behind the quasi-reversible CV obtained for GCE/MWCNTs@BTAH-Cu2+ in pH 7 PBS. BTAH is a base, it can attract proton from the solution at its N(1) position, hence a proton and electron mediated Cu2+/Cu+ redox reaction is justifiable. The single crystal XRD study confirms the bonding between N(1) nitrogen and Cu2+, and hence N(1) nitrogen is the best electron donor among the three nitrogen's in BTAH.
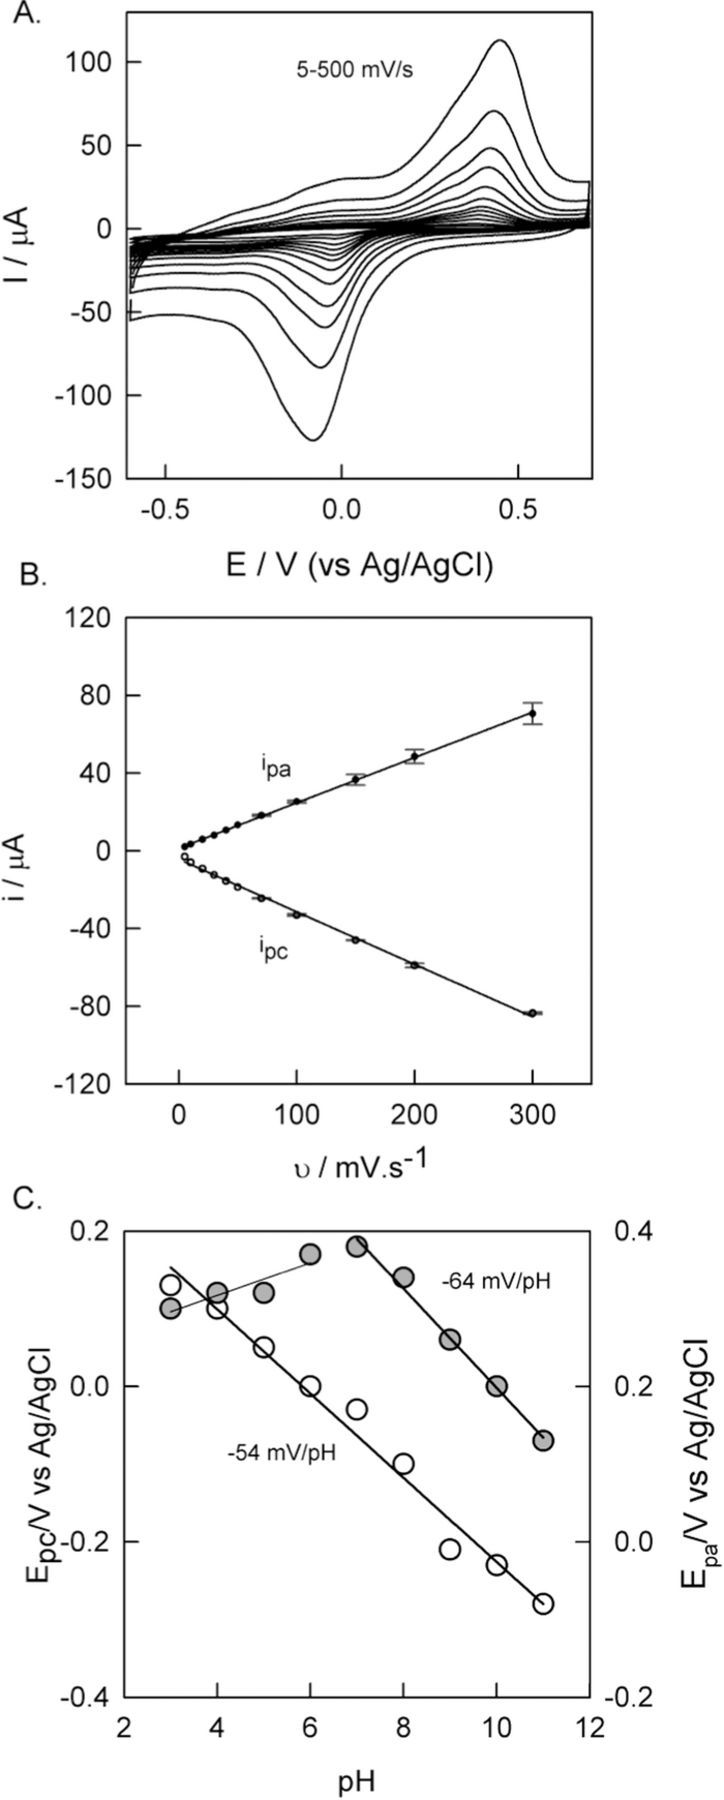
Figure 5. (A) Effect of scan rate (5–500 mV/s) on GCE/MWCNTs@BTAH-Cu2+ in pH 7 PBS. (B) Plot of scan rate vs peak current. (C) Plot of pH vs Epc and Epa.
Physicochemical characterizations of GCE/MWCNT@BTAH-Cu2+
Fig. 6 shows the PXRD pattern of graphite (curve a), graphite dipped in PBS (curve b) and graphite dipped in the BTAH-Cu2+ solution (GC/BTAH-Cu2+) (curve c). The peak at 2Θ value of 26.9° corresponds to (002) plane of graphite. The extra peaks in curve c at ∼7.56°, ∼19.83° and ∼31.52° are due to BTAH-Cu2+ complex adsorbed on graphitic carbon. Inset to Fig. 6c shows the indexed PXRD pattern of the BTAH-Cu2+ complex alone. The peaks observed in curve c are also present in the inset as well confirming the presence of BTAH-Cu2+ adsorbed on graphitic carbon in GC/BTAH-Cu2+.
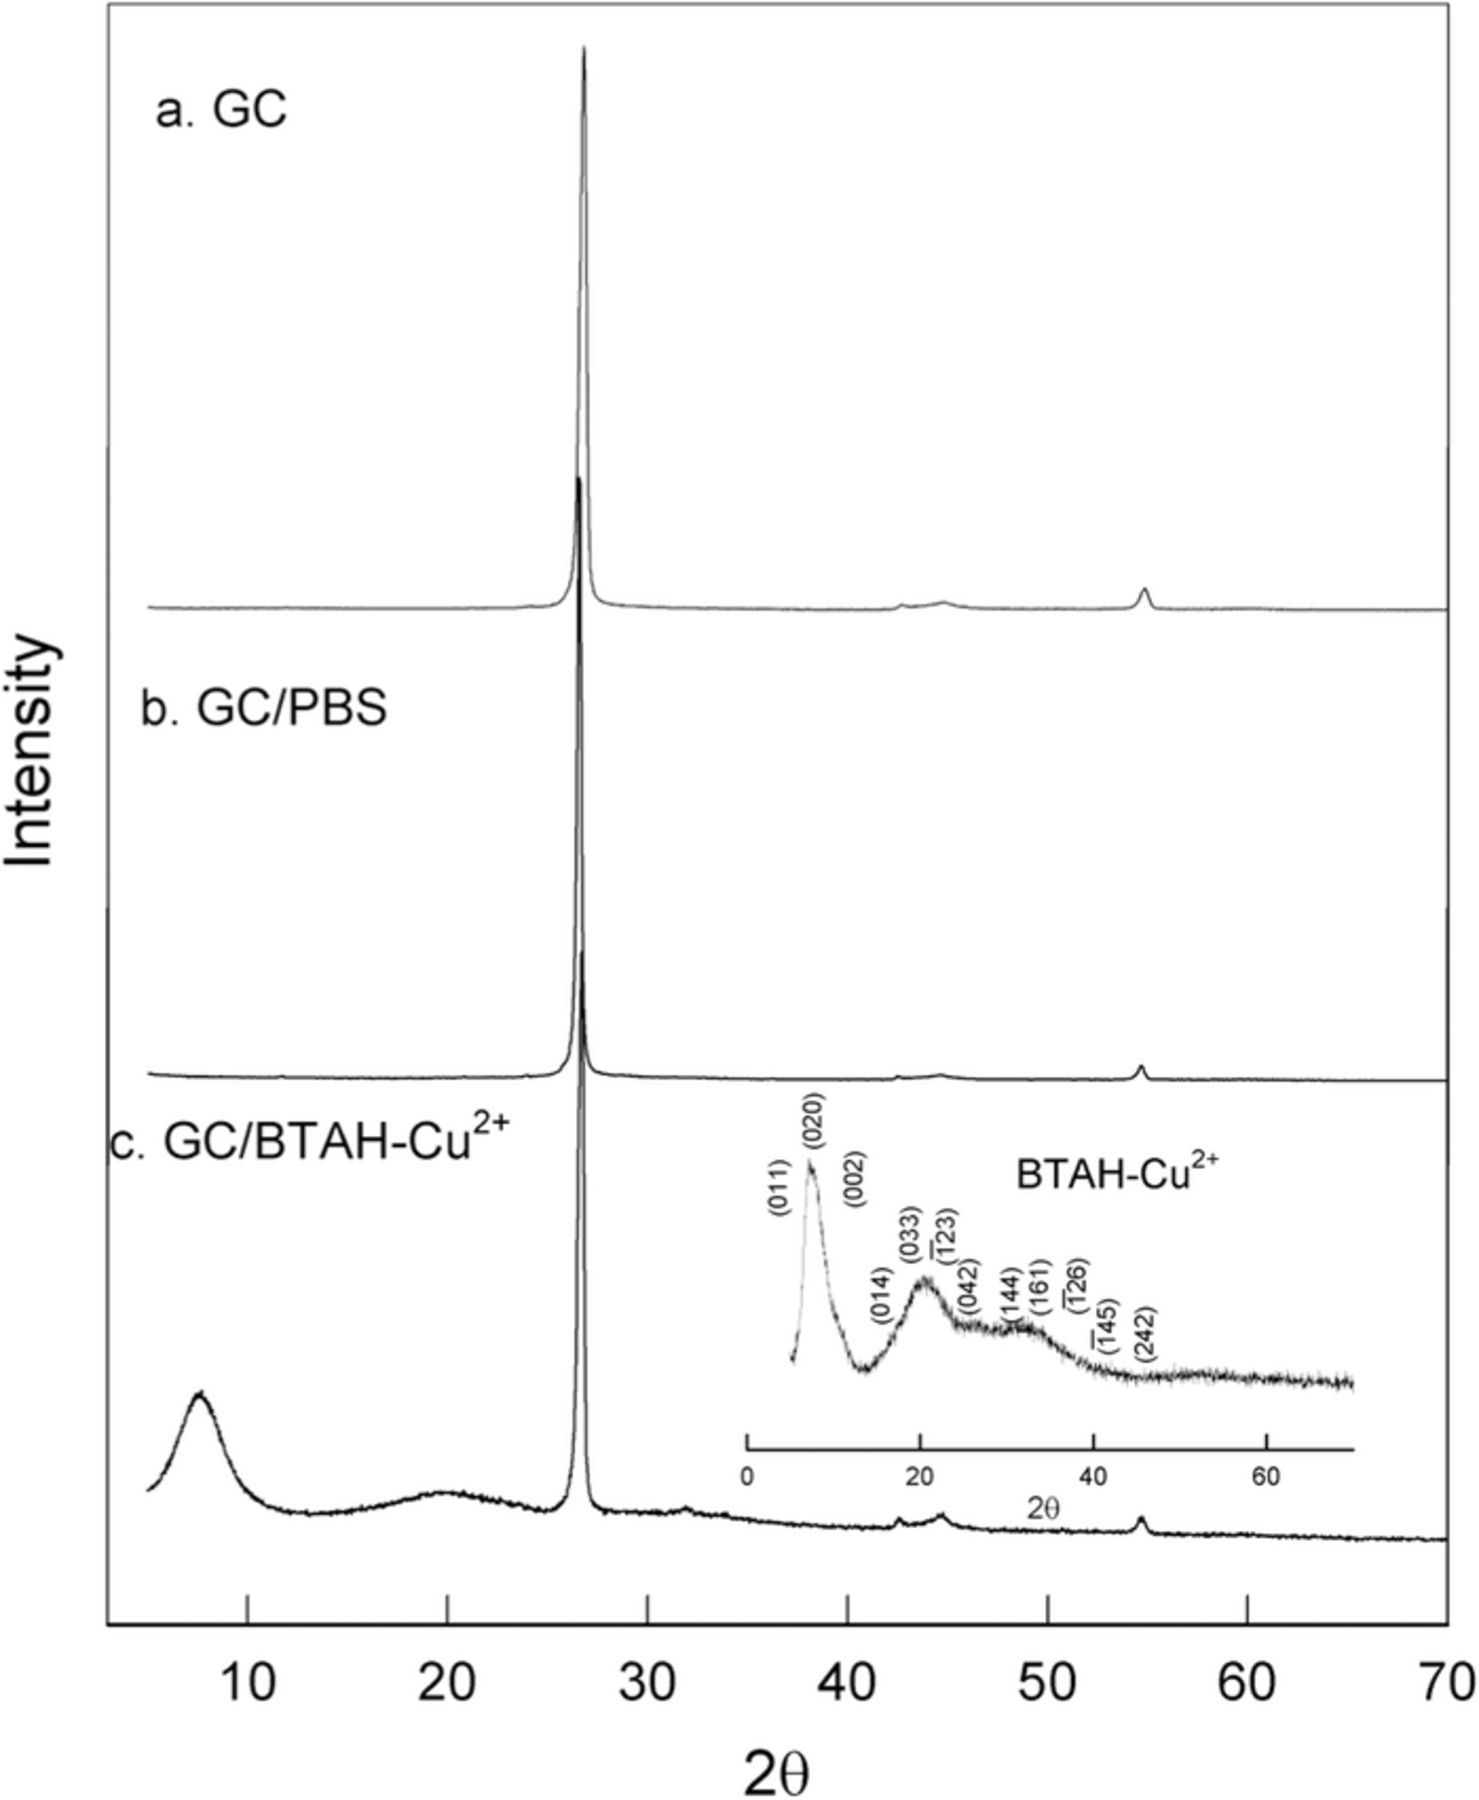
Figure 6. XRD results of (a) graphitic carbon (b) graphitic carbon treated with PBS and (c) graphitic carbon/BTAH-Cu2+ (inset figure BTAH-Cu2+).
SEM examined surface morphology of GCE/MWCNTs@BTAH-Cu2+ system. As can be seen in SEM micrographs, both MWCNTs and MWCNTs@BTAH-Cu2+ (which is scrapped from the GCE/MWCNTs@BTAH-Cu2+ electrode) shows tube like structures with diameter ranging between 91–180 nm (Figs. 7A and 7B). EDS mapping (Fig. 7C) of MWCNTs@BTAH-Cu2+ shows the elements N, S, O and Cu all over the sample, indicating adsorption of BTAH-Cu2+ complex on the MWCNTs. The Raman spectra of MWCNTs and MWCNTs@BTAH-Cu2+ show D (∼1330 cm−1) and G bands (∼1570 cm−1) due to sp3 and sp2 hybridized carbon respectively (Fig. 8).51 The intensity ratio of D and G bands (ID/IG) can be taken as a quantity of the disorder in the graphitic structure. ID/IG ratio of MWCNTs@BTAH-Cu2+ (1.02) was lower than that of the MWCNTs (1.39) as BTAH does not contain any sp3carbon leading to decrease in ID/IG ratio in MWCNTs/BTAH-Cu2+sample. CV, QCM, Raman and EDS analyses clearly confirm the π-π interaction between the BTAH-Cu2+ complex and MWCNTs leading to the adsorption of the former on MWCNTs. Geng et al. have modeled π-π interaction energies of indole (which contain NH group as in BTAH)-benzene complex, and found that the extension of aromaticity and the highly positive H atom of the N-H bond, both exhibited by Indole, enhance the strength of non-bonded interaction with benzene compared to those in the benzene dimer or in the pyridine-benzene complex.52
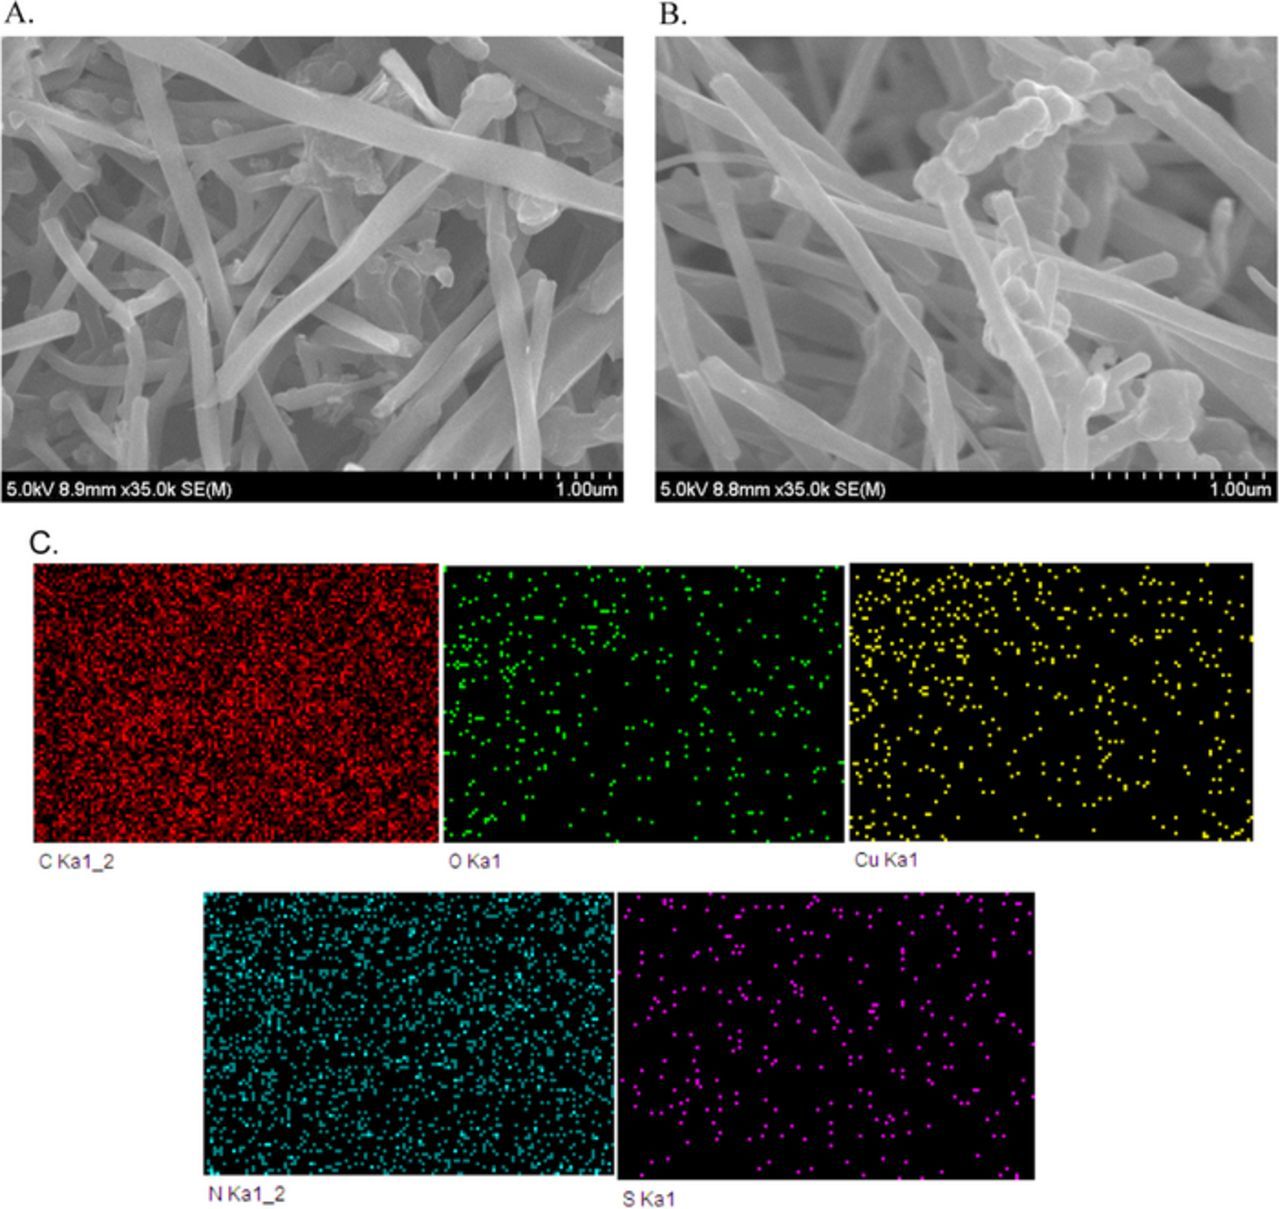
Figure 7. SEM images of (A) MWCNTs (B) BTAH-Cu2+ modified on MWCNTs. (C) EDS mapping of carbon, copper and nitrogen on BTAH-Cu2+ system.

Figure 8. Raman/KBr response of MWCNTs@BTAH-Cu2+.
The interaction energies between the graphene and the BTAH were calculated using the following Equation 3,50 wherein the energy was calculated using density functional theory (DFT).
![Equation ([3])](https://content.cld.iop.org/journals/1945-7111/164/12/B591/revision1/d0003.gif)
Where Ecomplex,  and EBTAH correspond to the energies of the optimized C54H18 (graphene analogue)-BTAH complex, C54H18 and BTAH respectively.
The optimized geometry of the complex shows (Figs. 9A and 9B) that BTAH is at a vertical distance of 3.3 Å from the graphitic carbon analogue (C54H18). This distance is reasonable for the π-π stacking while comparing with previously reported distances of 3.0 to 3.6 Å for benzene derivatives and nucleobases adsorbed on graphene sheets.53–55 The calculated Eint value is −18.76 kcal mol−1, indicating π- π interaction. The predicted binding energy for benzene and naphthalene on graphene is −11.4 kcal mol−153 and −17.6 kcal mol−1,53 respectively. For nucleobases the value ranges from −16 to −25 kcal mol−1.54,55 Possibly nitrogen atoms of the BTAH ring are as well contributing to the π-π interactions due to their close proximity (in comparison to carbon) towards graphene sheet.

Figure 9. The ground state optimized geometry of BTAH stacked graphene sheet.
FT-IR spectra of MWCNTs@BTAH-Cu2+ and the controls (MWCNT, BTAH, BTAH-Cu2+ and MWCNTs@BTAH) are given in Fig. 10A. Fig. 10B shows the lower frequency range of FT-IR spectra. MWCNT shows –O-H, C=C and C-H stretching peak at 3500, 2878 and 1597 cm−1 respectively. At low frequency region, low intensity peaks were observed which are possibly due to the radial breathing modes originating from the narrow inner most tubes of MWCNTs.56 BTAH shows C-H and N-H stretching peaks between 2700–3500 cm−1, C=C stretching at 1620 cm−1 and N=N stretching at 1600 cm−1. The peak at around 1200 cm−1 is due to C-N stretching frequency. The peak at 750 cm−1 possibly due to out of plane =C-H bending.57 MWCNTs@BTAH, shows peak due to N=N stretching at 1621 cm−1 and N-H stretching peak at 3436 cm−1 which is overlapping with the O-H stretching observed with MWCNTs. FT-IR of MWCNTs@BTAH-Cu2+ shows a downshift in the N=N frequency from 1621 to 1518 cm−1 possibly due to BTAH N(1) nitrogen coordinated with Cu2+. In addition, the Cu-N stretching frequency is clearly seen at around 440 cm−1 confirming the interaction between BTAH and Cu2+ (Fig. 10B).58

Figure 10. (A and B) FTIR/KBr response of MWCNTs@BTAH-Cu2+ and its control systems.
H2O2 sensing on GCE/MWCNTs@BTAH-Cu2+
Electrocatalytic activity of GCE/MWCNTs@BTAH-Cu2+ was examined with 500 μM H2O2 in pH 7 PBS. Fig. 11A shows the CV responses of GCE/MWCNTs@BTAH-Cu2+ in absence (curve a, N2 gas purged) and presence of H2O2 (curve b) measured at a scan rate of 10 mV s−1. Curve a shows the quasi reversible redox couple pertain to the BTAH-Cu2+ complex. Curve b, shows a huge cathodic peak with onset potential of 0.1 V vs Ag/AgCl corresponding to the H2O2 reduction. During the anodic scan, at around 0.4 V a sudden increase in current observed due to oxidation of H2O2. GCE/MWCNTs@Cu2+ (curve c) and GCE/BTAH-Cu2+ (curve d) show H2O2 reduction peak at a higher over potential than GCE/MWCNTs@BTAH-Cu2+. In case of GCE/MWCNTs@BTAH-Cu2+, BTAH-Cu2+ complex mediated the H2O2 reduction effectively at a lower overpotential than controls (GCE/BTAH-Cu2+ and GCE/MWCNT@Cu2+). MWCNTs provide the required surface area to adsorb BTAH-Cu2+ and electrical conductivity to the electrode. Ten repetitive measurement with H2O2, resulted in a relative standard deviation (RSD) of 3.01%, which indicated the good stability of GCE/MWCNTs@BTAH-Cu2+ towards H2O2 reduction reaction (data not shown).
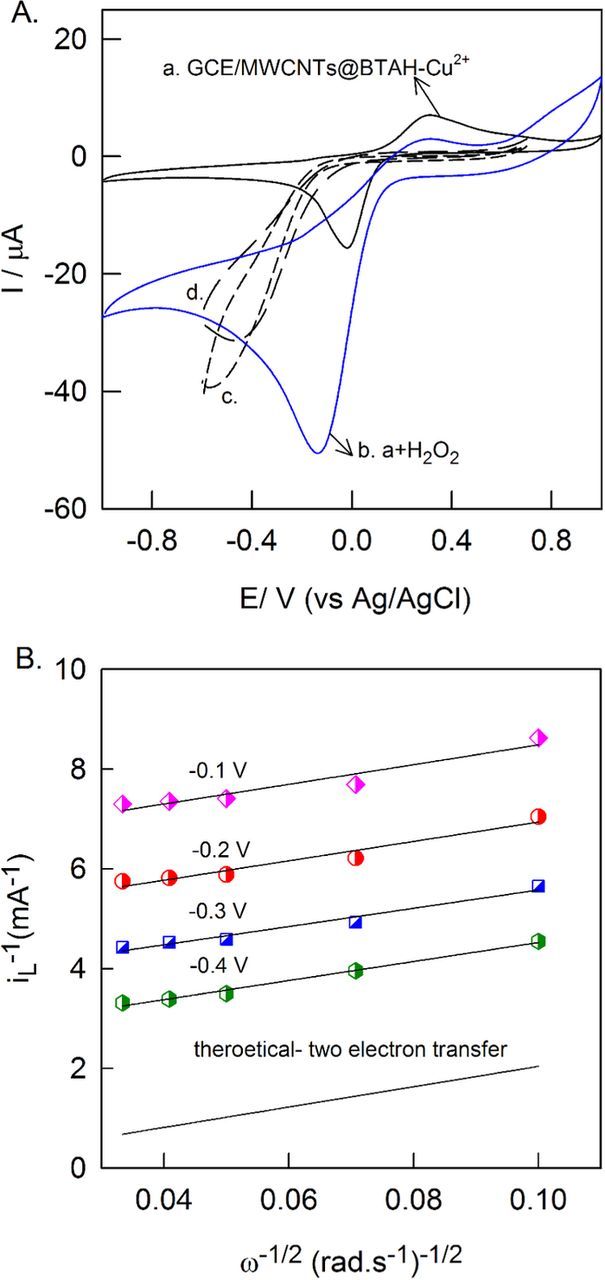
Figure 11. (A) CV responses of GCE/MWCNTs@BTAH-Cu2+ without (a) and with 500 μM H2O2 (b), GCE/MWCNTs@Cu2+(c) and GCE/BTAH-Cu2+(d) with 500 μM H2O2. Koutecky-Levich plots at different potential (−0.1 V, −0.2 V, −0.3 V and −0.4 V vs. Ag/AgCl) for H2O2 reduction reaction.
The electrocatalytic function of MWCNTs@BTAH-Cu2+ is further analysed using RDE technique, where a glassy carbon electrode of RDE was modified with MWCNTs@BTAH-Cu2+. Using the background corrected current responses obtained at −0.1, −0.2, −0.3 and −0.4 V. Koutecky-Levich analyses were performed in pH 7 PBS medium (Fig. 11B). Equations 4 and 5 show the Levich and Koutecky-Levich (KL) equations.
![Equation ([4])](https://content.cld.iop.org/journals/1945-7111/164/12/B591/revision1/d0004.gif)
![Equation ([5])](https://content.cld.iop.org/journals/1945-7111/164/12/B591/revision1/d0005.gif)
![Equation ([6])](https://content.cld.iop.org/journals/1945-7111/164/12/B591/revision1/d0006.gif)
Where i, ik and iL are the net current, kinetic current and mass transfer limited current respectively. ω = rotation per minute (RPM), Co* = H2O2 concentration, n = number of electron transferred during the analyte reduction, F = Faraday constant, A = Area surface of the electrode, D = diffusion coefficient (1.43 × 10⁻⁵ cm2 s−1)5,9 ν = kinematic viscosity (0.9 × 10⁻² cm2 s−1).59 The KL lines measured at −0.1 V, −0.2 V, −0.3 V and −0.4 V vs. Ag/AgCl were parallel to the theoretical 2e− KL line confirming 2e− reduction of H2O2 at these potentials. As these lines are parallel, the mechanism of H2O2 reduction on the electrode is same at these potentials. This result indicates that the overall electrocatalytic reduction of H2O2 follows two electron transfer process on GCE/MWCNTs@BTAH-Cu2+ modified electrode. The overall electrocatalytic reduction mechanism of H2O2 on BTAH-Cu2+ MOF is shown in Equation 7.
![Equation ([7])](https://content.cld.iop.org/journals/1945-7111/164/12/B591/revision1/d0007.gif)
Further, GCE/MWCNTs@BTAH-Cu2+ electrode was subjected to chronoamperometry sensing of continuous spiking of 20 μM of H2O2 at fixed potential of −0.1 V vs Ag/AgCl while stirring the solution at 200 rpm with rice pellet (Fig. 12A, curve a). A systematic increase in the current signals against H2O2 spikes were noticed. Whereas the BTAH free electrode (GCE/MWCNTs@Cu2+) (Fig. 12A, curve b) under the similar working condition showed tiny increment in current signals with the addition of H2O2. Constructed calibration plot (inset plot in Fig. 12A) for GCE/MWCNTs@BTAH-Cu2+ was linear in the concentration range 20–200 μM of H2O2 with regression coefficient and sensitivity values of 0.9971 and 0.03 μA μM−1 (0.153 A M−1 cm−2), respectively. The error bars are introduced using the responses from the three freshly prepared electrodes. The calculated detection limit (Signal to noise ratio = 3) is 3.3 μM. The obtained detection limit value is compared with other reported H2O2 sensors in pH 7 medium (Table II). Interference due to various chemicals such as ascorbic acid (AA), uric acid (UA), dopamine (DA), and nitrite (NO2−) was tested on the working electrode at a fixed potential of −0.1 V vs Ag/AgCl (Fig. 12B). Except DA, which showed weak current signal, no other chemicals interfere with the H2O2 sensing. These observations indicate the selective H2O2 sensing of GCE/MWCNTs@BTAH-Cu2+ system. Table II compares the applied potential, linear range, sensitivity and detection limit of various metal oxides and carbon based H2O2 sensors in pH 7 medium.41,60–68 Among these, GCE/MWCNTs@BTAH-Cu2+ is able to detect H2O2 with less over potential. The sensitivity and detection limit obtained are comparable to that of the reported systems. To demonstrate the suitability of our H2O2 sensor for commercial samples, we have tested the sensor in the solution made from Natures' fruit bleach (Fig. 12C) and developer milk of new Garnier color natural cream (Fig. 12D). These cosmetic samples obtained from local super market and they were subjected to the real sample analysis by standard addition approach method. 1g of the cosmetic sample was mixed with 10 mL of pH 7 PBS under sonication and the filterate was used for the analysis. Real sample analyses were carried out using chronoamperometry method with 50 μL spikes of the analyte (first spike by commercial sample in PBS and subsequent spikes by 50 μmoles of H2O2) in to the 10 mL electrochemical bath. The original detected values of H2O2 are 24.7 μM and 15.38 μM in the Nature's fruit bleach and Garnier color natural respectively. The calculated recovery values are nearly equal to 105 and 102% for Nature's fruit bleach and Garnier color natural respectively, which indicates the high sensitivity and selectivity towards H2O2 while using GCE/MWCNTs@BTAH-Cu2+ as sensor. This electrode shows appreciable analytical performance. Table III shows the detailed information about the H2O2 detection in real sample analysis. As Nature's fruit bleach contain grape seed oil, its interference during H2O2 sensing is tested adding 50 μL of grape seed oil (Fig. 12E) and found that it does not interfere with H2O2 sensing. Similarly, Garnier color natural cream contain glycerol, tetrasodium pyrophosphate, sodium stannate and phosphoric acid. The above chemicals were added (50 μL) to understand their interference and they did not interfere with H2O2 sensing. (Fig. 12F).
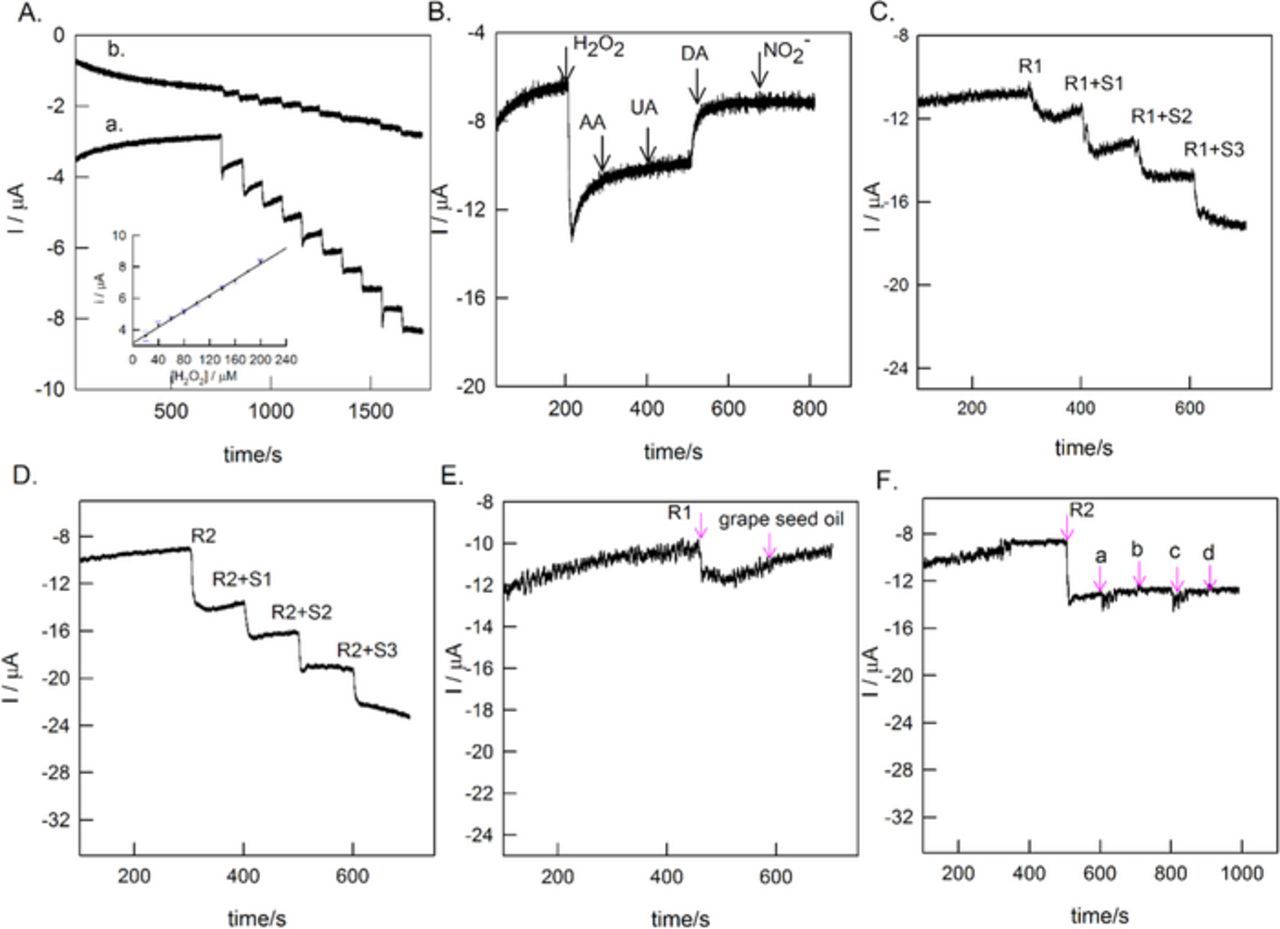
Figure 12. (A) Chronoamperometry responses of GCE/MWCNTs@BTAH-Cu2+ (a) and GCE/MWCNTs@Cu2+ (b) for continuous spikes of 20 μM H2O2. (Inset plot) Calibration plot of current vs [H2O2] for GCE/MWCNTs@BTAH-Cu2+ (B) Effect of interference of various biochemicals at H2O2 sensing conditions. Real sample analyses of H2O2 containing (C) Nature's fruit bleach (R1) and (D) Garnier color naturals cream (R2) by standard addition approach (R+S) on GCE/MWCNTs@BTAH-Cu2+. (Medium = pH 7 PBS. Applied potential = −0.1 V vs Ag/AgCl). (E and F) Interference effect of various chemicals present in the H2O2 real samples. (a - glycerol; b -tetrasodium pyrophosphate; c - sodium stannate; d - phosphoric acid).
Table II. Comparison of amperometric response performance of the GCE/MWCNTs@BTAH-Cu2+ with that of other H2O2 sensor in pH 7 medium.
| Applied potential | Sensitivity | Detection | |||
|---|---|---|---|---|---|
| Modified electrodes | (vs. Ag/AgCl) | Linear range | (A M−1cm−2) | limit (μM) | Ref. |
| GCE/Nf-MWCNT@bpy-Cu2+ | −0.2 V | 50 to 550 μM | 0.141 | 4.5 | 41 |
| HRP/MWCNTs/chitosan/GCE | −0.2 V | 16.7 to 740 μM | 0.07 | 10.6 | 60 |
| Amorphous ferricoxide/CPE | −0.2 V | 0 to 8.5 mM | — | 20 | 61 |
| Cu2O/GNs/GCE | −0.4 V | 0.3 to 7.8 mM | — | 20.8 | 62 |
| CuS nanoparticle/GCE | −0.65 V | 10 to 1900 μM | 0.890 | 1.1 | 63 |
| ZnO-GNPs-Nf-HRP/GCE | −0.3 V | 15 to 1100 μM | — | 9 | 64 |
| Hb/SA-MWCNTs/GCE | −0.4 V vs SCE | 40 to 200 μM | 0.224 | 16.4 | 65 |
| Ag nanoparticles/MWCNTs/GCE | −0.5 V | 0.1 to 10 mM | 9.79 × 10⁻⁵ | 2 | 66 |
| FeOOH@PDA-Ag nanocomposite/GCE | −0.2 V vs SCE | 0.007 to 18.8 mM | 0.011 | 2.5 | 67 |
| Co3O4nanowalls/GCE | −0.2 V | 0 to 5.35 mM | 0.080 | 10 | 68 |
| GCE/MWCNTs@BTAH-Cu2+ | −0.1 V | 20 to 200 μM | 0.153 | 3.3 | This work |
bpy – bipyridine, HRP - Horse radish peroxidase, CPE – carbon paste electrode, GNs – graphene, Nf – nafion, Hb – haemoglobin, SA – sodium alginate, PDA – polydopamine.
Table III. Results for the H2O2 detection in two different real cosmetic samples using GCE/MWCNTs@BTAH-Cu2+ modified electrode.
| Samples | ||
|---|---|---|
| Parameter | (Nature's fruit bleach) | (Garnier color natural) |
| Linear equation | Y = 0.460 + 0.038X | Y = 3.697 + 0.065X |
| Regression | 0.999 | 0.999 |
| Original/detected (μM) | 24.7 | 15.38 |
| Spiked (μM) | 50 | 50 |
| Detected (μM) | 52.8 | 51 |
| Recovery (%) | 105 | 102 |
| Net [H2O2] (mM) | 4.9 | 3.0 |
Conclusions
Single crystal XRD analysis confirmed the formation of BTAH-Cu2+ complex with three BTAH coordinated with Cu2+ and one BTAH acting as bridge between two molecules (via H-bonding) of [Cu(SO4)(H2O)(BTAH)3]. BTAH-Cu2+ anchored on MWCNTs modified electrode surface via π-π interaction was observed in pH 7 PBS solution. The structure of BTAH-Cu2+ is retained even after loading on MWCNTs by π-π interaction as confirmed by QCM study. Possible π-π interaction between BTAH and C54H18 is understood using DFT calculations. The GCE/MWCNTs@BTAH-Cu2+ showed well defined surface confined peak at −182 mV vs Ag/AgCl. Presence of BTAH-Cu2+ on the MWCNTs modified working electrode was confirmed by physicochemical characterizations such as SEM-EDS, Raman spectroscopy and FTIR spectroscopy. GCE/MWCNTs@BTAH-Cu2+ showed excellent electrocatalytic activity to H2O2 sensing at low potential of −0.1 V vs Ag/AgCl. The linear range, sensitivity and the detection limit of this sensor are 20–200 μM, 0.153 A M−1 cm−2 and 3.3 μM respectively. The developed modified electrode is used for detecting the H2O2 concentration in the real cosmetic samples with appreciable sensitivity and selectivity.
Acknowledgments
The author PG gratefully acknowledges Department of Science and Technology (DST) under the Science and Engineering Research Board (SERB) for the award of her National Post-Doctoral fellowship (PDF/2016/001222). Author PG thanks Sudip Mandal for helping with computational studies. High-performance computer center at IIT Madras is greatly acknowledged for computing facility and DST greatly acknowledged for funding (No. SB/FT/CS-171/2013).