Abstract
While the high capacity of silicon makes it an attractive negative electrode for Li-ion batteries, the associated large volume change results in fracture and capacity fade. Composite electrodes incorporating silicon have additional complexity, as active material is attached to surrounding material which must likewise experience significant volume change. In this paper, a finite-deformation model is used to explore, for the first time, mechanical interactions between a silicon particle undergoing lithium insertion, and attached binder material. Simulations employ an axisymmetric model system in which solutions vary in two spatial directions and shear stresses develop at interfaces between materials. The mechanical response of the amorphous active material is dependent on lithium concentration, and an equation of state incorporating reported volume expansion data is used. Simulations explore the influence of active material size and binder stiffness, and suggest delamination as an additional mode of material damage. Computed strain energies and von Mises equivalent stresses are in physically-relevant ranges, comparable to reported yield stresses and adhesion energies, and predicted trends are largely consistent with reported experimental results. It is hoped that insights from this work will support the design of more robust silicon composite electrodes.
Export citation and abstract BibTeX RIS

This is an open access article distributed under the terms of the Creative Commons Attribution 4.0 License (CC BY, http://creativecommons.org/licenses/by/4.0/), which permits unrestricted reuse of the work in any medium, provided the original work is properly cited.
Silicon is well-known1 for its high capacity for inserted lithium, making it a potentially attractive choice as the negative electrode active material in lithium-ion batteries. However, this high capacity is accompanied by large volume expansion, which is associated with particle cracking. This causes capacity loss through electrical isolation of active material and through exposure of new surface, which encourages continued solid-electrolyte interphase growth.
Moreover, many electrodes are porous composites, in which active material particles are attached to surrounding material, such as binder and conductive additives, or protective coatings as explored by other researchers.2–7 As the active material particles undergo large volume changes due to lithium insertion, the attached surrounding material must also deform, and may be damaged or separate from the active material particles as a consequence. This might be another cause of capacity loss through electrical isolation of active material. The influence of the binder material in silicon electrodes has been experimentally probed and has spurred a search for new materials,8–11 such as more resilient binders, binders with better adhesion strength, and conductive binders.
Estimation of stresses in these systems may help to guide the design of more physically robust electrodes. Most particle-level simulations coupling mechanical stress with diffusion of inserted lithium have focused on modeling stress development within isolated active material particles.12–17 Also focusing on active material behavior, detailed large-deformation models including plasticity18, 19 have been used to investigate silicon electrodes consisting of thin films on fixed substrates. Other studies have considered the mechanical role of binder in small-deformation systems involving multiple graphite20 or LiMn2O221 particles and binder connections. The present study is the first to model a silicon particle undergoing large deformation due to lithium insertion while attached to deformable binder material.
The goal of this work is to develop basic insight into the mechanical interactions between the expanding active material and the surrounding media in a composite electrode. The total change in active material volume, and therefore the magnitude of deformation experienced by the surrounding material, is primarily determined by the amount of inserted lithium. For this reason, the surrounding material experiences similar conditions during lithium insertion and extraction, so in the interest of clarity, only the former is discussed in this paper; future work will explore some of the nuances distinguishing lithium insertion and extraction. In the present work, simulations of lithium insertion that couple diffusion and mechanical stress are performed for simple cylindrical model systems consisting of attached binder and particle regions, over a range of particle sizes and binder stiffness values. The possibility of yielding in the active material and binder regions is considered through comparison of computed stresses with reported yield stresses. Additionally, solutions in these model systems vary in two directions; in contrast with one-dimensional particle models, this allows shearing stresses to develop at the interfaces between active material and binder regions. The possibility of delamination at these interfaces is then considered through comparison of computed strain energies with reported adhesion energies. Computed values are in a physically-relevant range, and observed trends are largely consistent with experimental reports.
Model
Porous electrodes typically consist of disordered arrangements of active material particles, polymer binder, conductive additive, and pore space. A model that captures all of this complexity would require large amounts of computing time and produce results that would be difficult to analyze. For these reasons, a simplified model system has been constructed in order to obtain basic insight into the mechanical interactions between active material and surrounding material. This system is meant to represent an active material particle with a composite of binder and conductive additive attached over part of its surface, and consists of a cylinder of active material sandwiched between two cylinders of composite, as shown in Figure 1. This cylindrical shape was chosen so that, unlike in one-dimensional spherical domains, shear stresses can develop at the interface between the composite and the active material regions. These shear stresses can lead to delamination of the composite from the active material.
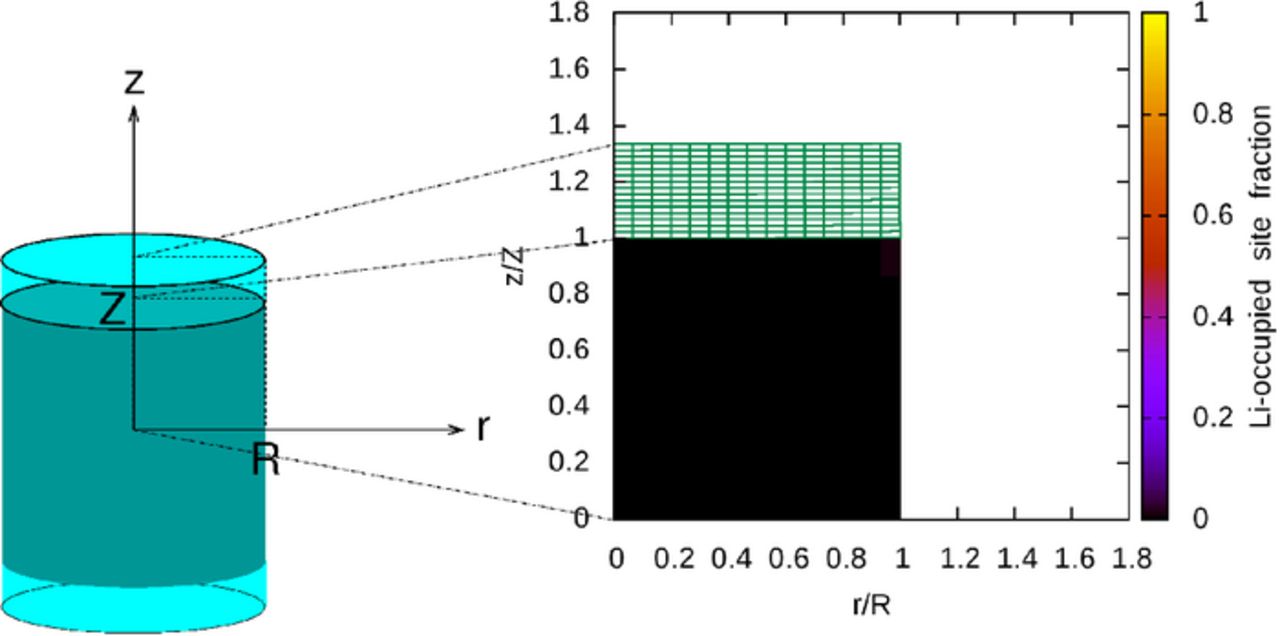
Figure 1. Example solution plotted over partial cross-section of system.
The mathematical description used in this work borrows from the large-deformation model developed by Christensen and Newman,13 in which the host material is assumed to consist of initially-unoccupied sites "S", which are transformed into occupied sites "LiS" as lithium is inserted. In the fully-saturated state, all sites are occupied. The inserted lithium is assumed to exert a thermodynamic pressure from within the host material, balancing some amount of elastic stress, to yield the total stress.
The active material is initially a cylinder with equal diameter and height, and the combined thickness of the binder layers surrounding the active material has been set at one-third of the active material height, a volume ratio meant to mimic that in a composite silicon electrode. This is an axisymmetric domain, and axisymmetric initial and boundary conditions are used, so solutions described in cylindrical coordinates will vary in two spatial directions. Additionally, there is a plane of symmetry through the center of the system, perpendicular to the axis of symmetry, so solution values on a rectangular partial cross-section of the system are sufficient to describe the solution throughout the entire system. This is illustrated in Figure 1, in which the initial fraction of lithium-occupied sites is shown in the active material region, and the binder region is drawn as a grid.
Porous silicon electrodes are typically constructed from crystalline silicon particles, in which long-range order is disrupted during initial cycling.22, 23 For simplicity, the active material in this model is assumed to be amorphous. While this avoids the complexity of transport and deformation in an initially crystalline silicon particle, this model cannot describe anisotropic behavior in the initial lithium insertion process. The binder is likewise assumed to be homogeneous and isotropic. Furthermore, both the active material and binder, as well as the attachment between the two, are assumed to remain undamaged throughout the simulations. Finally, the present authors do not know of models for the nonlinear mechanical responses of the binder and active material, including plasticity, which have been confirmed to be quantitatively correct. Therefore, this behavior has been neglected for simplicity; both materials are assumed to remain linearly elastic, with the mechanical properties of the active material dependent on composition. As real materials typically show a less-than-linear response to large strains, these linearly elastic models will tend to over-predict stresses and strain energies. The simulations then explore idealized cases that put upper bounds on these quantities.
In a large-deformation model, it is helpful to be explicit about how locations of material "particles" are referenced, as these locations vary over time as material deforms. Throughout this work,  will refer to the present (or "spatial" or "Eulerian") positions of material particles, while
  will refer to initial (or "material" or "Lagrangian") positions of the same particles. These symbols are also used as subscripts to the ∇ operator to indicate the variables with respect to which derivatives are taken. The governing equations are given in tensor form in the present section, most often in the spatial description, and the specialization to scalar equations for a cylindrical coordinate system is described in Appendix
Momentum equation in binder region
The binder region is discussed first, as its mechanical description is simpler than that of the active material. Inertia is expected to be negligible under typical battery cycling conditions, so the displacement in the binder region is then governed by the equation of mechanical equilibrium,
![Equation ([1])](https://content.cld.iop.org/journals/1945-7111/162/6/A1111/revision1/jes_162_6_A1111eqn1.jpg)
where  is the Cauchy stress tensor. The present authors do not know of a constitutive relation that has been shown to be quantitatively correct for typical binder materials, so it is assumed that the Cauchy stress tensor is given by Hooke's law of linear elasticity:
![Equation ([2])](https://content.cld.iop.org/journals/1945-7111/162/6/A1111/revision1/jes_162_6_A1111eqn2.jpg)
where Eb is Young's modulus, νb is Poisson's ratio, I is the identity tensor, and EA is Almansi's strain tensor. The latter may be computed from the deformation gradient F (see, for instance, Bertram24) as
![Equation ([3])](https://content.cld.iop.org/journals/1945-7111/162/6/A1111/revision1/jes_162_6_A1111eqn3.jpg)
where F can be calculated from the displacement field as
![Equation ([4])](https://content.cld.iop.org/journals/1945-7111/162/6/A1111/revision1/jes_162_6_A1111eqn4.jpg)
Momentum equation in active material region
The active material region is also under mechanical equilibrium. However, displacement in this region is influenced by the presence of inserted lithium. Following Christensen and Newman,13 the stress in the active material region is characterized by the total stress tensor T, which contains contributions from elastic stress and thermodynamic pressure. This is given by
![Equation ([5])](https://content.cld.iop.org/journals/1945-7111/162/6/A1111/revision1/jes_162_6_A1111eqn5.jpg)
where  is the (elastic) stress tensor in the active material, again computed by Hooke's law:
![Equation ([6])](https://content.cld.iop.org/journals/1945-7111/162/6/A1111/revision1/jes_162_6_A1111eqn6.jpg)
Here, Young's modulus Ea and Poisson's ratio νa are taken to be dependent on the local fraction of lithium-occupied sites, as described shortly. The symbol p represents the thermodynamic pressure exerted by the inserted lithium from within the host material matrix. As the lithium forms an alloy with the silicon, the strain is not indicative of the elongation of chemical bonds, and so it is the total stress, rather than the apparent elastic stress computed from the strain, that describes the true stress experienced by the active material.
Mechanical equilibrium in the active material is then described by an equation with the same form as the corresponding equation in the binder 1:
![Equation ([7])](https://content.cld.iop.org/journals/1945-7111/162/6/A1111/revision1/jes_162_6_A1111eqn7.jpg)
Dependence of alloy properties on site fraction
As in earlier continuum simulation work by others,25 the values of Young's modulus Ea and Poisson's ratio νa in the active material region are dependent upon lithium concentration. This dependence is taken from fits to the Young's modulus and Poisson's ratio of amorphous LixSi, as reported by Shenoy et al.:26
![Equation ([8])](https://content.cld.iop.org/journals/1945-7111/162/6/A1111/revision1/jes_162_6_A1111eqn8.jpg)
![Equation ([9])](https://content.cld.iop.org/journals/1945-7111/162/6/A1111/revision1/jes_162_6_A1111eqn9.jpg)
where x is the number of lithium atoms per silicon atom in the alloy, and Ea is given in units of GPa.
However, as described earlier, the present model involves only two species, LiS and S. The site fraction  , the number of lithium-occupied sites divided by the total number of sites, is used as a solution field variable, so it is necessary to convert from x to
  in these fits. As Li15Si4 has been taken as the state of maximum lithium saturation, each silicon atom is associated with 15/4 sites. In a region corresponding to an initial volume of interest, the total number of sites is fixed by the number of silicon atoms, and the number of lithium-occupied sites is the number of lithium atoms in the region. Therefore,
![Equation ([10])](https://content.cld.iop.org/journals/1945-7111/162/6/A1111/revision1/jes_162_6_A1111eqn10.jpg)
where nX is the number of moles of species X in the region under consideration. With this, the fits may be rewritten as
![Equation ([11])](https://content.cld.iop.org/journals/1945-7111/162/6/A1111/revision1/jes_162_6_A1111eqn11.jpg)
![Equation ([12])](https://content.cld.iop.org/journals/1945-7111/162/6/A1111/revision1/jes_162_6_A1111eqn12.jpg)
Equation of state
Lithium insertion in the active material causes volume change. Following the model of Christensen and Newman,13 it is assumed that the inserted lithium exerts a pressure p from within the active material. As described in Appendix
![Equation ([13])](https://content.cld.iop.org/journals/1945-7111/162/6/A1111/revision1/jes_162_6_A1111eqn13.jpg)
Here,
![Equation ([14])](https://content.cld.iop.org/journals/1945-7111/162/6/A1111/revision1/jes_162_6_A1111eqn14.jpg)
is the ratio of initial to present densities (of sites, for instance), and the constants v0 = 10.96 ml/mol and k = 9.00 ml/mol characterize the linear fit given by Obrovac et al.27
Lithium transport
Having addressed the mechanical influence of inserted lithium, the equations governing the movement of lithium in the active material region will now be discussed. The continuity equation in the material description28 is used directly to describe the conservation of occupied sites LiS:
![Equation ([15])](https://content.cld.iop.org/journals/1945-7111/162/6/A1111/revision1/jes_162_6_A1111eqn15.jpg)
A similar expression can be written for the unoccupied sites S, but this is unnecessary. In the material description, concentrations are taken with respect to initial volumes. In this model, there are a fixed number of host sites, and they are occupied or unoccupied. Therefore, the total concentration with respect to initial volumes, cL, is fixed, and
![Equation ([16])](https://content.cld.iop.org/journals/1945-7111/162/6/A1111/revision1/jes_162_6_A1111eqn16.jpg)
so it is only necessary to solve the continuity equation for one species. The above equation containing the time derivative of  will be used.
The lithium flux vector in the spatial description,  , is given by Christensen and Newman,13 and includes contributions from both the concentration gradient and the thermodynamic pressure. Its transformation into
  is described in Appendix
Momentum boundary conditions
To roughly express the idea that there is significant pore space available for particle expansion in typical silicon porous electrodes, the exposed surfaces of the particle and binder are taken to be stress-free:
![Equation ([17])](https://content.cld.iop.org/journals/1945-7111/162/6/A1111/revision1/jes_162_6_A1111eqn17.jpg)
where  is the normal vector on the exposed surface.
At the interface between the particle and binder, the displacements are identical on either side because the interface is assumed to remain undamaged, and as the adjacent regions are in mechanical equilibrium, the stress vector on the binder surface at any given interface location is the negative of the stress vector on the active material surface at the same location on the interface:
![Equation ([18])](https://content.cld.iop.org/journals/1945-7111/162/6/A1111/revision1/jes_162_6_A1111eqn18.jpg)
where  is the outward-pointing normal vector for the corresponding region.
Finally, the configuration of the model particle-binder system suggests that the tangential stress components along the axis and plane of symmetry must be zero.
Mass transfer boundary conditions
The simulations are performed at constant current, so the total rate of lithium insertion is constant, although the current density at the active material surface varies due to particle expansion. Also, by symmetry, there is no lithium flux across the axis or plane of symmetry in the model system.
The binder is typically somewhat permeable to the electrolyte, so for simplicity it is assumed that the lithium flux is uniform over the boundary of the active material, with respect to the present, deformed configuration, even at the active material/binder interface. Let Q be the total rate of lithium insertion, and let A be the total surface area of the active material particle in the present configuration. Since the current density is assumed to be independent of position, the flux vector is taken to be:
![Equation ([19])](https://content.cld.iop.org/journals/1945-7111/162/6/A1111/revision1/jes_162_6_A1111eqn19.jpg)
where  is the outward-pointing normal vector on the active material surface.
Numerical implementation
Although most of the preceding equations were presented in the spatial description, it is more convenient to implement them in the material description. Appendix
In the finite-volume method, the spatial domain is divided into a number of smaller volumes, each of which is associated with a single value for each dependent variable. In this axisymmetric system, the solution varies in two spatial dimensions, so the spatial domain is represented by a rectangular cross-section. The smaller volumes within this domain are also represented by rectangular regions, obtained by dividing the active material and binder regions into separate rectangular grids. Simulations with attached binder regions produce solutions with rapid spatial variations near the particle-binder interface; in order to obtain an acceptable level of spatial detail in these regions within reasonable computing time, grid lines were positioned according to a quadratic function, with the spacing between grid lines decreasing toward the interface between the binder and active material, and toward the curved outer surface of the initially cylindrical system. Finally, as another compromise between accuracy and computational cost, the timestep size was chosen so that the amount of lithium inserted in 1600 timesteps would fully saturate the active material.
A number of parameter values were taken from the literature for use in the simulations. References were selected based on apparent relevance of experimental setups to the modeled systems. Where experimental data was unavailable, reported results from first-principles simulations were incorporated. The selected parameter values are listed in Table I. In particular, although active material particles are surrounded by a porous matrix of binder and conductive material in reality, the binder region in most of these simulations is simply given the mechanical properties of pure poly(vinylidene fluoride) (PVDF). While PVDF is not commonly used as a silicon electrode binder, it is frequently used in commercial electrodes and its mechanical properties are widely reported in the literature, making it a useful point of reference for developing intuition.
Table I. Simulation parameter values.
| Parameter | Value | Reference |
|---|---|---|
| Diffusion coefficient |  | 44 |
| Partial molar volume, Li in Si | function | 27 |
Poisson's ratio,  | function | 26 |
| Poisson's ratio, PVDF | 0.33 (averaged) | 36 |
| Temperature | 298.15 K | N/A |
| ω = (Vfinal − Vinitial)/Vinitial | 3.08 (approx) | 27 |
Young's modulus,  | function | 26 |
| Young's modulus, PVDF | 2.6 GPa (averaged) | 36 |
Results and Discussion
Influence of binder region
In order to provide context for understanding the influence of binder attachment, active material particles without attached binder regions are examined first. Figures 2a and 2b are visualizations showing the effect of particle size on lithium distribution and particle deformation, for relatively small and relatively large particles, at the end lithium insertion; simulations are halted when the site fraction of species LiS reaches 1, to within the tolerance determined by numerical timestep size and local lithium insertion rate. In these simulations, this occurs when the active material surface is saturated with lithium, corresponding to a potential of 0 V with respect to lithium. The boundary conditions are identical to those given earlier, except that there is no stress anywhere on the active material surface. In these visualizations, distances along the r-axis are scaled by the initial cylinder radius R and distances along the z-axis are scaled by the initial active material half-height Z, and in the results presented here, R and Z are both equal to half of the particle "size" listed above the figures. The initial active material surface is shown by the gray outlines in Figures 2a and 2b, so it is evident that lithium insertion causes significant expansion of the active material. For small particles, like that shown in Figure 2a, diffusion maintains a very uniform distribution of lithium despite lithium flux at the surface, leading to very uniform material displacement. Or viewed from a different perspective, a slow lithium insertion rate allows diffusion to keep concentration gradients small. The uniform distribution of lithium in this small particle allows the simulation to approach 100% state of charge (SOC); Figure 2a suggests that the cylinder radius has increased to nearly 1.6R, and that the half-height has increased to nearly 1.6Z, which suggests that the volume has increased to nearly 4.1 times the original volume. This is consistent with the value of ω used in the simulation, which suggests an expansion to 4.08 times the original volume. In contrast, for large particles, or particles undergoing a fast rate of lithium insertion, the lithium distribution and material displacement are much less uniform, as shown in Figure 2b, causing the simulation to terminate at a much lower SOC. In particular, the upper-right region of the plot, corresponding to an edge of the cylinder, receives lithium through two nearby surfaces and therefore exhibits a high lithium concentration and large displacement.
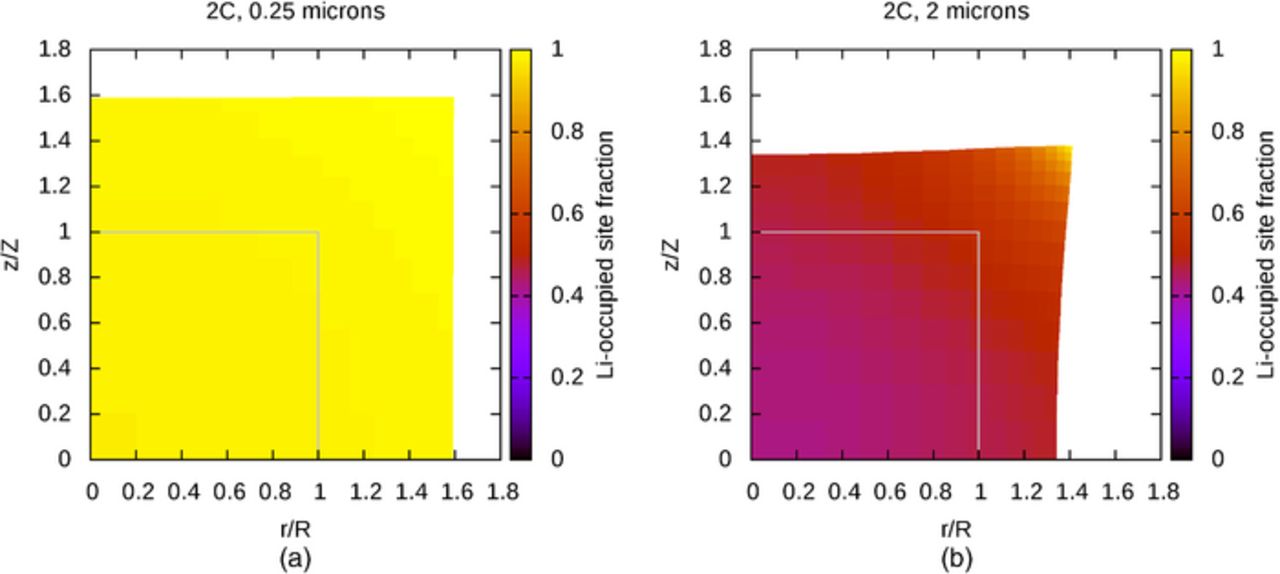
Figure 2. (a) End of lithium insertion in small particle without binder layer, (b) End of lithium insertion in large particle without binder layer.
However, in a porous electrode, active material particles do not exist in isolation–they are embedded in a porous matrix of binder and conductive additive. In order to mimic the presence of this matrix, the full problem, including attached binder regions, is now considered. Figure 3 shows a system that is identical to that in Figure 2b, except for the presence of the attached binder layer, drawn as a wireframe, and with the original position of the binder layer also outlined in gray. The binder has undergone significant deformation and is clearly constraining the volume expansion of the active material near the interface, affecting the distribution of lithium subtly by keeping the concentration relatively low in the most constrained regions. It is apparent that the binder has a significant mechanical role.
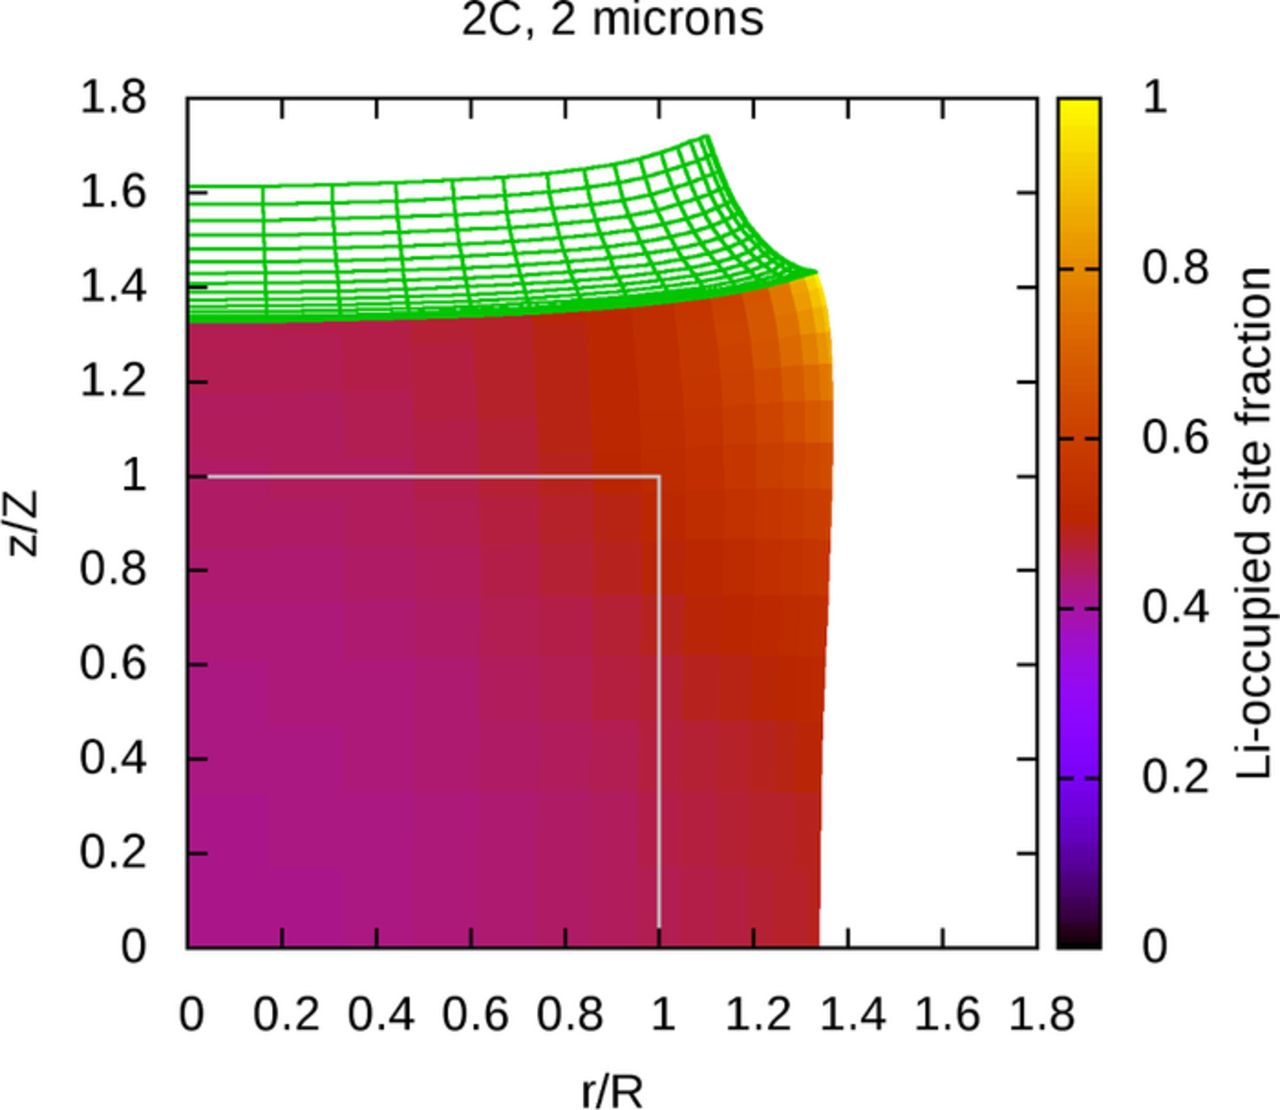
Figure 3. With binder layer, solution fields at end of lithium insertion simulation.
Yielding of active material and binder
Displacement of material, like in the examples just described, is associated with mechanical stress. Under sufficient stress or strain, materials undergo plastic deformation, from which the materials do not return to their original shape upon relaxation of the applied stress. This yielding process is a precursor to material damage, and theories of yield criteria have been developed in order to estimate the potential for yielding of various materials. While lithium-silicon alloys have been reported to demonstrate plastic deformation,31–33 the present authors do not know of any yield criteria theories that have been demonstrated as quantitatively correct for these materials. For this reason, the simple and common von Mises criterion will be used, not with the purpose of obtaining quantitatively correct results, but rather to provide a rough understanding of the significance of stresses within the model system.
The von Mises criterion says that a material will yield when the value of the "equivalent tensile stress" σv, computed from the stress tensor, reaches the yield stress σy measured for the material, at which point plastic deformation occurs with no further increase in the equivalent stress. Below this threshold, no yielding occurs. In the active material region, the equivalent tensile stress is calculated from the total stress tensor T as:
![Equation ([20])](https://content.cld.iop.org/journals/1945-7111/162/6/A1111/revision1/jes_162_6_A1111eqn20.jpg)
For this two-dimensional system, this simplifies to
![Equation ([21])](https://content.cld.iop.org/journals/1945-7111/162/6/A1111/revision1/jes_162_6_A1111eqn21.jpg)
In the binder region, in which there is no inserted material, the elastic stress tensor  is used instead of T.
These equivalent stresses are not used within the simulations described in this work; the governing equations do not address plastic deformation. Rather, simulation results are postprocessed to calculate equivalent yield stresses throughout the spatial domain. If the von Mises criterion were a quantitatively correct theory for these materials, the results could be compared with the yielding criterion to determine if and when yielding would have occurred. However, as this is not the case, these results serve only to build intuition about the development of stress in these systems.
Figure 4a shows the von Mises equivalent stresses as a function of position for a small active material particle, in the absence of attached binder and at the end of the lithium insertion process; the corresponding lithium distribution was shown in Figure 2a. The particle is small enough for lithium to diffuse evenly throughout the material, producing a fairly uniform particle expansion. As the surface region expands due to lithium insertion, it experiences compressive stress from pushing against neighboring material and also pulls outward, producing tensile stress in the interior of the particle. The upper-right corner, corresponding to an edge of the cylindrical particle, is least constrained by surrounding material, which allows relaxation of stress through material displacement. Stresses are slightly higher toward the upper-left and lower-right corners, which correspond to the centers of the cylinder top and side. These areas are slightly more constrained by neighboring material than the upper-right corner and show slightly higher stresses. The lower-left corner of the plot, corresponding to the center of the particle, shows relatively high equivalent stresses, as this region is under tension due to expansion of the surface region. Finally, between the core of the particle and the surface region, which is mostly under compression due to expansion against neighboring material, is a transition region of relatively low equivalent stress. These trends are reminiscent of the stress profiles observed in spherical particles by Christensen and Newman,13 in which the stress tensor could be described in terms of radial and tangential stress alone; in lithium insertion, they found a transition from tensile tangential stress in the core to compressive tangential stress near the surface, and that radial stress was tensile everywhere, approaching zero at the surface.
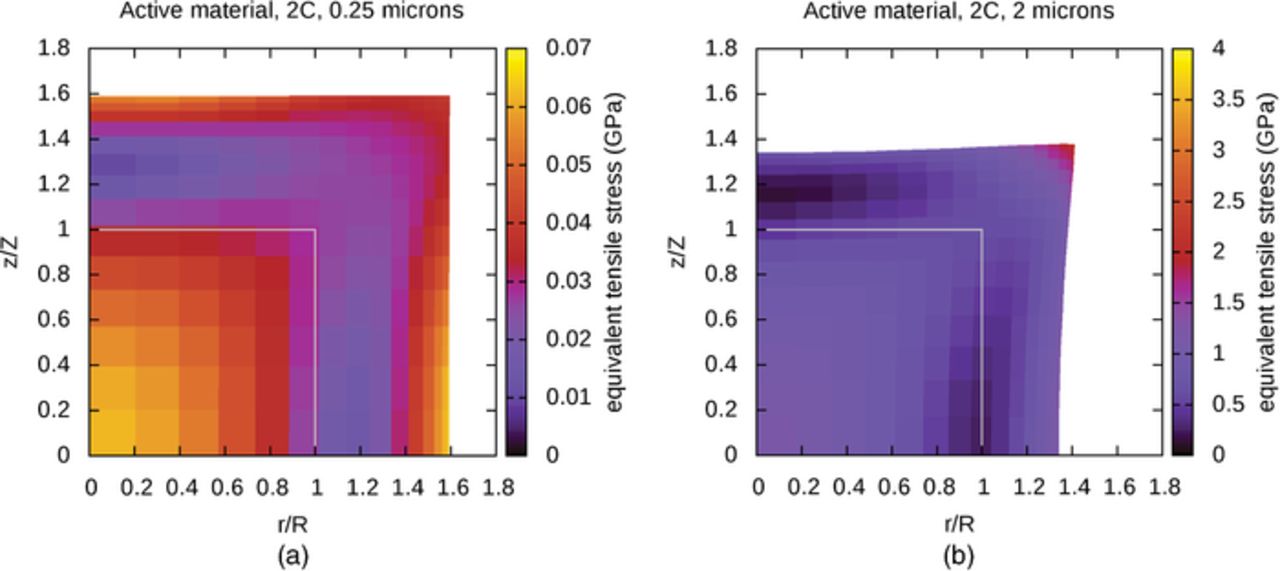
Figure 4. (a) Active material particle only, small particle: von Mises equivalent stresses, (b) Active material particle only, large particle: von Mises equivalent stresses; note the change in coloring scale.
The equivalent stress values in Figure 4a are relatively small in comparison with those observed in larger particles. Figure 4b shows the von Mises equivalent stresses at the end of lithium insertion in a large particle, corresponding to the concentration distribution shown in Figure 2b; this simulation terminated at a lower SOC than in the previous simulation because lithium insertion overwhelmed the diffusion process on the length scale of the particle, saturating the surface region with lithium. As the stresses here are much larger than those of the small particle in Figure 4a, a different coloring scale is used. While the maximum stress computed in this system is below 2.2 GPa, the upper end of the scale is set to 4 GPa to facilitate an upcoming comparison with Figure 5a. In this simulation, lithium concentration, displacement, and stress have built up near the surface of the particle. The area near the upper-right corner, corresponding to the edge of the cylindrical particle, receives inserted lithium through two nearby surfaces, which leads to a particularly fast increase in concentration, accompanied by relatively large displacement and stress. From this, one might infer that under high rates of lithium insertion, sharp particle edges are likely to be areas of high stress. From the previous example, in which lithium insertion rates were relatively low in comparison with diffusion rates, particle edges do not appear to be areas of unusually high stress. This suggests that, at least for amorphous materials, smoother particles may experience less damage than more jagged particles at high lithium insertion rates.
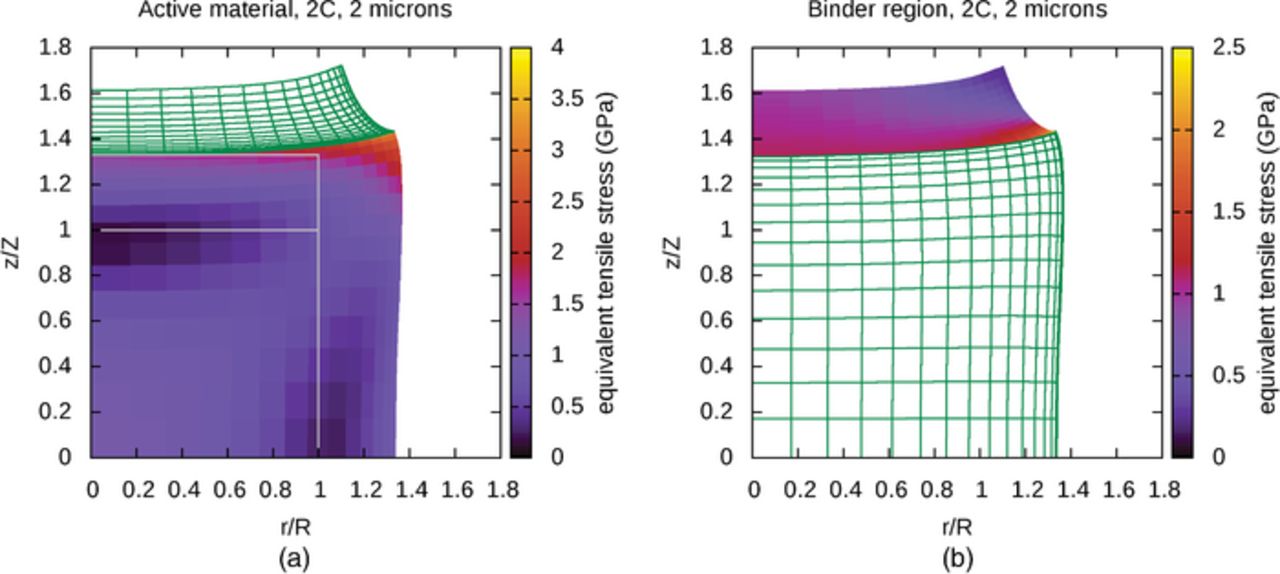
Figure 5. (a) Active material, von Mises equivalent stresses, (b) Binder, von Mises equivalent stresses.
The influence of an attached binder region is now considered. Figures 5a and 5b show the equivalent stresses at locations in the active material and binder regions separately, at the end of a simulation of lithium insertion in a large particle. The mechanical influence of the binder on the active material can be observed by comparing Figures 5a and 4b. As with the distribution of lithium in the active material, the mechanical constraint of the attached binder also influences the stress fields within the particle. Stresses tend to be high along the interface between the two regions, and particularly high near the upper-right corner of the active material, which experiences the most severe conditions. The upper-right corner of the binder is relatively unconstrained and is able to deform to relieve stress. In contrast, the strongly constrained material near the interface experiences a relatively large amount of stress, particularly at the lower-right corner of the binder adjacent to the edge of the initially-cylindrical particle.
According to the von Mises criterion, yielding occurs once the equivalent stress reaches a threshold value, so the largest stresses are of greatest interest when anticipating material damage. In Figure 6a, the maximum von Mises equivalent stresses in active material and binder regions are plotted as a function of particle size. As the uniformity of the lithium distributions depends on particle size, and simulations are terminated once any part of the active material is fully saturated with lithium, simulations of larger particles will terminate at a lower SOC. In order to compare stresses across a range of particle sizes in an intuitive way, the stresses are shown at a 40% SOC for all systems, which is reached in all of the simulations discussed in this section; simulations of lithium insertion in the 2 μm particles terminate shortly afterward.
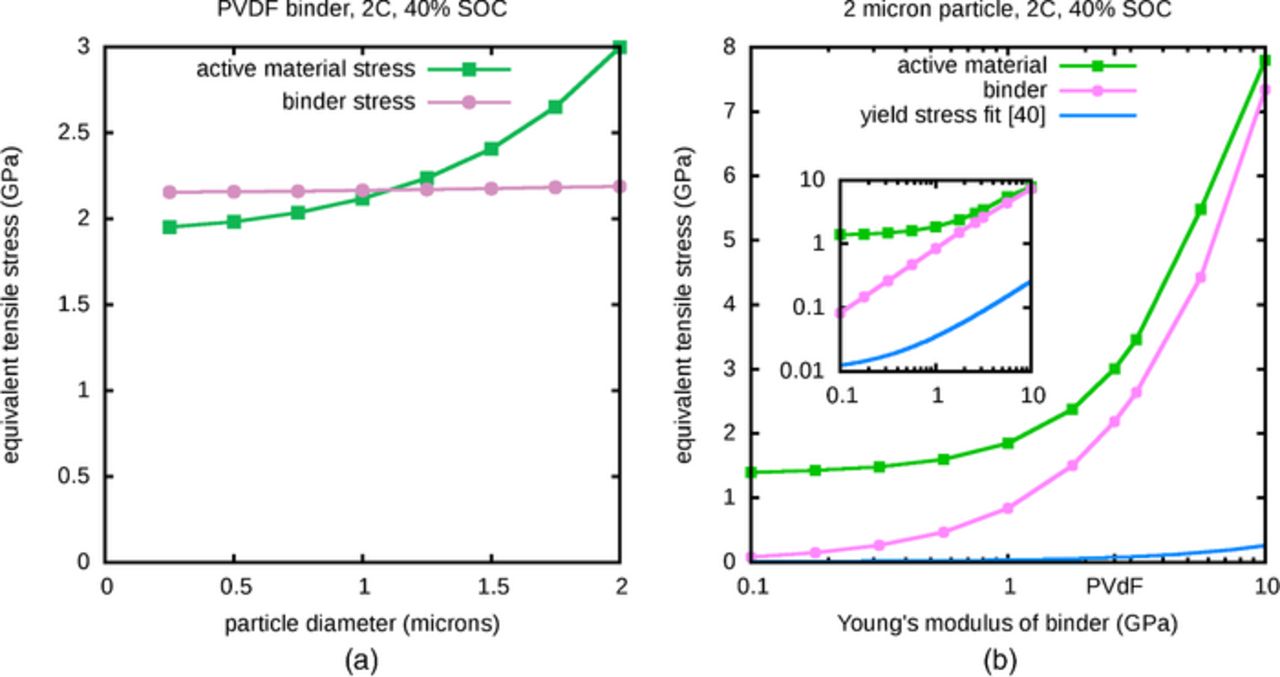
Figure 6. (a) Varying particle size, maximum von Mises stress at 40% SOC, (b) Varying binder stiffness, maximum von Mises stress at 40% SOC. Regression line from Seitz40 was obtained using a number of different polymers. Inset shows log-log plot.
The maximum equivalent stress in the active material, shown in Figure 6a, has a plateau in the small diameter limit because the length scales are small enough for diffusion to maintain a nearly uniform lithium distribution in spite of the insertion of lithium at the particle surface; below a certain size, solutions will not differ much. Figure 4a showed that the stresses in the active material alone were quite small for a small particle, which suggests that the magnitude of the small-particle plateau in Figure 6a primarily reflects the constraining effect of the attached binder layer. At larger particle sizes, the nonuniformity of the lithium distribution is associated with nonuniform expansion and larger stresses. Here, too, the presence of the binder layer is significant, as the plotted value for the 2 μm particle is more than 50% larger than the largest values shown in Figure 4b. For reference, Sethuraman et al.31 report a yield stress of 1.7 GPa for an alloy of lithium and silicon. This is close to the range of values plotted in Figure 6a, which suggests that this model is producing stresses that might be significant from the perspective of damage to active material. The larger stresses associated with larger particles are consistent with reported observations34,35 that suggest that smaller silicon particles are more resistant to damage. However, as the von Mises yield criterion is not known to be quantitatively correct for this material, the computed results should not be taken as a prediction of yielding.
Unlike in the active material, the maximum equivalent stress in the binder region, also shown in Figure 6a, is a very weakly increasing function of the particle size. As the binder is attached to the expanding active material, and the volume change of the active material is primarily determined by the amount of inserted lithium, the binder experiences significant stress in all cases and the nonuniformity in expansion of larger particles makes a relatively small additional contribution. Vinogradov and Holloway36 have reported a yield stress for PVDF of approximately 42 MPa, which is significantly lower than the computed equivalent stresses. While the von Mises yield criterion is not known to be accurate for PVDF either, the much larger computed stresses suggest that PVDF is very likely to experience damage under the simulated conditions. This appears to be consistent with reports10,37 that PVDF is a poor binder for silicon electrodes, but it is important to examine other binders. For example, good capacity retention has been reported38 with a binder consisting of a 1:1 mixture of styrene butadiene rubber and sodium carboxymethyl cellulose (SBR/CMC), in spite of its lower yield stress of 24.82 MPa. However, SBR/CMC is also reported38 to have a lower Young's modulus than PVDF, so the relationship between stress and binder stiffness must now be considered.
As the binder mechanically constrains the expansion of active material, the stiffness of the binder must influence the stress throughout the system. The maximum stresses in the active material and binder regions are plotted as a function of Young's modulus in Figure 6b. As the volume change of the active material is primarily determined by the amount of inserted lithium (which corresponds to a 40% SOC in all cases shown here), the binder region is stretched by roughly the same amount in all cases. The stress in both regions therefore increases with increasing binder stiffness because the binder serves as a stronger mechanical constraint; stretching the binder regions by a roughly fixed amount produces larger stresses within stiffer binders, and stronger constraining stresses on the attached active material. In the limit of very low binder stiffness, the binder exerts very little stress on the active material, and the stresses in the active material approach those of a system without the presence of a binder layer; in this particular case, the limiting active material stress value is fairly large because the particle is relatively large, which as described earlier leads to non-uniform expansion and associated strain. These trends suggest that use of a soft binder may prevent yielding in the active material by reducing the amount of additional stress due to presence of the binder. Additionally, a soft binder with a high yield stress may escape plastic deformation. Unfortunately, low Young's modulus values typically correlate with low yield stresses, as reported for glassy39 and both semicrystalline and amorphous40 polymers. In fact, the reported yield stress of PVDF36 is slightly overpredicted by the regression line provided by Seitz,40 which itself is shown in Figure 6b to lie well below the computed stresses. Although the simulations will tend to overpredict stresses due to the deviation of real material behavior from Hooke's law, comparison of the regression line with the computed stresses suggests that many polymers will be unsuitable binders for silicon electrodes, if their plastic deformation would significantly contribute to capacity fade. However, SBR/CMC has been reported38 to allow good capacity retention, even though its measured yield stress, although larger than that suggested by the regression line, is well below the nearby computed maximum stress values. This suggests that for certain binders, plastic deformation may not be the primary reason for capacity fade. Furthermore, given the increase in stress within active material particles due to attached binder, it is conceivable that particle cracking could be reduced through stress relief resulting from benign yielding of binder–in such a situation, a low yield stress might even be a desirable binder property.
Delamination of binder from active material
The discussion above considered the potential for yielding within the active material and within the binder. We now consider the possibility of damage to the interface between the two regions, through separation of the binder from the active material due to built-up elastic energy. Delamination is a complex process, and the present model does not attempt to capture its dynamic behavior. Instead, a limiting form of a model of delamination under equilibrium conditions, given by Ref. 41, will be used to interpret simulation results: delamination may occur if it releases as much or more energy than the measured surface energy–the energy required to separate the two regions, often reported per unit interfacial area as a measure of adhesion between two materials. Applying this criterion requires calculating the amount of energy released through relaxation if delamination were to occur. This is the change in total strain energy, which is the additional energy stored due to the presence of the attached binder, neglecting the slight changes in deformation due to the effect of the mechanical constraint on the lithium distribution in the active material.
The specific strain energies may be obtained by integrating over deformation histories. Assuming that the system contains only hyperelastic materials, the specific stress power ℓ, which is the time derivative of the specific strain energy wF (see Bertram24), is given by
![Equation ([22])](https://content.cld.iop.org/journals/1945-7111/162/6/A1111/revision1/jes_162_6_A1111eqn22.jpg)
where T1PK is the 1st Piola-Kirchoff, or Lagrangian, stress tensor. For the binder region, which does not experience internal pressure from inserted material, T1PK is related to the elastic stress tensor by:
![Equation ([23])](https://content.cld.iop.org/journals/1945-7111/162/6/A1111/revision1/jes_162_6_A1111eqn23.jpg)
and in the active material, it is related to the total stress tensor:
![Equation ([24])](https://content.cld.iop.org/journals/1945-7111/162/6/A1111/revision1/jes_162_6_A1111eqn24.jpg)
The specific strain energy is then
![Equation ([25])](https://content.cld.iop.org/journals/1945-7111/162/6/A1111/revision1/jes_162_6_A1111eqn25.jpg)
The total strain energy WF in a region may then be obtained by integrating this over the entire body. Implementation is discussed in Appendix
While their interface is intact, the binder and active material are in mechanical equilibrium. However, upon delamination, the binder region relaxes to its initial, undeformed state, but the active material relaxes to a configuration that may be very different from its initial state, due to the volume change caused by the presence of inserted lithium. To account for this complexity, active material strain energies are calculated through simulations of mechanical relaxation, with the lithium site fraction fixed everywhere because the characteristic time for lithium diffusion is relatively long. The momentum equations are the same as those in the original simulations, as are the momentum boundary conditions, except that the applied stress at the boundary at which the binder was attached is gradually reduced from that initially exerted by the binder region, to zero, in a series of "timesteps". The governing equations are actually independent of time, so these timesteps are used only to improve accuracy of the total strain energy calculation and solution convergence. The solution at the final timestep, computed for zero applied stress, describes the relaxed state of the active material.
Figure 7a shows the strain energy divided by area of the interface in the active material and binder regions separately, and the sum of these, as a function of particle size. This total is the amount of mechanical energy available for causing delamination of the two regions, per unit of interfacial area. For this fixed particle shape, the strain energy normalized by interfacial area changes almost linearly because the interfacial area scales as surface area, whereas the total strain energy is roughly proportional to volume, particularly for smaller particles with more uniform deformation. The computed normalized strain energies in Figure 7a are in a physically-relevant range. For reference, PVDF-TFE-P is reported9 to have an adhesion energy to silicon of 12 J/m2; the present authors are unaware of reports of adhesion energy for PVDF on silicon. This suggests that the available energy for delamination may be kept low by using particles that are sufficiently small.
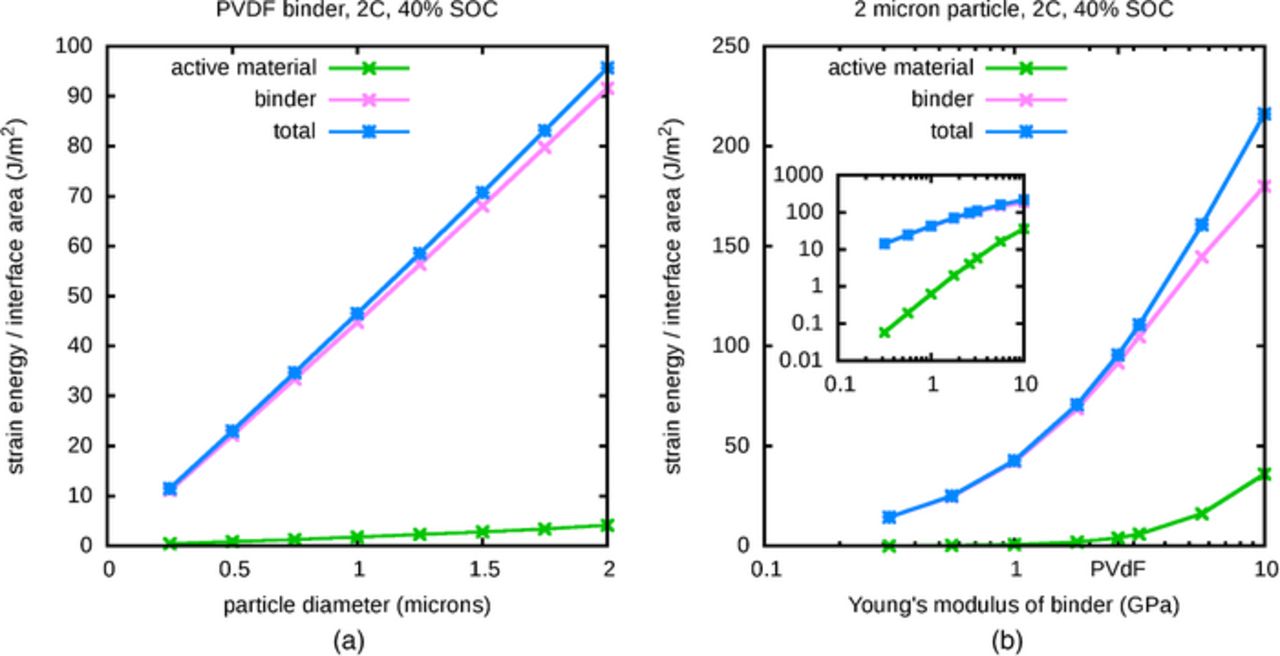
Figure 7. (a) Varying particle size, energy per interface area, (b) Varying binder stiffness, energy per interface area.
It is apparent from Figure 7a that the binder stores a much larger fraction of the total energy in these simulations. The binder is typically much softer than the active material–in this particular case, the binder is given the Young's modulus of PVDF–so the deformation of the active material region will be much smaller. When the binder is much softer than the active material, the amount of energy stored in the binder is much larger than that in the active material. This is analogous to stretching two simple springs, attached end to end, with the stiffer one having a much larger spring constant than the other. The stiffer spring experiences relatively little deformation, and therefore stores relatively little energy, and the fractions of stored energy remain constant even as the total energy grows due to continued stretching of the connected springs. These ideas are further explored in Figure 7b, which shows the strain energy in the active material and binder regions, and their sum, as a function of the value of the Young's modulus of the binder. For reference, the Young's modulus value of PVDF36 is marked. As before, the strain energy is primarily stored in the relatively soft binder, although the fraction of strain energy in the active material increases as the Young's modulus of the binder approaches that of the active material, which ranges between 33.90 GPa and 90.13 GPa according to equation 11. The total strain energy grows with binder stiffness because the volume change of the active material is primarily determined by the amount of inserted lithium, so a higher resistance to expansion causes more energy to be stored at a given SOC. Toward the left edge of the plot, as the value of Young's modulus approaches zero and the binder deforms more easily, the change in strain energy must approach zero, because the influence of the binder becomes negligible and the behavior of the particle approaches that of unconstrained active material.
The trends in these figures suggest that the available strain energy is low when particles are sufficiently small and the binder is sufficiently soft, making delamination less likely to occur. However, as adhesion energies vary among binders, a soft binder with a sufficiently low adhesion energy may still be vulnerable to delamination. Alternatively, one might select a binder with a much higher adhesion energy that can resist large strain energies in spite of high binder stiffness and large particle size. Chen et al. have used PVDF-TFE-P as a binder with the addition of an adhesion promoter that increases adhesion energy beyond 120 J/m2 (Ref. 9)–slightly higher than the range of values plotted in Figures 7a and 7b–and have demonstrated reduced capacity fade. Good adhesion to silicon may help to explain the success of carboxymethyl cellulose (CMC) as a silicon binder,10 in spite of its relative stiffness.37 Alternatively, it has been suggested42 that a self-healing interface between CMC and silicon allows electrical contact to be reestabished in spite of delamination.
Conclusions
While quantitatively correct theories of behavior are needed for the materials making up the model system described in this work, the observed trends in the simulation results are clear. In composite electrodes, the attachment of active material particles to surrounding material increases stress and allows additional modes of material damage, when compared with simulations of isolated particles. The results presented here suggest that, all else being equal, smaller particles experience lower stresses because diffusion produces more uniform lithium distributions, but that stresses throughout binder-particle systems can remain relatively large due to the attachment between the two regions. Stresses throughout such a composite system are lower when the Young's modulus of surrounding material is low, as the surroundings are less able to constrain the particle expansion, but sufficiently stiff surrounding material can produce stresses that are significantly higher than those generated in simulations of isolated active material particles. Although these simulations lack quantitative correctness, comparison of equivalent stress values with the much lower reported yield stresses suggests that PVDF is likely to undergo plastic deformation when attached to expanding active material particles. This may be consistent with what other researchers have noted: that PVDF is unlikely to be a suitable binder for silicon. However, it appears that many binder materials are similarly vulnerable to plastic deformation, including SBR/CMC, which is reported to perform well as a silicon binder. This suggests that plastic deformation may not be the primary cause of binder-related capacity fade in silicon electrodes employing certain binder materials. Nevertheless, smaller particles and softer binders are associated with lower stresses in active material particles, which is desirable for preventing yielding within particles. The same characteristics, along with sufficiently high binder yield stresses, should also reduce the risk of plastic deformation of the binder, which may remain an important consideration for some binder materials.
Furthermore, the additional strain energy stored in these composite systems due to constrained expansion can be significant with respect to reported binder-silicon adhesion energies. The strain energy normalized by interfacial area decreases with particle size, primarily because of the scaling of particle volume relative to surface area. In addition, softer binders provide less resistance to particle expansion, causing less strain energy to be stored. Comparison with reported adhesion energies suggests that the use of sufficiently small active material particles and soft binders with sufficiently high adhesion energies may prevent delamination between the two materials and the loss of electrical connectivity in composite electrodes.
Finally, the simulations and analyses described in this article involve a number of significant assumptions; for example, materials are assumed to remain linearly-elastic and undamaged, and the active material is assumed to be initially amorphous. The goal of this work is to provide qualitative insight into binder-particle interactions, and readers are cautioned against interpreting the results discussed here as quantitatively correct in the context of real systems. In order to make quantitatively correct predictions, careful experimental inputs and quantitatively correct theories of material behavior must be incorporated. Future work will involve material property measurements, further investigation of the relative importance of different modes of material failure, and experiments intended to test the qualitative trends extracted from the present simulation results.
Acknowledgment
This work was supported by the Assistant Secretary for Energy Efficiency and Renewable Energy, Office of Vehicle Technologies of the U.S. Department of Energy under Contract No. DE-AC02-05CH11231 under the Batteries for Advanced Transportation Technologies (BATT) Program.
KH thanks the contributors to the open-source software community, particularly the authors of packages used directly in this work (CPython, Cython, NumPy, SciPy, HDF5, h5py, and GNUPLOT).
: Appendix A: Implementation
Many of the equations presented in the body of this work have been given in the spatial description. However, the model described in this paper is most easily implemented by working with the same equations in the material description. In this appendix, the equations are given in the latter form, still independent of coordinate system, and are then specialized to cylindrical coordinates and written as scalar equations.
In the finite-volume method, equations are discretized by integrating over subdivisions of the spatial domain. In this axisymmetric model, the rectangular cross-section is covered with a rectangular grid of lines at specified intervals in r and z. These grid lines correspond to boundaries of the subdivisions; the subdivisions are themselves either cylindrical volumes (if adjacent to the axis) or rings with rectangular cross-sections. From the perspective of the domain cross-section, each subdivision is associated with a single control point, at which solution values are located for the purpose of interpolation. These control points are positioned at the intersections of a second set of grid lines forming a second rectangular grid over the domain cross-section, interwoven with the first grid. Both grids have grid lines that coincide with the boundary of the domain cross-section, and the interior volume boundaries are equidistant from the neighboring grid lines determining the control point locations.
The remaining numerical details are as follows: The first-order backward Euler scheme is used for the initial timestep, and the second-order trapezoidal rule is used for all subsequent timesteps. Interpolants and derivatives are computed with the lowest-order formulas that vary smoothly in the neighborhood of the location of interest. Each solution field over any one of these volumes is characterized by a single value. Average values are approximated by the values interpolated at the center of each volume, for a volume average, or at the midpoint of each edge, for an average along one dimension.
Appendix. Momentum equation in binder region
The equation of mechanical equilibrium 1 is rewritten as (see Bertram24):
![Equation ([A1])](https://content.cld.iop.org/journals/1945-7111/162/6/A1111/revision1/jes_162_6_A1111eqn26.jpg)
where
![Equation ([A2])](https://content.cld.iop.org/journals/1945-7111/162/6/A1111/revision1/jes_162_6_A1111eqn27.jpg)
is the 1st Piola-Kirchhoff stress tensor in this region.
Scalar equations of mechanical equilibrium are obtained from the tensor equation A1 by taking dot products with unit vectors. Two orthonormal vectors, one in the radial direction,  , and one in the axial direction,
  , are used. For this axisymmetric system, the dot product with the unit vector in the θ direction,
  , results in an equation that is holds identically, and therefore is not used. The scalar equations are obtained as:
![Equation ([A3])](https://content.cld.iop.org/journals/1945-7111/162/6/A1111/revision1/jes_162_6_A1111eqn28.jpg)
![Equation ([A4])](https://content.cld.iop.org/journals/1945-7111/162/6/A1111/revision1/jes_162_6_A1111eqn29.jpg)
For numerical calculations, it is necessary to write these equations in terms of tensor components, which are expressed with respect to a particular tensor basis. In this particular case, the tensor components are defined so that
![Equation ([A5])](https://content.cld.iop.org/journals/1945-7111/162/6/A1111/revision1/jes_162_6_A1111eqn30.jpg)
where i and j can be r, θ, or z, so that  and
and  represent the unit vectors in these directions. By working in this basis, tensor multiplication can be performed by matrix multiplication of the component representations. In this tensor basis on an axisymmetric cylinder (cf. Bertram24), the two scalar equations expressed in component form are:
![Equation ([A6])](https://content.cld.iop.org/journals/1945-7111/162/6/A1111/revision1/jes_162_6_A1111eqn31.jpg)
![Equation ([A7])](https://content.cld.iop.org/journals/1945-7111/162/6/A1111/revision1/jes_162_6_A1111eqn32.jpg)
Here,
![Equation ([A8])](https://content.cld.iop.org/journals/1945-7111/162/6/A1111/revision1/jes_162_6_A1111eqn33.jpg)
where there is implicit summation over the repeated dummy index k; k ranges over the values r, θ, and z. Hooke's law in component form is
![Equation ([A9])](https://content.cld.iop.org/journals/1945-7111/162/6/A1111/revision1/jes_162_6_A1111eqn34.jpg)
and Almansi's strain tensor in component form is:
![Equation ([A10])](https://content.cld.iop.org/journals/1945-7111/162/6/A1111/revision1/jes_162_6_A1111eqn35.jpg)
with implicit summation, as before, over j.
The deformation gradient components appearing here are calculated as the gradient of the spatial coordinates of a material particle with respect to the material coordinates. They are given by (see Bertram24):
![Equation ([A11])](https://content.cld.iop.org/journals/1945-7111/162/6/A1111/revision1/jes_162_6_A1111eqn36.jpg)
where the first index, j, corresponds to the matrix row, and the second, i corresponds to the column. The inverse is given by
![Equation ([A12])](https://content.cld.iop.org/journals/1945-7111/162/6/A1111/revision1/jes_162_6_A1111eqn37.jpg)
where
![Equation ([A13])](https://content.cld.iop.org/journals/1945-7111/162/6/A1111/revision1/jes_162_6_A1111eqn38.jpg)
Appendix. Momentum equation in the active material region
The 1st Piola-Kirchhoff stress tensor in this region is likewise defined as
![Equation ([A14])](https://content.cld.iop.org/journals/1945-7111/162/6/A1111/revision1/jes_162_6_A1111eqn39.jpg)
in terms of which the equation of mechanical equilibrium is
![Equation ([A15])](https://content.cld.iop.org/journals/1945-7111/162/6/A1111/revision1/jes_162_6_A1111eqn40.jpg)
The scalar equations are identical in form to equations A6 and A7.
Appendix. Lithium transport
In cylindrical coordinates, for a axisymmetric system, the continuity equation 15 can be written as (see Bertram24):
![Equation ([A16])](https://content.cld.iop.org/journals/1945-7111/162/6/A1111/revision1/jes_162_6_A1111eqn41.jpg)
where the superscripts indicate the r and z elements of the flux vector. This equation is then divided by the concentration of all host sites in the material description,  , which is constant. Since the total number of host sites in a given material volume does not change, a ratio of concentrations with respect to this description is also a site ratio:
![Equation ([A17])](https://content.cld.iop.org/journals/1945-7111/162/6/A1111/revision1/jes_162_6_A1111eqn42.jpg)
The lithium flux vector in the spatial description is taken from Christensen and Newman13 and has the form:
![Equation ([A18])](https://content.cld.iop.org/journals/1945-7111/162/6/A1111/revision1/jes_162_6_A1111eqn43.jpg)
The lattice velocity  is the time derivative of host site spatial positions. A position in the material description corresponds to a particular position in the host lattice, so the lattice velocity can be computed as the time derivative of the present position associated with the material at some initial position:
![Equation ([A19])](https://content.cld.iop.org/journals/1945-7111/162/6/A1111/revision1/jes_162_6_A1111eqn44.jpg)
For brevity, the intermediate variable  has been introduced as:
![Equation ([A20])](https://content.cld.iop.org/journals/1945-7111/162/6/A1111/revision1/jes_162_6_A1111eqn45.jpg)
where  and cE are the LiS and total concentrations, both with respect to the deformed volume,
  is the diffusion coefficient of LiS in S, or equivalently, Li in Si, Rg is the universal gas constant, T is temperature,
  and
and  are the molar masses of species S and LiS,
  is the density of the host material without inserted lithium, and ω is the change in volume at full lithium capacity, divided by initial volume. The thermodynamic factor α13 is given by:
![Equation ([A21])](https://content.cld.iop.org/journals/1945-7111/162/6/A1111/revision1/jes_162_6_A1111eqn46.jpg)
which will be simply taken equal to 1 in this work–that is, the dependence of the activity coefficient of LiS upon site fraction is neglected.
For ease of implementation, the flux expression will transformed to the material description. The total number of sites for a given material region is fixed for all times, as is the total concentration of sites cL relative to initial control volumes, and it is further assumed that the active material is initially homogeneous, so cL is also independent of position. In particular,
![Equation ([A22])](https://content.cld.iop.org/journals/1945-7111/162/6/A1111/revision1/jes_162_6_A1111eqn47.jpg)
Then the total concentration of sites cE relative to present volume can be computed by incorporating the volume change:
![Equation ([A23])](https://content.cld.iop.org/journals/1945-7111/162/6/A1111/revision1/jes_162_6_A1111eqn48.jpg)
Substituting these into A20 and writing the gradient operations in terms of material coordinates then gives:
![Equation ([A24])](https://content.cld.iop.org/journals/1945-7111/162/6/A1111/revision1/jes_162_6_A1111eqn49.jpg)
The flux vector now will be rewritten in the material description. The deformation gradient F transforms a line segment in the initial configuration to the corresponding one in the present, deformed configuration. While this appropriately transforms the direction of the flux vector, the flux magnitude must reflect the change in area. Consider two control volumes, one drawn with respect to the material description and the other drawn with respect to the spatial description, which enclose the same set of material in the initial and present configurations. Let  and
and  be area vectors in the material and spatial descriptions. These are normal to the control volume surfaces and have magnitudes representing surface area. The rate of lithium insertion through the surface must be independent of the description, and so for corresponding locations on the two control volumes, the following must hold:
![Equation ([A25])](https://content.cld.iop.org/journals/1945-7111/162/6/A1111/revision1/jes_162_6_A1111eqn50.jpg)
Then using Nanson's formula (see, for instance, Bertram24), the area vector in the present configuration can be rewritten so that
![Equation ([A26])](https://content.cld.iop.org/journals/1945-7111/162/6/A1111/revision1/jes_162_6_A1111eqn51.jpg)
or using the definition of a transposed tensor,
![Equation ([A27])](https://content.cld.iop.org/journals/1945-7111/162/6/A1111/revision1/jes_162_6_A1111eqn52.jpg)
As this must hold for arbitrary  on arbitrary control volumes, one can conclude that the relationship between the equivalent flux vectors in the two descriptions can be written as
![Equation ([A28])](https://content.cld.iop.org/journals/1945-7111/162/6/A1111/revision1/jes_162_6_A1111eqn53.jpg)
so that
![Equation ([A29])](https://content.cld.iop.org/journals/1945-7111/162/6/A1111/revision1/jes_162_6_A1111eqn54.jpg)
In component form, this is
![Equation ([A30])](https://content.cld.iop.org/journals/1945-7111/162/6/A1111/revision1/jes_162_6_A1111eqn55.jpg)
where
![Equation ([A31])](https://content.cld.iop.org/journals/1945-7111/162/6/A1111/revision1/jes_162_6_A1111eqn56.jpg)
For a scalar field s on an axisymmetric system, the components of the gradient vector in this coordinate system are given by
![Equation ([A32])](https://content.cld.iop.org/journals/1945-7111/162/6/A1111/revision1/jes_162_6_A1111eqn57.jpg)
Substituting this into the flux expression yields
![Equation ([A33])](https://content.cld.iop.org/journals/1945-7111/162/6/A1111/revision1/jes_162_6_A1111eqn58.jpg)
where the derivatives describe variation relative to initial positions.
Appendix. Momentum boundary conditions
A stress vector on a surface in the present configuration can be related a stress vector on the surface in its initial configuration. Let  be an area vector describing a location on a surface. Then Nanson's formula may be used for the transformation of area vectors, so that in the active material, the stress vector can be obtained as
![Equation ([A34])](https://content.cld.iop.org/journals/1945-7111/162/6/A1111/revision1/jes_162_6_A1111eqn59.jpg)
where a and a0 are present and initial surface areas. This stress vector is the zero vector on all exposed surfaces and cancels the stress vector of the same form at the interface with the binder.
Appendix. Mass transfer boundary conditions
The lithium flux 19 at the particle surface is uniform over the surface in the deformed configuration. Since the present model is implemented using the material description, it is necessary to consider that the surface area at different locations typically changes at different rates. Using A28 to transform the lithium flux at the particle surface from the spatial to material description, one obtains:
![Equation ([A35])](https://content.cld.iop.org/journals/1945-7111/162/6/A1111/revision1/jes_162_6_A1111eqn60.jpg)
It is convenient to rewrite this in terms of the unit normal vector  on the undeformed surface. Recognizing that the deformation gradient F transforms between corresponding line elements in the undeformed and deformed descriptions, a vector in the direction of
  must transform to a vector in the direction of
  ,
,
![Equation ([A36])](https://content.cld.iop.org/journals/1945-7111/162/6/A1111/revision1/jes_162_6_A1111eqn61.jpg)
for some non-zero value β. Therefore, the vector  is in the
  direction, and so by equation A35,
  is also in the
  direction. This reflects the idea that the flux vector in the spatial description is defined to be perpendicular to the deformed surface, and likewise the flux vector in the material description must be perpendicular to the undeformed surface. The flux vector in the material description can therefore be written in terms of a projection in the normal direction:
![Equation ([A37])](https://content.cld.iop.org/journals/1945-7111/162/6/A1111/revision1/jes_162_6_A1111eqn62.jpg)
Now let  and
and  be area vectors describing the surface of the active material region in the initial and present, deformed configurations. These are normal vectors to the surface with magnitudes equal to the areas of the surfaces that they represent. Under the finite-volume method, the deformed domain is divided into smaller volumes, each represented by a quadrilateral cross-section. The edges of the quadrilateral represent volume faces, each of which can be characterized by a single area vector. The area vectors can be related by Nanson's formula,
![Equation ([A38])](https://content.cld.iop.org/journals/1945-7111/162/6/A1111/revision1/jes_162_6_A1111eqn63.jpg)
or
![Equation ([A39])](https://content.cld.iop.org/journals/1945-7111/162/6/A1111/revision1/jes_162_6_A1111eqn64.jpg)
where a and a0 are the edge lengths representing areas of the faces. Taking the dot product with the unit normal vector  and rearranging, this gives
![Equation ([A40])](https://content.cld.iop.org/journals/1945-7111/162/6/A1111/revision1/jes_162_6_A1111eqn65.jpg)
![Equation ([A41])](https://content.cld.iop.org/journals/1945-7111/162/6/A1111/revision1/jes_162_6_A1111eqn66.jpg)
![Equation ([A42])](https://content.cld.iop.org/journals/1945-7111/162/6/A1111/revision1/jes_162_6_A1111eqn67.jpg)
Substituting into the expression for the flux boundary condition A37 gives
![Equation ([A43])](https://content.cld.iop.org/journals/1945-7111/162/6/A1111/revision1/jes_162_6_A1111eqn68.jpg)
According to this equation, the lithium flux through a surface on the domain boundary is determined from the fraction of total present surface area that it contributes. The control volume surfaces making up the domain boundary are surfaces of rotation about the axis of the original cylinder; their areas can be calculated from taking differences of surface areas of cylinders or cones as appropriate.
Appendix. Accuracy
The accuracy of a numerical solution should improve with increasing resolution in time and space. However, increased resolution comes at the cost of longer calculation times. These costs can be particularly large when working in more than one spatial dimension and solving nonlinear systems, as in the case of this model. The choice of 16-by-16 quadratically-spaced grids and 1600 nominal timesteps, as described earlier, was chosen to balance acceptable approximation error with acceptable solution speed, as was determined by performing a number of short simulations to determine the tradeoff between accuracy and resolution.
The influence of timestep size was examined through a series of simulations of lithium insertion into a particle with a diameter of 2 μm, at a 2C rate, for a fixed time interval corresponding to 5% SOC. The results calculated with the smallest timestep size were taken as an approximation to the exact values. The maximum absolute values of the differences with solutions computed with larger step sizes, taken at the same instant in time, were divided by the exact values in order to obtain relative errors. On a log-log plot, the error curves approach a slope of 2 for small timestep sizes, which is expected when using the second-order trapezoidal rule. At this spatial resolution, the relative error due to time discretization was less than 1% when using 1600 nominal timesteps.
The influence of spatial discretization was examined through a similar series of simulations, at the chosen timestep size, using grids of differing resolution. Grid resolutions were chosen so that four horizontal and four vertical grid lines coincide among the grids of all resolutions, and the relative errors at the intersections of these grid lines were determined, again demonstrating good convergence. A resolution of 16-by-16 volumes in both active material and binder regions was found to produce a relative error of at most 2% for any solution field.
: Appendix B: Equation of State
Here, a new equation of state for the inserted lithium is developed. Consider a small cube of silicon with volume V0 at atmospheric pressure, and assume that inserted lithium exerts a pressure p on the boundary of the silicon region, from the inside. This pressure causes a change in volume of the region, from V0 to V1. For simplicity, assume that the cube remains a cube under lithium insertion. Then (see, for instance, Fung43) the extension,
![Equation ([B1])](https://content.cld.iop.org/journals/1945-7111/162/6/A1111/revision1/jes_162_6_A1111eqn69.jpg)
which is the change in length divided by final length along Cartesian axis i, is related to the corresponding diagonal element of Almansi's strain tensor in Cartesian form:
![Equation ([B2])](https://content.cld.iop.org/journals/1945-7111/162/6/A1111/revision1/jes_162_6_A1111eqn70.jpg)
where there is no implied sum over i.
Under the assumption that the lithium-silicon alloy obeys Hooke's law 6, the same deformation could have been produced by an external stress characterized by the stress tensor
![Equation ([B3])](https://content.cld.iop.org/journals/1945-7111/162/6/A1111/revision1/jes_162_6_A1111eqn71.jpg)
with implicit summation over ℓ. The dependence of Ea and νa on lithium concentration, described by equations 11 and 12, is retained. The diagonal elements of the stress tensor are identical, and so equal to their average, the mean normal stress. This gives the pressure that must be exerted by the lithium within in order to produce the change in volume from V0 to V1:
![Equation ([B4])](https://content.cld.iop.org/journals/1945-7111/162/6/A1111/revision1/jes_162_6_A1111eqn72.jpg)
This equation of state will now be written in terms of more convenient quantities. Obrovac et al.27 have provided a fit to molar volumes v of lithium-silicon compounds as a function of x in the chemical formula LixSi, the ratio of moles of Li to moles of Si, of the form:
![Equation ([B5])](https://content.cld.iop.org/journals/1945-7111/162/6/A1111/revision1/jes_162_6_A1111eqn73.jpg)
where v0 = 10.96 ml/mol and k = 9.00 ml/mol. As discussed earlier, the present model involves only the species LiS and S, and the ratio x of lithium atoms to silicon atoms is related to the lithium-occupied site fraction by 10. Therefore, one may also write
![Equation ([B6])](https://content.cld.iop.org/journals/1945-7111/162/6/A1111/revision1/jes_162_6_A1111eqn74.jpg)
or dividing by v0,
![Equation ([B7])](https://content.cld.iop.org/journals/1945-7111/162/6/A1111/revision1/jes_162_6_A1111eqn75.jpg)
The lithium pressure, for an alloy under atmospheric pressure, is then
![Equation ([B8])](https://content.cld.iop.org/journals/1945-7111/162/6/A1111/revision1/jes_162_6_A1111eqn76.jpg)
When  , this correctly gives the lithium pressure as zero. As
  increases, the lithium pressure increases. However, if external pressure is applied, then the volume and lithium pressure of the region will change. Data is not available under a range of external pressures, so some assumptions must be made.
The following strategy will be used: again, under the assumption that the alloy is an elastic solid, an external pressure p1, 2 now will be applied to isotropically change the volume from V1 to V2. This required pressure can be determined from Hooke's law. Next, the original silicon cube will be expanded from volume V0 to volume V2 by applying tension t0, 2 on its surface, also determined according to Hooke's law. Then for lithium pressure to have produced this volume change in the alloy under this external pressure, it must account for the magnitude of the tension and must additionally balance the external pressure.
The diagonal elements of the stress tensor  describing the external stress compressing the alloy are again identical, and equal to the mean normal stress and the negative of the external pressure:
![Equation ([B9])](https://content.cld.iop.org/journals/1945-7111/162/6/A1111/revision1/jes_162_6_A1111eqn77.jpg)
Similarly, the tension needed to expand the silicon cube from V0 to V2 is
![Equation ([B10])](https://content.cld.iop.org/journals/1945-7111/162/6/A1111/revision1/jes_162_6_A1111eqn78.jpg)
The lithium pressure is then
![Equation ([B11])](https://content.cld.iop.org/journals/1945-7111/162/6/A1111/revision1/jes_162_6_A1111eqn79.jpg)
![Equation ([B12])](https://content.cld.iop.org/journals/1945-7111/162/6/A1111/revision1/jes_162_6_A1111eqn80.jpg)
The determinant J of the deformation gradient is the ratio of final (V2) to initial (V0) volumes. Introducing this into the pressure expression and then substituting from the relationship for the ratio of intermediate and initial volumes, this becomes:
![Equation ([B13])](https://content.cld.iop.org/journals/1945-7111/162/6/A1111/revision1/jes_162_6_A1111eqn81.jpg)
When  , the pressure is zero. When the volume change is solely due to an increase in
  , so that
  , the original formula with no external pressure is recovered.
: Appendix C: Strain Energy Calculation
From the specific strain energy given by equation 25, the total strain energy WF in the active material can be approximated by summing over the volume-weighted stress energy densities:
![Equation ([C1])](https://content.cld.iop.org/journals/1945-7111/162/6/A1111/revision1/jes_162_6_A1111eqn82.jpg)
Since the simulation consists of discrete timesteps, this is approximately
![Equation ([C2])](https://content.cld.iop.org/journals/1945-7111/162/6/A1111/revision1/jes_162_6_A1111eqn83.jpg)
Approximately integrating this gives:
![Equation ([C3])](https://content.cld.iop.org/journals/1945-7111/162/6/A1111/revision1/jes_162_6_A1111eqn84.jpg)
where the angle brackets indicate an averaged value over a given timestep. In component form, this is
![Equation ([C4])](https://content.cld.iop.org/journals/1945-7111/162/6/A1111/revision1/jes_162_6_A1111eqn85.jpg)