
Abstract
The requisite to obtain reduced graphene oxide as an individual sheet and to maintain it in the reduced form introduces a new way of manipulative nanocomposite systems (e.g., semiconductor or metal nanoparticle and graphene composite). Herein, we developed a simple suitable UV-.assisted photocatalytic reduction method to prepare the most viable nanocomposite ZnO/RGO. Graphene oxide undergoes reduction reaction in ethanol- water system as it accepts electrons from UV irradiated semiconductor (ZnO), and subsequently characterized using different standard techniques. The presence of graphene in the composites were confirmed by X-ray diffraction (XRD), Raman, FTIR, SEM, TEM, and X-ray photoelectron spectroscopy (XPS) analysis. The highly efficient ZnO/RGO nanocomposite exhibited enhanced photocatalytic degradation performance for the degradation of methylene blue, with a maximum removal rate of (∼80%) as compared with pure ZnO nanoparticles (∼68%). This effective increase in degradation were caused by the prevention of electron–hole pair recombination in ZnO with the introduction of RGO. These findings suggest that the synthesized ZnO/RGO nanocomposite via photocatalytic approach not only offers UV-assisted reduction technique, but also open up a new way to obtain photoactive graphene-semiconductors, which could be effectively used in various application.
Export citation and abstract BibTeX RIS
With many superlatives to its name as an emerging carbon nanomaterial with unique 2D conjugated chemical structure, graphene has captured the attention of the scientific community. In 2004, the common insight was displayed by the experimental discovery of graphene by Geim and coworkers.1 It is the thinnest known material and the strongest ever measured, has a special electronic structure, which gives it unusual electronic properties such as the anomalous quantum Hall effect,2 high thermal conductivity (5000 W m K−1), high specific surface area (∼2600 m2/g), and astonishing high electron mobility (250,000 cm2/V s).3,4 Repeated interest in graphene architectures has opened up new possibilities to use them in nanoelectronics5, photovoltaics, catalysis and energy storage devices.6,7 To produce graphene- based materials via reduction of exfoliated graphite oxide (GO) have been approved through research1 Such as chemical reduction using hydrazine, and high- temperature annealing reduction.8 Therefore, to improve the superficial and the practical reduction method remains the puzzling dispute. The necessity to obtain graphene as individual sheet and to maintain it in the reduced form introduces a new way the manipulative composite system (e.g., semiconductor or metal nanoparticle and graphene nanocomposite). Recently, n-type semiconductor ZnO nanoparticles with wide bandgap (Eg ∼3.37 eV at room temperature) has received considerable attention for many technologically important applications because of its exclusive properties of optical transparency, UV emission, piezoelectricity and electrical conductivity.9 Moreover, low- cost of production and bio-compatibility and is non-toxic (environmentally friendly) and chemically stable.10 Recently, RGO/ZnO nanocomposites preparation is under consideration, to combine graphene oxide (GO) and graphene (GR) with some semiconductors, which makes proper improvement in the charge transport, photocatalytic activity, and thermal conductivity. These properties strongly depend on the morphology and size of nanomaterials. The photocatalytic performance of ZnO/RGO nanocomposites could be improved, because with the greater light scattering and excellent electron transport and reduced electron hole pair recombination resulting from the graphene. Similarly, ZnO/RGO nanocomposites have a large surface area, which can potentially enhance the photocatalytic performance.11 Moreover, the fast recombination of photo-generated charge carriers in ZnO decreases its photocatalytic performances. Therefore, the progress of composite materials containing ZnO particles is of high concern to solve these problems.12 During photocatalysis experiments, graphene in the composites will act both as electron-acceptor and as electron-transport materials, which will ease the migration of photo-generated electrons and hinder the charge recombination and thus extend the lifetime of electron-hole pairs and improve the photocatalytic efficiency of ZnO,13,14 Initial purpose to use graphene as a supporting material to anchor metal nanoparticles has already been reported.15 The hybridization of graphene with photocatalysts was employed to enhance the photocatalytic activity.16 We have now designed an on-demand reduction strategy to obtain ZnO-RGO composite with enhanced photocatalytic activity. The property of semiconductor nanoparticles to partially reduce GO samples when excited with UV light was demonstrated recently withTiO2.17 it has already been reported by Moussa, et al., ZnO rods-reduced graphene oxide composites via a solvothermal reaction for efficient photocatalysis.18 Xu et al., synthesized ZnO–graphene composite by reducing GO coated on the surface of ZnO nanoparticles using hydrazine and found that ZnO–graphene composite showed an improved photocatalytic the efficiency (∼90%) in the degradation of MB as compared with pure ZnO.19 Xin Chuan Liu et al. has been successfully represented a ZnO-RGO nanocomposite with enhanced photocatalytic activity in reduction of Cr (VI).20 Li and Cao reported the incorporation of graphene into ZnO to form a ZnO–graphene composite by chemically reducing the mixture of GO dispersion and Zn(AcO)2 in aqueous solution using NaBH4 and studied the photocatalytic degradation of rhodamine B under UV and visible light irradiation using the composite.21 Khan Mohammad et al. studied the Photocatalytic activity of one-pot synthesized reduced graphene oxide – zinc oxide nanocomposites22
In our maiden effort we have successfully fabricated ZnO-reduced graphene oxide (RGO) nanocomposites via UV-assisted photocatalytic reduction of GO by commercially prepared ZnO nanoparticles in ethanol- water system and investigated their photocatalytic performances by degradation of dyes, nanocomposites exhibit an enhanced photocatalytic performance in degradation of methylene blue under UV-light irradiation as compared with pure ZnO nanoparticles.
Experimental
Materials
Natural graphite powder (<45 μm, ≥ 99.99%), concentrated sulfuric acid (H2SO4, 98.08%), Sodium Nitrate (NaNO3), hydrogen peroxide (H2O2, 30%), potassium permanganate(KMnO4) and ethanol (∼99.5%), all were obtained from Sinopharm Chemical Reagent Co. Ltd (Shanghai, China). Commercially available particulate ZnO nanoparticles (30 nm ± 10 nm) 99.9% metal basis were purchased from Aladdin Industrial Corporation Shanghai China. All of the material were used as received without further purification. All solutions were prepared using Milli-Q water (>18.2 MΩ cm resistivity) the solvent.
Preparation of GO
GO was obtained with ultrasonic exfoliation of graphite oxide, Which was prepared by Hummers `method,23 in an ultrasonic bath (FRQ-1006HT,300W,Front Ultrasonic). Typically,5 g Natural graphite powder (45 μm, 99%), and 2.5 g Sodium Nitrate (NaNO3), were added to 115 ml of concentrated sulfuric acid (H2SO4, 98.08%), in a round bottom flask. And stirred in the ice bath for 30 min at a temperature of 5°C Then 15 g of KMnO4 was mixed into the suspension .The flask was placed in water-bath and was maintained at a temperature of 35°C for 30 min, Over the next 30 min, Water ultra-purified (UP) filtered resistivity (18 MΩ cm) was used throughout the experiment. 230 ml of water was added drop by drop with the help of burrete into the suspension, and the obtained suspension was heated to 98°C. After 15 min, the as prepared suspension was then further diluted to approximately 420 ml and treated by 50 ml 30 wt% hydrogen peroxide. The graphite oxide was obtained after centrifugation, washing, and drying. The GO was obtained by ultrasonic exfoliation of the as-prepared graphite oxide.
Synthesis of ZnO–RGO nanocomposite
The ZnO-RGO nanocomposites have been synthesized via a simple superficial UV-assisted photocatalytic approach as illustrated in Figure 10. The comprehensive synthesis procedure was as follows: A certain amount of 1.8 mg/ml of GO prepared by modified Hummers method, and 1 g ZnO nanoparticles (commercially prepared 30 nm) were dispersed in 60ml ethanol with the assistance of ultrasonication and sonicated for 30 min to form a homogeneous ZnO/ GO suspension. UV-assisted photocatalytic reduction of GO by ZnO nanoparticles in ethanol was carried out in a 100 ml cylindrical quartz glass vessel using a 500 W high- pressure Hg lamp with the main wavelength at 365 nm for about 7 h under continuous magnetic stirring. After UV irradiation, it was noticeably found that the color of the suspension had changed into grayish-black, demonstrating the successful chemical reduction of GO sheets) it should be noticed that no further reduction of GO under UV irradiation for longer time is detected by Fourier transform infrared spectroscopy (FTIR) measurement which is generally used to illustrate the degree of converting GO to RGO. The as-synthesized ZnO/RGO nanocomposites with 2.5, 2, 1.8, 1.6 wt% RGO, named as ZG-1, ZG-2, ZG-3, ZG-4 respectively1were centrifuged rinsed with deionized water, and vacuum- dried at 60°C for 24 h.
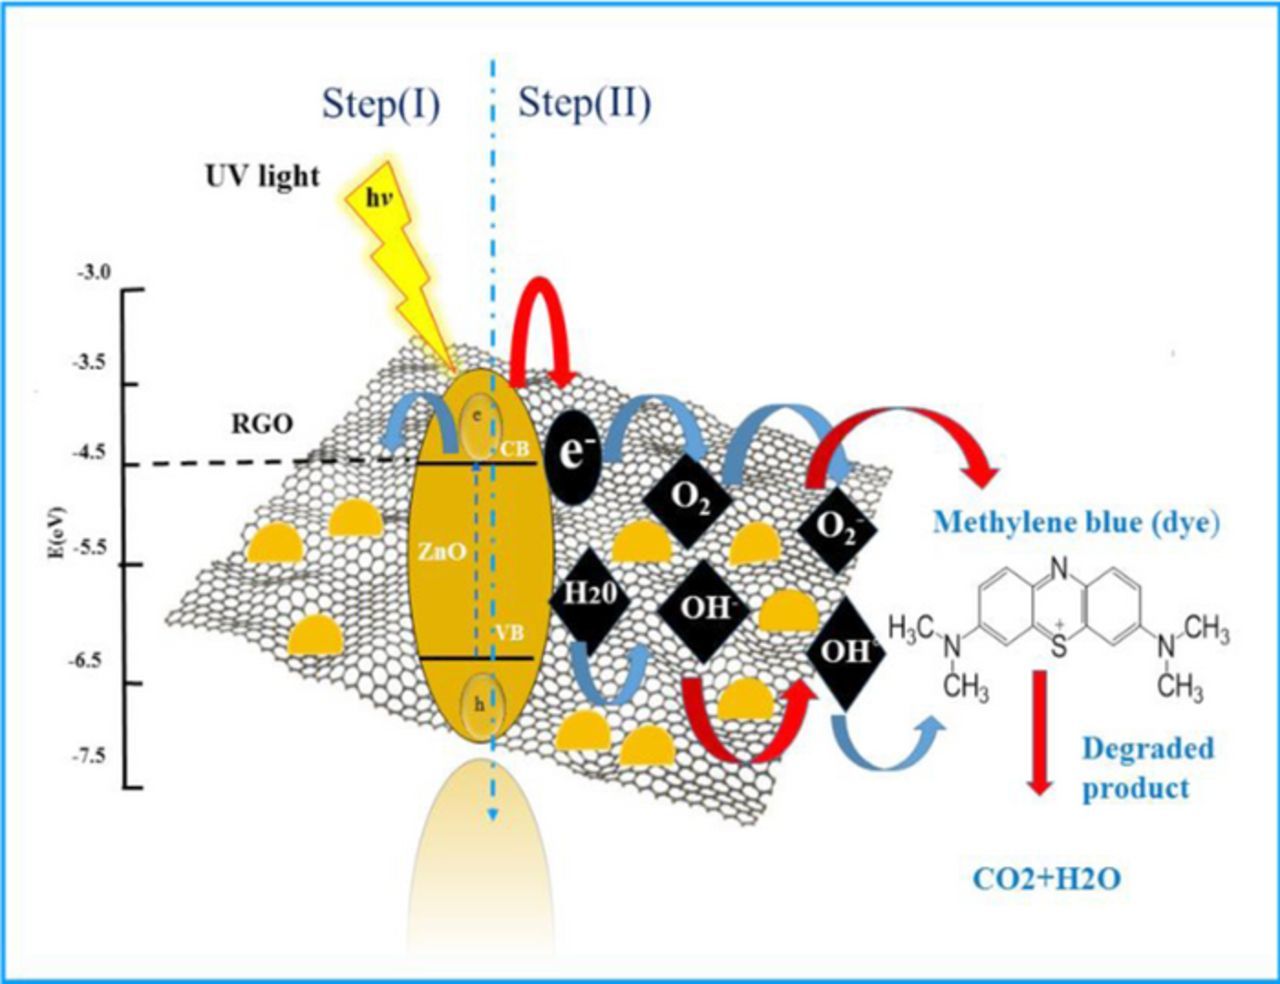
Figure 10. Schematic diagram of photocatalytic reduction reaction step (I) followed by degradation of methylene blue dye step (II) through charge transfer and separation between ZnO and GO under UV light irradiation.
Characterization
X-ray diffraction (XRD) pattern was recorded with a Bruker D8 Advance X-ray Diffractometer using Cu Kα (λ = 0.1549 nm) radiation in the diffraction angle range of 10 to 70° under a scan rate of 0.01° s−1 with an accelerating voltage of 40 kV. X-ray photoelectron spectroscopy (XPS) measurements were taken by using a spectrometer (Thermo Fisher Scientific, ESCALAB 250) with a monochromic Al Kά source at 1486.7 eV, at a voltage of 15 kV and an emission current of 10 mA.). Fourier-transform infrared (FTIR) spectra were recorded on a Nicolet 370FT-IR spectrometer using pressed KBr pellet Japan). Raman spectra were collected using an INVIA spectrophotometer (Renishaw, UK, with an excitation of 541.5 nm laser light. The light absorption properties of the sample were evaluated over the spectral region of 200–800 nm by using a UV-visible spectrophotometer (UV-1240, SHI- MADZU, Japan). Morphological analysis was performed with using Scanning electron microscopy (SEM; Hitachi S-4500), transmission electron microscopy (TEM; JEOL 2010F), and HRTEM (TENICA G2 measurements were performed at room F30 S-TWIN) All the temperature
Photocatalytic test
The photocatalytic test was performed by the photoreactor deliberated with an internal light source surrounded with a quartz jacket (500W - pressure mercury lamp through core emission wavelength of 310–400 nm). 0.05 g of the sample was dispersed in dye solution (100 ml, 10mg/l). The integrated light source striking the sample. The mixed suspension was magnetically stirred for 0.5h in darkness to reach an adsorption-desorption equilibrium between the organic molecules and the catalyst surface before exposure to irradiation. The degradation of dyes was determined by UV−visible spectrophotometer (UV-1240, SHI-MADZU, Japan). At given interludes of illumination, the samples of the reaction solution were taken out and examined.
Results and Discussion
UV-Assisted Reduction of Graphene Oxide in ZnO water ethanol system
The graphene oxide upon exfoliation carries appropriate functional groups (e.g., epoxides, hydroxyls, carboxylic acids).In the present study, we prepared a mixture of graphene oxide and ZnO in the ethanol- water system and subjected it to steady state UV Irradiation. The change in the absorption spectrum after 30 min period of UV-irradiation is shown in Figure 1A. The samples were placed in the photoreactor deliberated with an internal light source surrounded by a quartz jacket while nitrogen was bubbled through the solution. The samples were periodically examined for changes in absorption. The change in color from light brown to grayish black can be seen as the reduction of GO proceeds in Figure 1B. This color change has previously been suggested as a partial restoration of the π network within the carbon structure and has been witnessed through the chemical reduction of the GO sheets.24 The photocatalytic property of semiconductor ZnO is well researched. When ZnO was excluded during UV-irradiation from the suspension no significant changes in the absorption could be seen. This observation establishes the facilitating role of ZnO photocatalyst1under UV-light in the reduction of GO in polar solvents.25 Upon UV irradiation of a deaerated suspension of ZnO and GO in ethanol- water system, the holes are scavenging to produce ethoxy radicals one observes charge separation, thus leaving the electrons to accumulate within a ZnO nanoparticle equation(a).The accumulated electrons serve to interact with the graphene oxide sheets in order to reduce it partially equation (b).26
![Equation ([1])](https://content.cld.iop.org/journals/2162-8777/6/4/M36/revision1/d0001.gif)
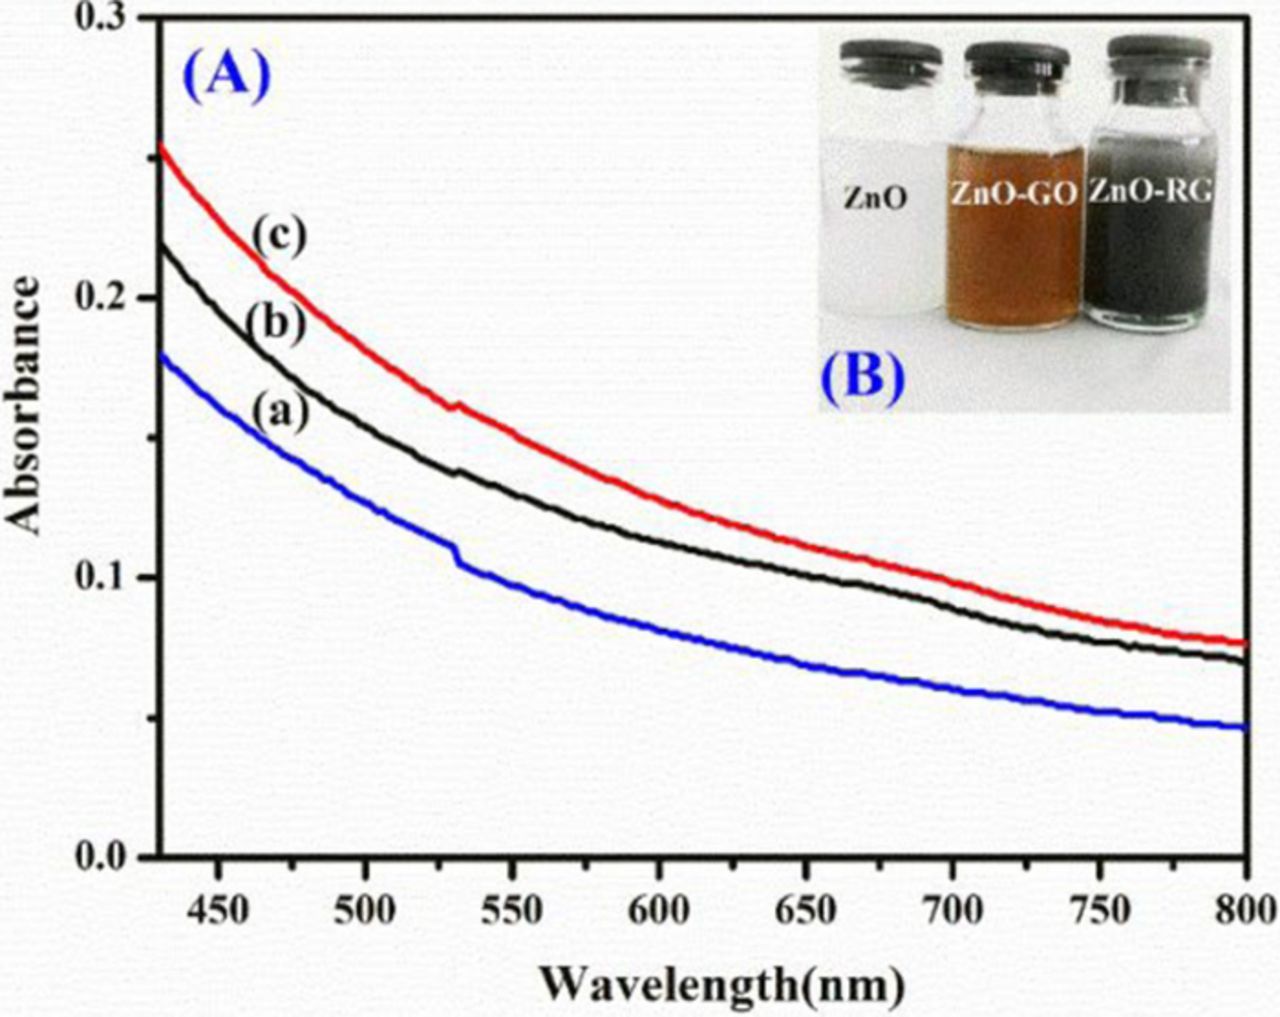
Figure 1. (A) The absorption spectra of graphene oxide and ZnO suspension in ethanol (a) before UV-irradiation, (b) after 30min, and (c) after 60 min of UV irradiation; (B) The change in color of a 10 mM solution of ZnO nanoparticles with 1.8 mg/mL GO before and after UV irradiation for 2 h.
The powder X-ray diffraction patterns of GO, ZnO and 2.5 wt% of ZnO/rGO are shown in Figure 2. The peaks of scattering angles 2θ values located at ca... 31.7°, 34.3°,36.3°, 47.6°, 56.5°, 63.0°, 66.5°,67.9°, 69.1°, can be indexed to [1 0 0] [,0 0 2], [1 0 1], [1 0 2], [1 1 0], [1 0 3], [2 0 0], [11 2]and [2 0 1] Facet crystal planes of hexagonal wurtzite ZnO (JCPDS No. 36–1451), respectively.27,28 the most intensive sharp peak (001) centered in around 2θ = 10.6°in the diffractogram of GO is due to the presence of oxygen carrying groups on the GO-surface. This peak was considerably decreased in ZnO/RGO nanocomposite.29 The nanocomposite ZG-1 and ZnO have similar XRD patterns. It may be because the regular layer stacking of GO was destroyed due to the crystal growth of ZnO between the interlayers of GO, leading to the diminishing of the diffraction peaks for GO. Therefore, XRD results propose that the ZnO nanoparticle might become attached to those GO nanosheets. This confirmed that the sample was crystalline and the presence of RGO did not result in variations in special orientations of ZnO or development of new crystal orientations.30 However, peaks associated only with ZnO are observed in nanocomposites and no peak was assigned to GO, indicating that it was reduced to graphene become attached to ZnO during the photocatalytic process.11 One is the low amount and relatively low diffraction intensity of RGO in the composites of RGO/ZnO .The other is probably due to the disappearance of the layer-stacking regularity after reduction of GO.31
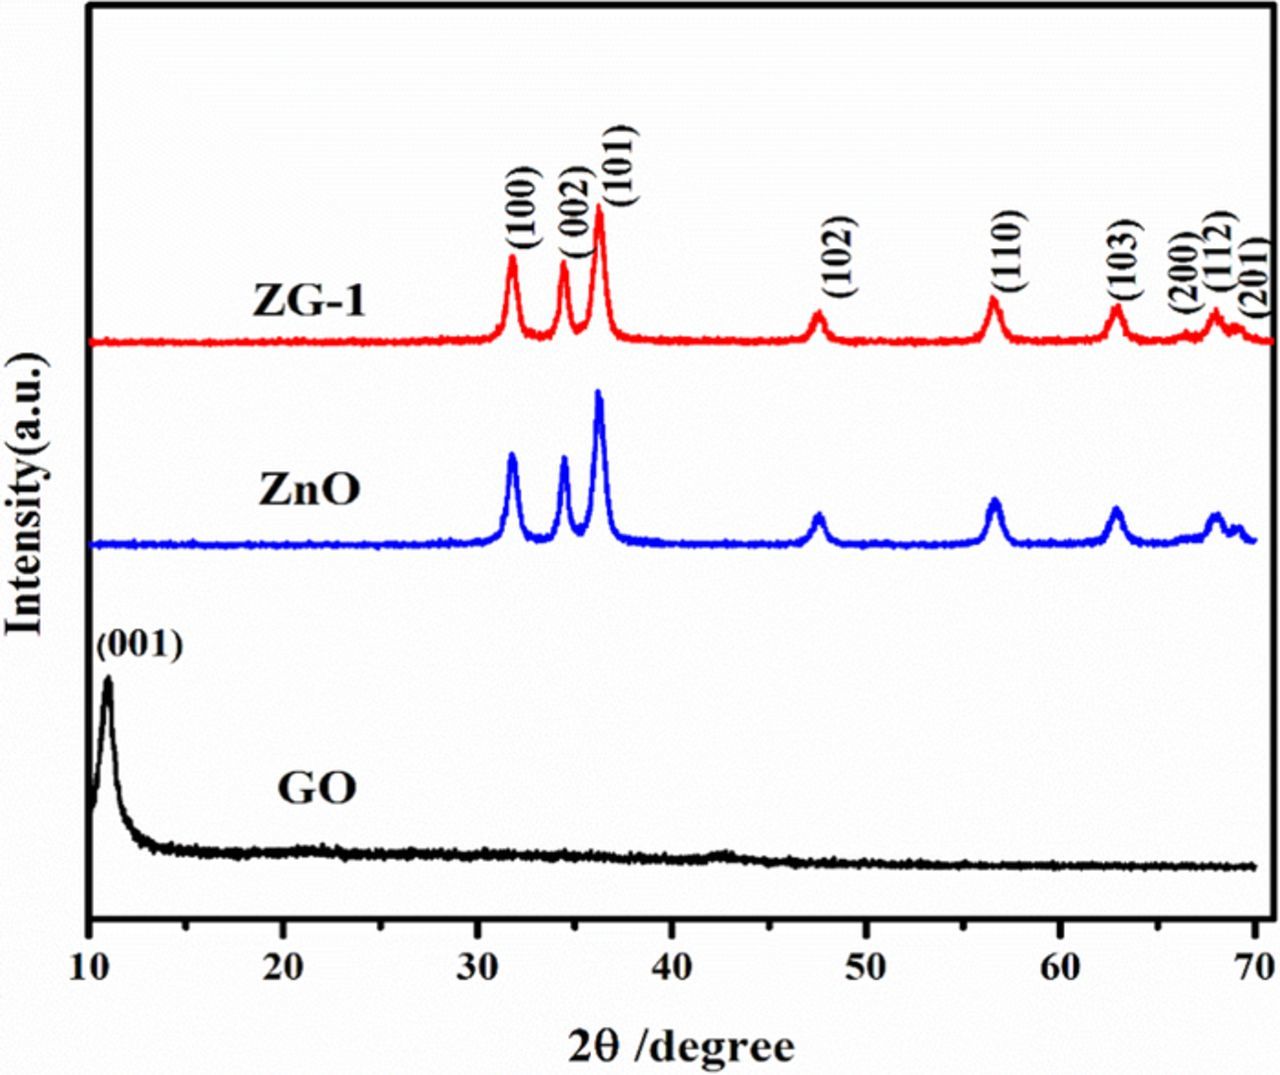
Figure 2. XRD patterns of GO, ZnO, ZnO/RGO (ZG-1 2.5wt %).
FTIR spectra of GO and ZG-1 are illustrated in Figure 3. The peak observed at 3428 cm1 assigned to OH (hydroxyl) group of absorbed water. The stretching, vibration at 1723 cm−1 represents the presence of C = O (carbonyl) group. The peaks at 1380, 1220 and 1077 cm−1 correspond to the C-OH, C-O-C, and C-O (alkoxy) vibrations, respectively.32 The peak at 470 cm−1 of RGO/ZnO nanocomposite is similar to that of pure ZnO which represent the stretching vibration of ZnO.33 It can be observed that the intensities of absorption bands of oxygen-containing functional groups such as C-O (1723 cm−1), C OH (1380 cm−1) and C- O (1220 cm−1) were dramatically reduced. However, it can be seen that the spectrum at 3400 cm−1, retains a broad absorption spectrum, which was attributed to the residual O-H groups of the RGO. These results implied that the GO in nanocomposite accompanied by a partial reduction to graphene through the photocatalytic treatment.34
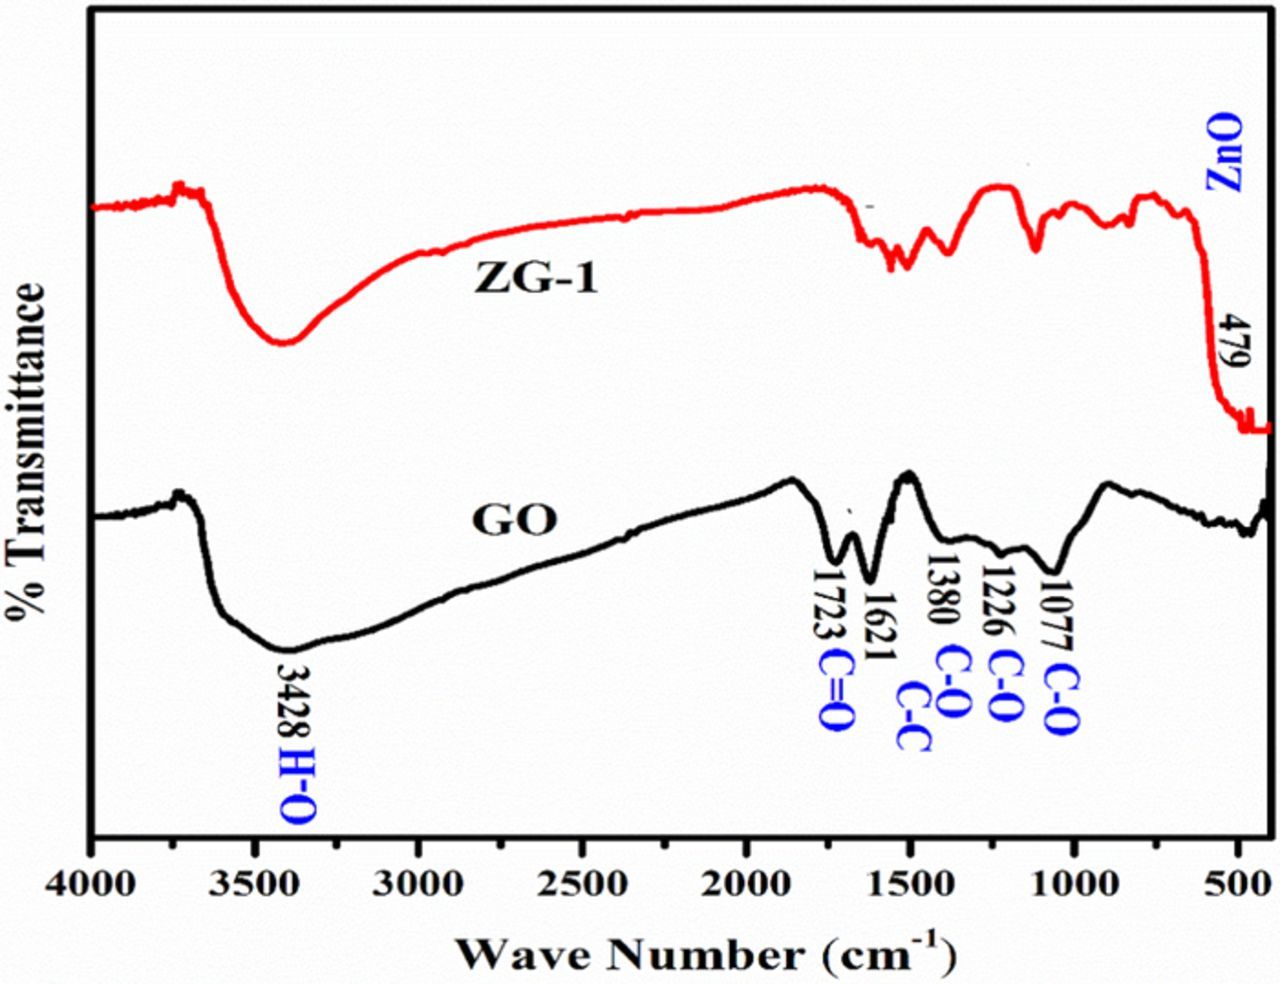
Figure 3. FTIR-transmittance spectra of GO, ZnO/RGO (ZG-1 2.5wt %).
X-ray photoelectron spectroscopy (XPS), is a surface analysis technique indicating physical attachment of the ZnO nanoparticles to the graphene oxide sheets. Figure 4a shows the XPS survey spectrum and the inset show the high-resolution spectrum of Zn 2p of the composite. Survey spectrum confirms the presence of the Zn, O, and C .the peaks at1021.3 eV and 1045.5 eV positions correspond Zn (2p1/2) Zn (2p3/2) respectively. The separation of peak energy is 23.2eV confirms the + 2 oxidation state of zinc.35 Figure 4b shows the deconvoluted O1s spectrum indicating two types of oxygen were present having the binding energies at 530.22 eV (O-C) and 531.3 eV which were associated with ZnO. Figure 4c C1s peak in the XPS spectrum shows the presence of four types of carbon bonds, that is the non-oxygenated ring Carbon at a binding energy (284.5eV)including C-C,C = C, and C-H).while the other two at higher binding energies are assigned to the carbonyl carbon in1C = O(287.8eV) and the carboxylate carbon in C-O-C,C-OH(289.0),36 indicating a remarkable degree of oxidation for the GO nanosheets. In fact, these oxygenated species on GO provides the active sites for the deposition of ZnO nanoparticles. Figures 4c, 4d for comparison with GO (C1s) the intensity of carbonyl groups is dramatically decreased in composite. On the basis of XPS results, the effective reduction of ZnO-GO through photocatalysis can be concluded.37
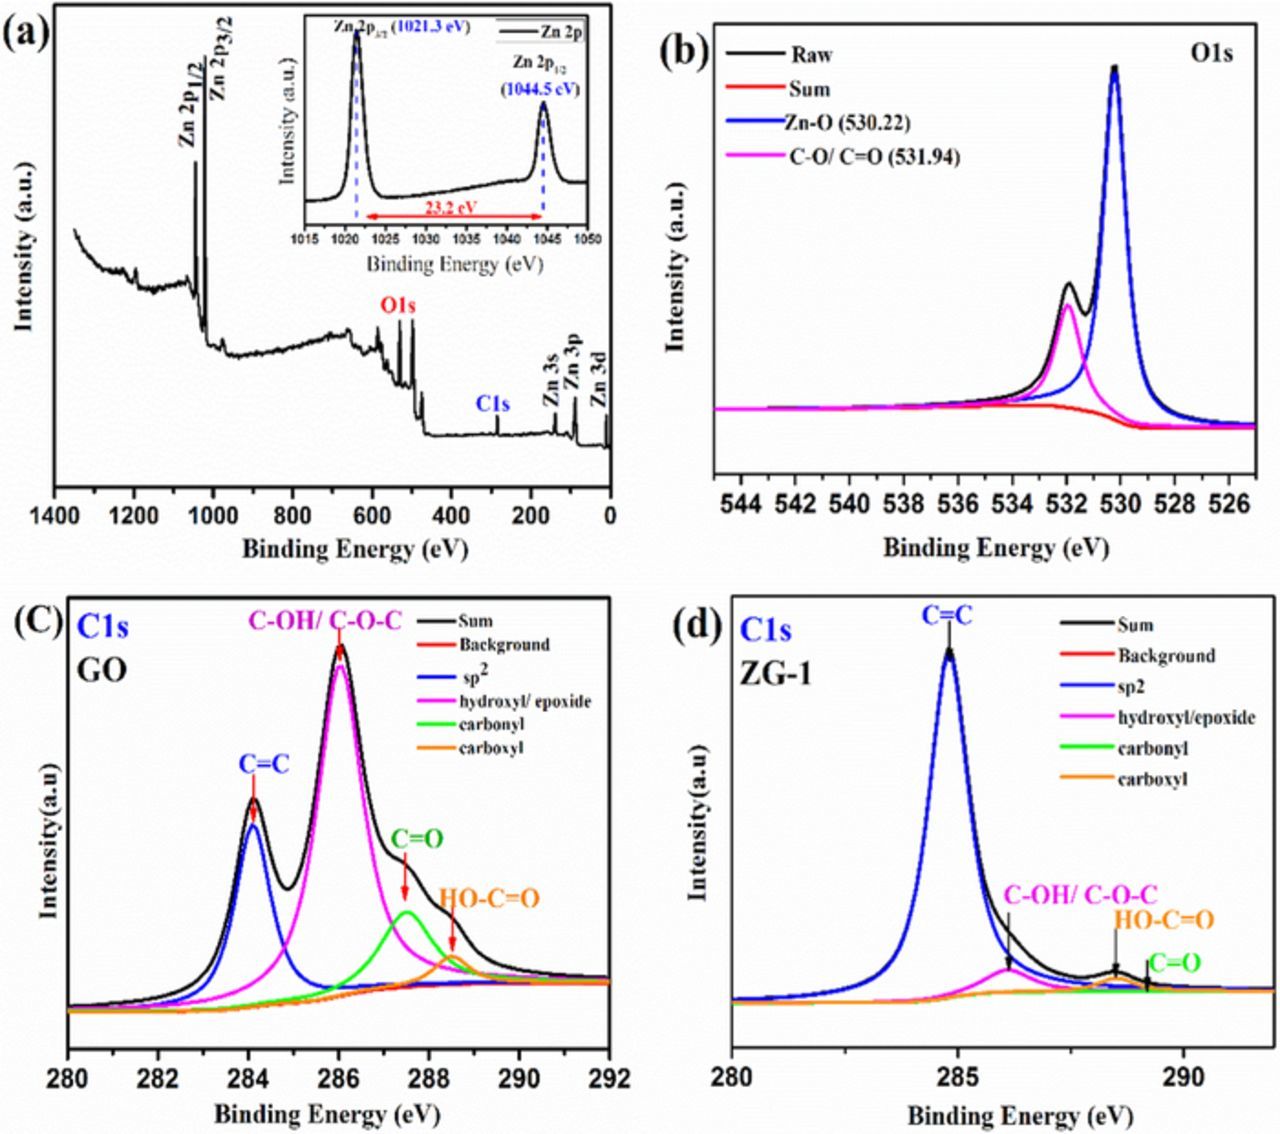
Figure 4. (a) XPS survey spectra of the ZG-1 composite (inset shows high-resolution spectrum of Zn 2p of the composite); (c) Curve fit of C1s spectra of graphene oxide; (d) Curve fit of C1s spectra of ZG-1 composite.
To unveil the morphology of GO, ZnO, ZnO/RGO we have comparatively characterized the relevant samples by a series of joint techniques (SEM), (TEM) and (HRTEM). SEM micrographs Figure 5a, 5b showed a highly agglomerated state of nanoparticles with fluffy graphene sheet morphology shows that zinc oxide nanoparticles are decorated on the surface of reduced graphene oxide via UV- assisted photocatalytic reduction. In addition, the statistical size distribution of ZnO nanoparticles is in the range of 80–100 nm for ZG-1.38 The TEM image of the sample Figures 5c, 5d shows the zinc oxide nanoparticles distribution.39 These images confirm our ability to achieve fairly uniform dispersion of zinc nanoparticles on graphene sheet the interaction of - OH and- COOH functional groups of GO with the
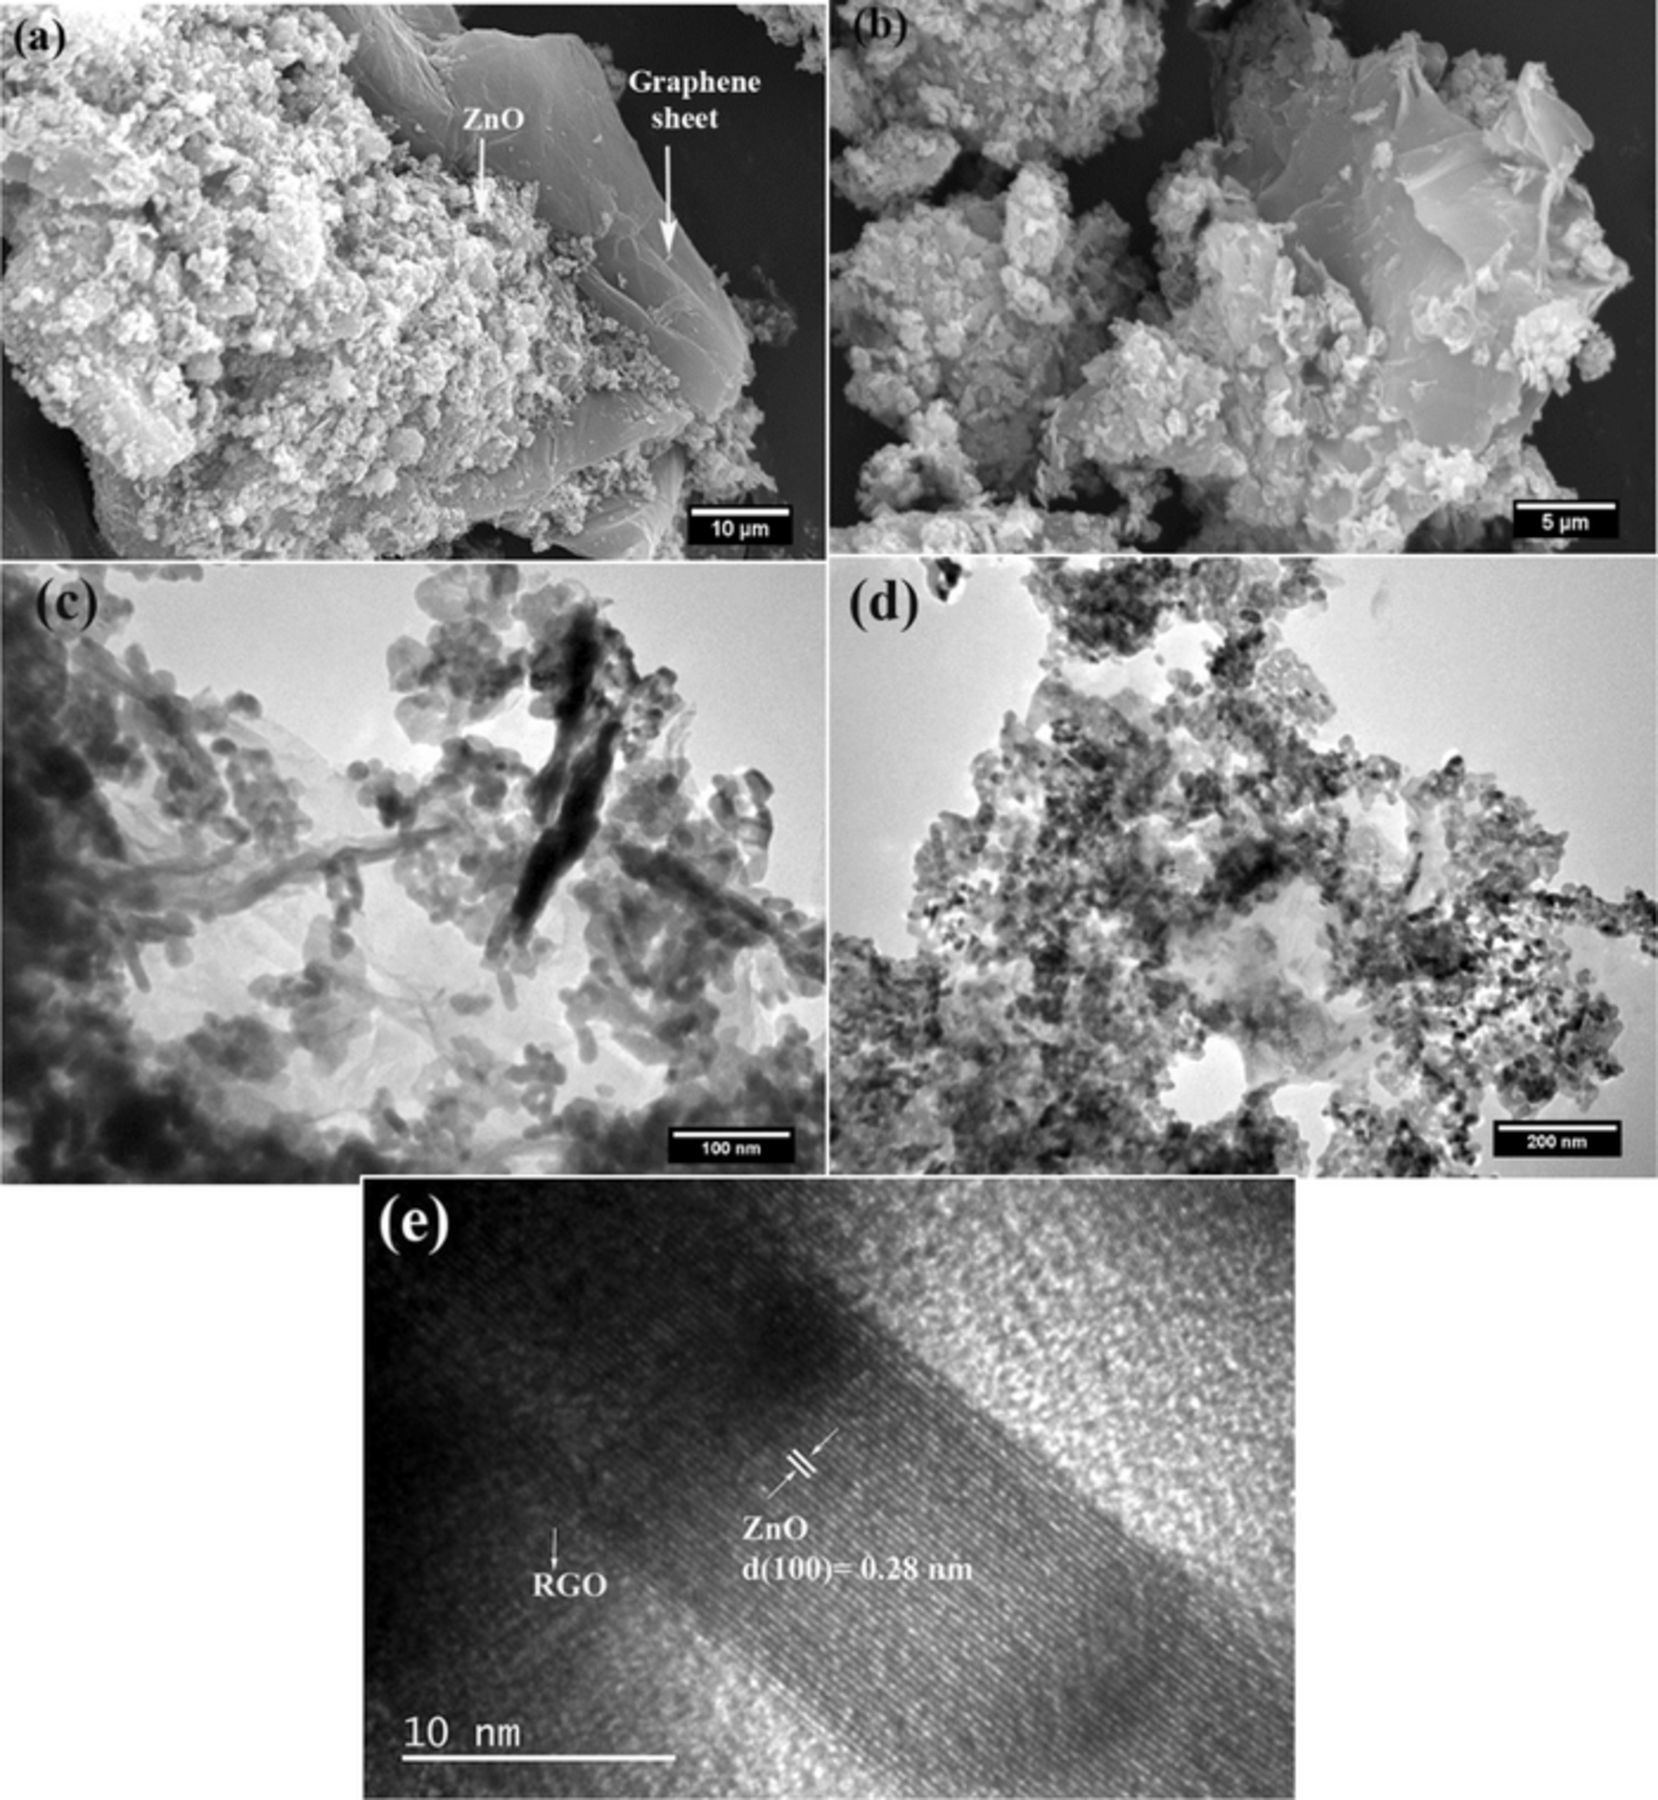
Figure 5. (a, b) SEM images of ZnO/RGO 2.5wt% (c, d) TEM images 0f ZnO/RGO 2.5wt% and (e) HRTEM image of ZnO/RGO 2.5wt%.
Semiconductors facilitate this attachment, the functional groups are reduced during the photocatalytic process. And thereby the unpaired pi electrons are more available to bind to the surface atoms of semiconductors .27 Furthermore, the high-resolution TEM (HR-TEM) images of ZnO/RGO Figure 5e, display the clear lattice fringe indicate high degree crystallinity, which is notarized to be ZnO phase by the interplanar spacing value (0.28 nm for ZnO (100) facet), Supportive with the XRD results.40 The identified reduced graphene oxide layers in the edge area of ZnO/RGO indicate the intimate interface contact between ZnO and reduced graphene oxide sheet, makes possible the electronic interaction between ZnO and graphene, and improves the charge separation and the photocatalytic activity.6 Raman spectroscopy is a reliable technique for analyzing the electronic structure of chemical compounds and is widely applied to distinguish the crystalline order/disorder and lattice defect in carbon- based material. The Raman spectra of GO and ZnO/RGO is characterized by two broad bands. The G band corresponds to the first-order scattering of the E2g mode observed for sp2 carbon domains and is, therefore, prominent in all graphite-based material, usually arise at ca.1585 cm−1.whereas the D band is attributed to a breathing mode of κ-point phonons of A1g symmetry, which is a common feature of sp3 defects in carbon and usually, can be associated with the structural defects arise at 1330 cm−1as shown in Figure 6.10 In general, the intensity ratio of the D and G band (ID/IG) is an important tool to measure the degree of disorder and the average size of the sp2 domains in carbon-based materials. The D band shifted from 1353 to 1347 cm−1.Whereas the G band shifted from 1594 to 1587 cm−1, indicating graphite oxide has been reduced to GO. The D/G ratio confirms the degree of functionalization.40 According to D/G intensity ratio of ZG-1 increased to 1.1 compared to that of GO which is 0.86.which is usually observed in reduced GO, indicating the successful transformation from GO to RGO in the composite.12
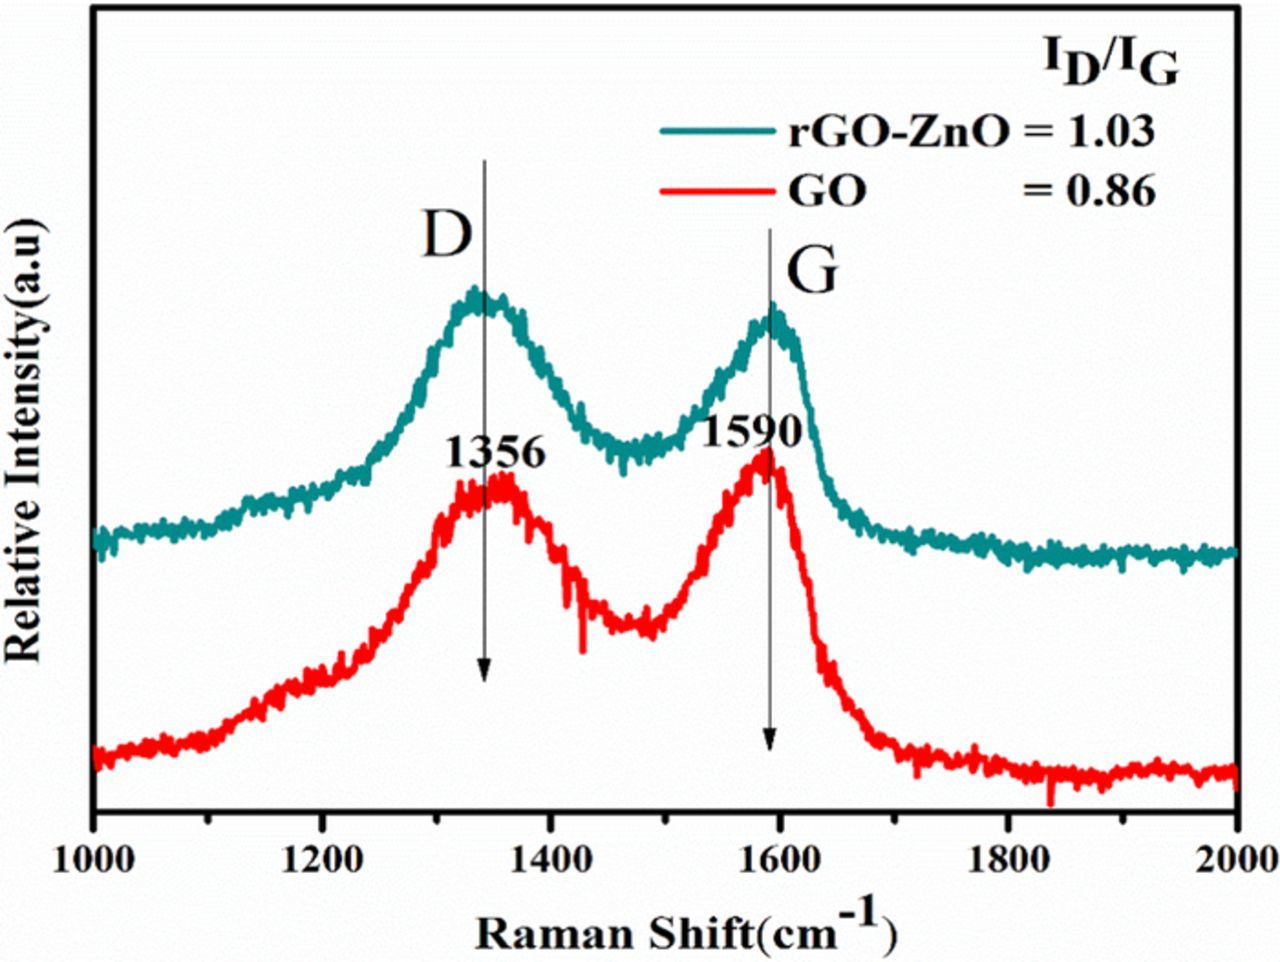
Figure 6. Raman spectrum of graphene oxide (GO) and ZnO/RGO (ZG-1 2.5wt %) composite.
The photosensitive properties of the samples were explored by UV−vis spectroscopy. The room temperature absorption spectra of pure ZnO and that of nanocomposites ZG-1, ZG-2, ZG-3, and ZG-4, respectively are shown in Figure 7. The relative intensity of the ZnO peak (∼374 nm) increases with GO loading in the nanocomposites. The sharp characteristic absorption peak at 374 nm indicates the presence of good crystalline impurity suppressed ZnO nanostructures. It is observed that and the absorbance of ZnO–RGO composite increases even in the visible light region with the increase of RGO content, which is similar to those reported in the hybridization of TiO2 with graphite-like carbon layers or RGO. Therefore, the presence of RGO in ZnO can increase the light absorption intensity and range, which is beneficial to the photocatalytic performance.20 Compared with ZnO, the ZnO/RGO nanocomposite materials show red-shift of the surface Plasmon absorption, which is due to strong interfacial hybridization between ZnO and the neighboring RGO. The redshift indicates that the bandgap energy of nanocomposite materials was less than that of pure ZnO.41 The bandgap values of the synthesized catalysts and ZnO were evaluated using Tauc plot established on UV-vis diffuse reflectance spectra and their corresponding plots are shown in Figure 8. The bandgap values were calculated using Tauc plot based on Kubelka–Munk equation. A Tauc plot was obtained by plotting (F(R) *hv)1/2 versus (hv) to the energy axis where R is the reflectance, the intercept of the plot between (F(R)*E) vs E gives the bandgap energy.42,43
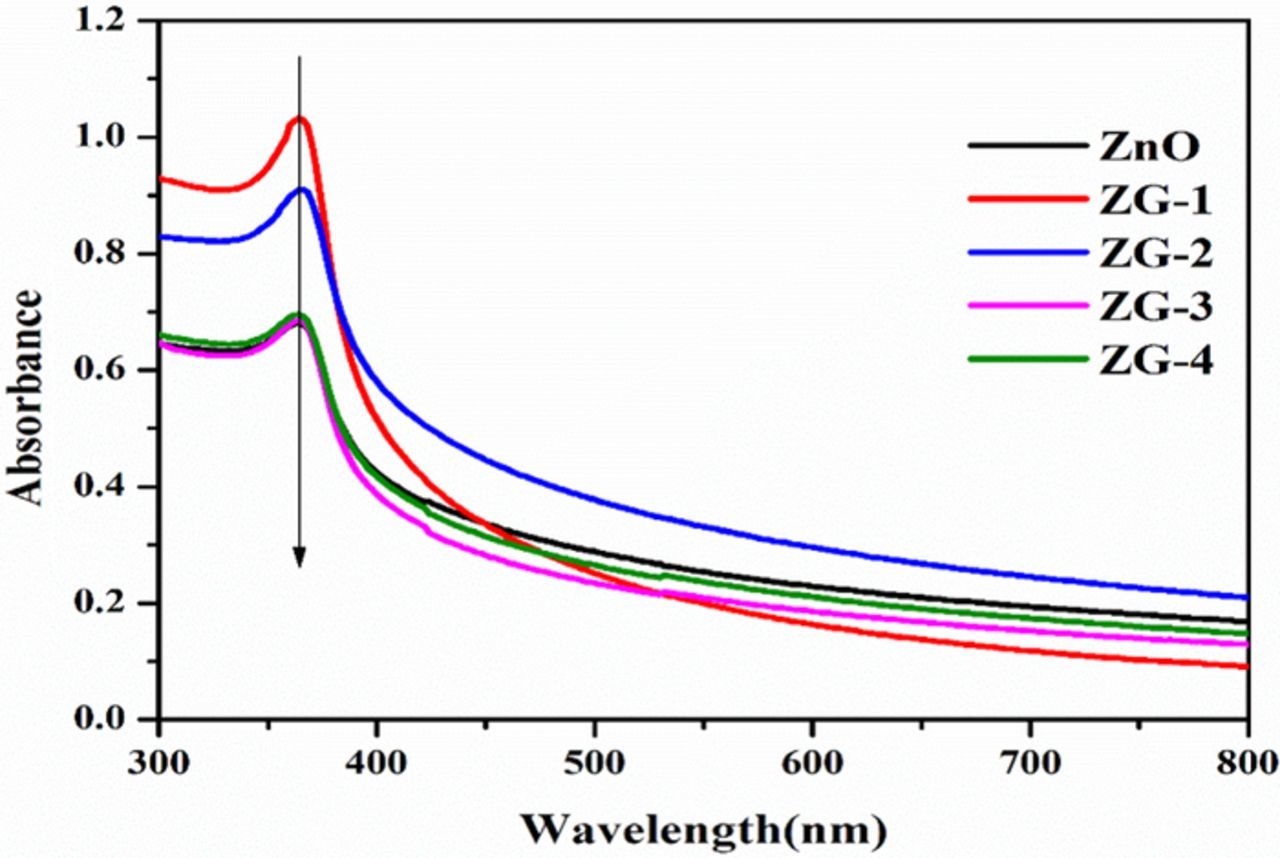
Figure 7. UV–vis absorption spectra of RGO, ZnO, ZG-1, ZG-2, ZG-3, ZG-4 and ZG-5.
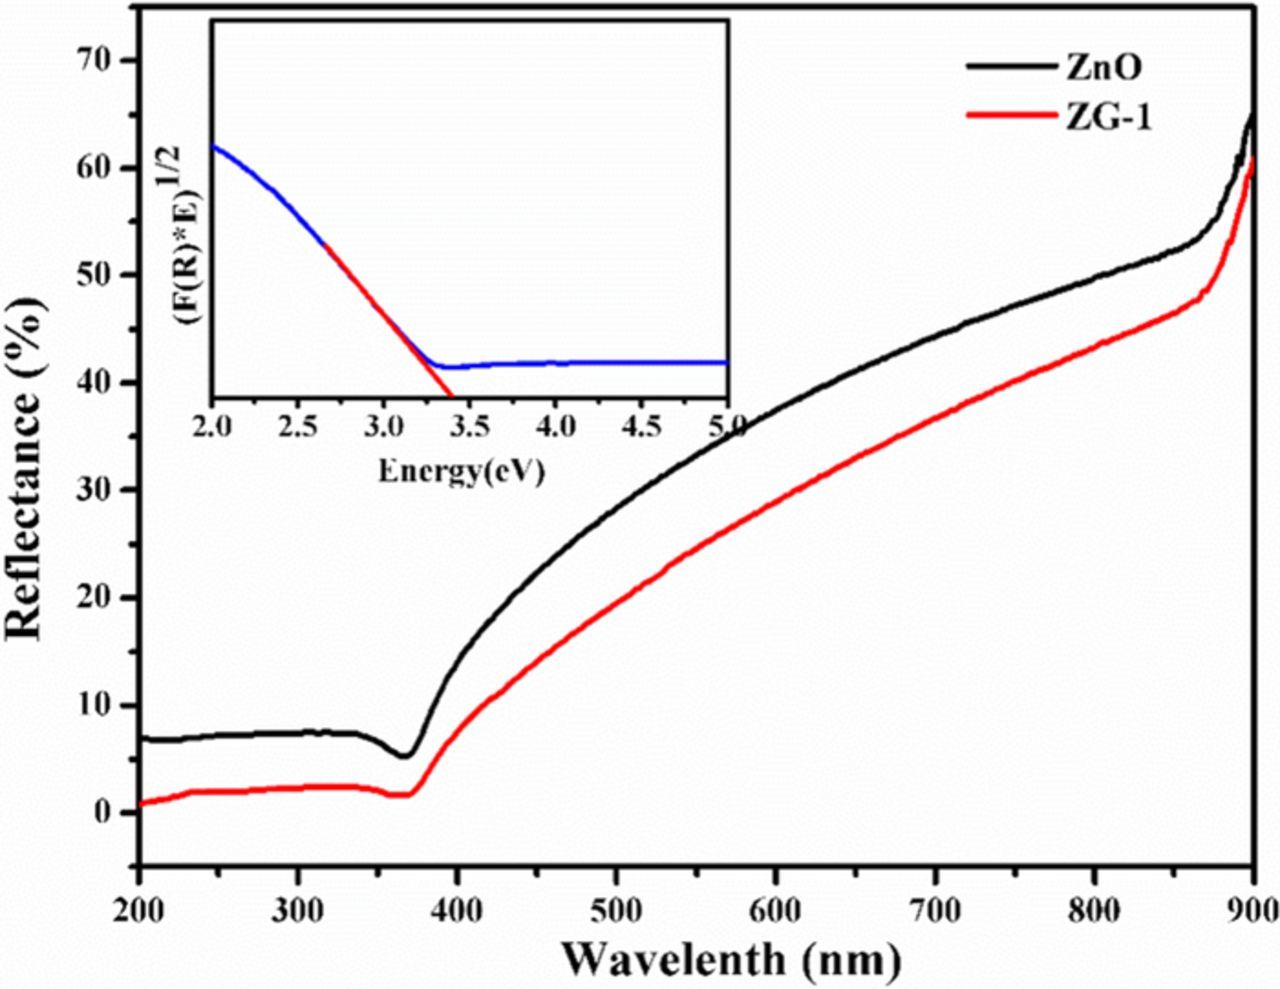
Figure 8. UV-vis diffuse reflectance spectra (UV-vis DRS). The inset shows (F(R) · hν) 1/2 vs. hν.
Band gap can be originated by passing a tangential line from side to side the edge of the curve to the x-axis. The estimated optical bandgap value ZnO/RGO nanocomposites is small when compared with ZnO catalysts are tabulated in Table I.44
Table I. Surface area, degradation efficiency, first order rate constant and optical bandgap of ZnO and ZnO/RGO.
| Sample | Specific surface area (m2.g−1) | MB degradation efficiency 120 min (%) | Rate constant (k) for MB 10−1 min−1 | Band gap (eV) |
|---|---|---|---|---|
| ZnO | 377.1 | 68 | 0.008 | 3.37 |
| ZnO/RGO | 345.3 | 80 | 0.012 | 2.93 |
The photocatalytic activity of ZnO and of the as-obtained ZnO/RGO nanocomposites with different graphene content ZG-1, ZG-2, ZG-3and ZG-4 was measured in term of MB degradation under visible light irradiation. Time course, degradation curves for MB were shown in Figure 9a. The change in the absorption peak of MB aqueous solution at 664nm showed the change of its concentration in the presence of ZnO catalyst Figure 9b. There were four different MB species found in aqueous solution the monomer (MB+), the protonated monomer (MBH+2), the dimer ((MB+2) and the trimer ((MB+3) the monomer adsorbed at 664 nm, by increasing the dye concentration dimers were formed, which produced bands at 605 nm a further increase of the concentration led to trimerization lead to the formation of a band which was noted at ∼580 nm. The concentration of MB has been reduced with increasing visible light treatment time.45 It was confirmed From Figure 9a that the photodegradation of MB has taken place in the presence of photocatalyst. Moreover, the concentration of MB was hardly reduced under UV light irradiation in the absence of the photocatalyst, it was also observed that there was very less discoloration by the pure ZnO as shown in Figure 9b, due to its larger bandgap (3.37 eV). After 120 min, the degradation efficiency was calculated to be (∼ 68%).46 Among the as- prepared samples, ZG-1 shows higher degradation efficiency increased to (∼ 80%) within a short period of irradiation 120 min as shown in (Figure 9c), which was ascribed to the bandgap narrowing of the composite material in comparison to the pure ZnO.47 The efficiency of MB photodegradation followed the order ZG-1- > ZG-2 > ZG-3 > ZnO ZG-4 > after 120min of reaction, the degradation efficiencies of MB were approximately 80%, 73%, 71%, 67% and 68%, and for ZG-1, ZG-2, ZG-3, ZG-4 and pure ZnO respectively Figure 9d. It is well known that the photocatalytic degradation of organic dyes follows pseudo first-order kinetics in this system, it can be explained by a Langmuir-Hinshelwood model.48 The obvious reaction rate constants (k) for the degradation of MB can be derived from the linear slope of the relationship between ln(C/C°) and t, where C° and C are the concentrations of initial solution and after t (min) of irradiation, and follow the order: ZG-1 (0.04 min−1) >ZG-2 (0.01 min−1) >ZG-3 (0.008 min−1) >ZG-4 (0.006 min−1) >ZnO (0.004min−1) respectively.47 Based on the slope of the linear fitted graph, the calculated k values show that the ZG-1 nanocomposite has a high degradation rate than pure ZnO,The degradation rate (D %) had a mathematical expression as follows. D% = C°- C/ C°x100 Where C° and C are the concentrations of initial solution and after t (min) of irradiation.49
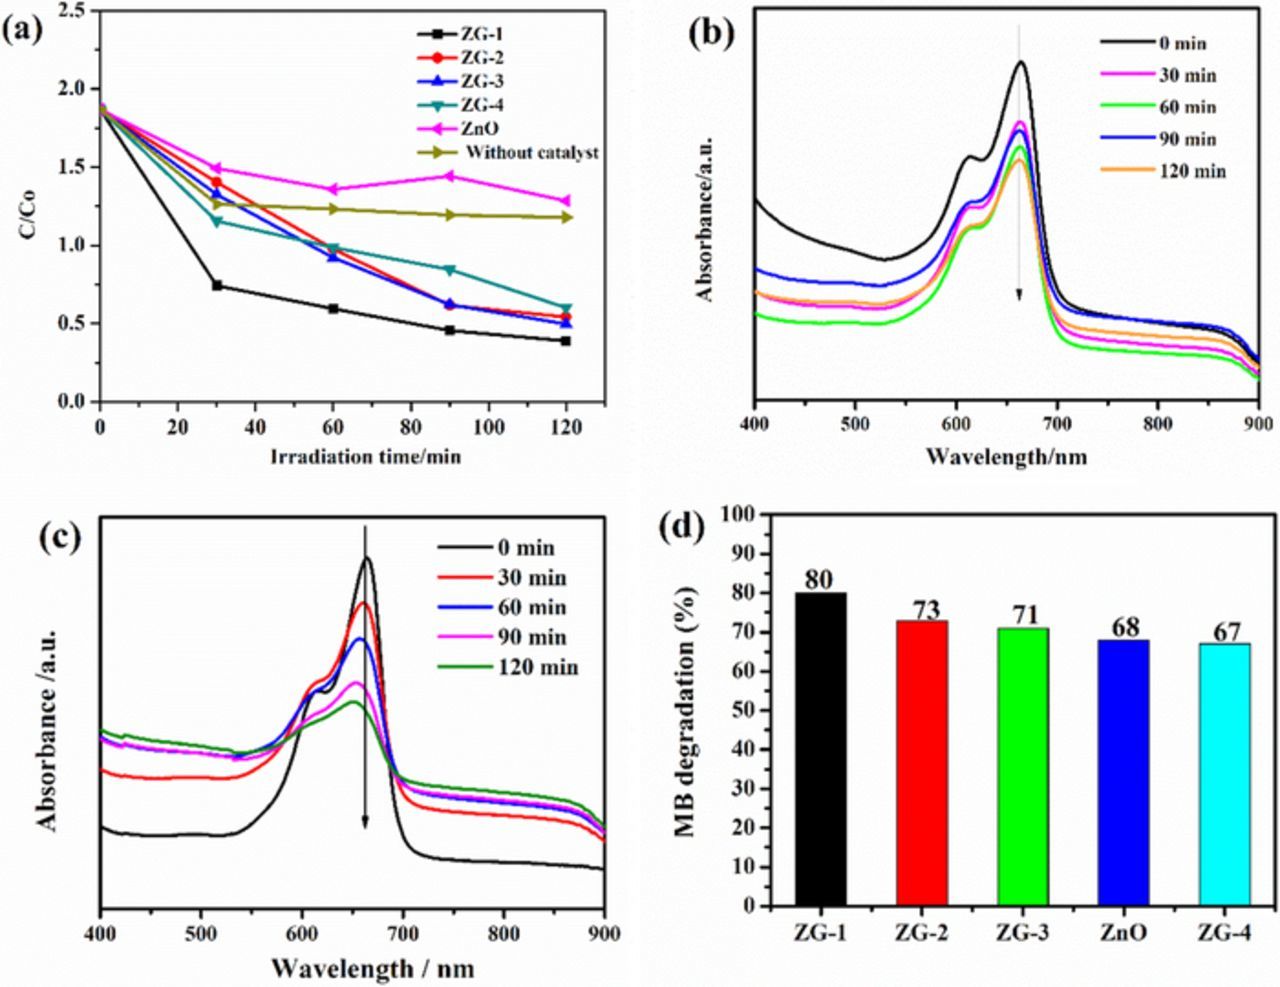
Figure 9. (a) Photocatalytic degradation of methylene blue by ZnO, ZG-1, ZG-2, ZG-3and ZG-4 observed under UV light irradiation as standardized concentration change versus irradiation time. (b) Photo degradation absorbance spectra of MB using pure ZnO.(c) photodegradation absorbance spectra of ZG-1(d)percent efficiency of MB degradation of ZG-1,ZG-2,ZG-3,ZG-4 and ZnO. The concentration of MB and photocatalysts are 10mg/l, 0.05mg/100ml MB solution respectively.
Finally, on the basis of the above results, a recommended reaction mechanism for photocatalytic degradation of MB in aqueous solution over the ZnO/RGO nanocomposite has been proposed, as pictorially illustrated in Figure 10. The strong coupling between ZnO and graphene, which supports interfacial charge transfer and impedes electron–hole recombination. The degradation of methylene blue under visible light by ZnO/RGO nanocomposite revealed a redshift of the band edge, and a significant reduction of the bandgap (2.93 eV). At the same time, the composite shows higher surface area Table I as compared to pure ZnO.50 Under UV light irradiation a high energy photon excites an electron from the valence band to the conduction band of ZnO, photogenerated electrons in ZnO move freely toward the surface of the graphene sheet which efficiently separates them and minimizes the charge recombination processes, thus enhancing the photocatalytic performances. The ( ) captured by RGO reacted with O2 to form O2·− while the holes in ZnO generate 2OH radicals. As highly reactive species, OH· and O· radicals oxidize the MB dye into the water, carbon dioxide and inorganic salts. The decrease in photocatalytic activity at the higher graphene loading amount was credited to the increased absorbance and scattering of photons through excess graphene in the photosystem and. The mechanism for the photocatalytic degradation of MB in our experiment was suggested as follows.12


Conclusions
We present a UV-assisted photocatalytic reduction method for the synthesis of ZnO/RGO nanocomposite using ZnO semiconductor in ethanol-water suspension, employing the use of several characterization tools to evaluate the degree of GO reduction of the resulting composite. XPS and FTIR spectroscopy show a significantly reduced degree of oxygen containing functionalities. Owing to the above characteristics, as an efficient nanocomposite ZnO/RGO, presents an excellent performance for the degradation of methylene blue than ZnO. The photocatalytic tests reveal that the incorporation of GO can enhance the photocatalytic performance. The photocatalytic performances were found to depend on the amount of RGO associated to ZnO. The ZnO/RGO nanocomposite with 2.5 wt% GO was found to achieve the highest (∼80) removal of MB of under UV-light irradiation after 120 min. These improvements for the enhanced photocatalytic activity of the ZnO/RGO nanocomposite, can be attributed to the enhanced charge transportation and separation, the suppressed charge carrier's recombination, longer electron lifetime, and the enhancement of the light absorption. These encouraging results would provide useful strategies for the utilization of multifunctional roles of graphene toward designing advanced photoactive graphene semiconductors.
Acknowledgments
We gratefully acknowledge the support of this study by the National Natural Science Foundation of China (No.21501104) the Natural Science foundation of Heilongjiang Province (B2015014). The authors declare no competing financial interest.