Abstract
Membrane electrode assembly durability is explored for polymer electrolyte membrane electrolyzers, focusing on catalyst (iridium, Ir) degradation at low loading and dynamic operation. Low catalyst loading and high cell potential are critical to observing durability losses over reasonably short experiments, regardless of test profile. While small losses are seen during steady operation, cycling greatly accelerates performance decreases. Ir dissolution mechanistically drives performance loss, thinning the anode catalyst layer and resulting in increasing kinetic losses during extended operation. While morphological changes to the catalyst layer are found, increasing polarization resistance suggests that degradation at the catalyst/ionomer/membrane interface may also contribute. Electrolyzer operation with model wind and solar profiles results in less severe performance losses compared to triangle- and square-wave potential cycling due to the lower cycling frequency of the renewable profiles. However, in both cases kinetics dominated the loss, indicating that higher cycling rates accelerate loss and can be used to project the impact of intermittency on device lifetime. These results suggest that performance losses impact electrolyzers' abilities to operate with low catalyst loading and intermittent inputs, and that a combination of component development and system controls are needed to limit potential and performance loss.
Export citation and abstract BibTeX RIS

This is an open access article distributed under the terms of the Creative Commons Attribution Non-Commercial No Derivatives 4.0 License (CC BY-NC-ND, http://creativecommons.org/licenses/by-nc-nd/4.0/), which permits non-commercial reuse, distribution, and reproduction in any medium, provided the original work is not changed in any way and is properly cited. For permission for commercial reuse, please email: oa@electrochem.org.
Electrochemical water splitting is currently a relatively small contributor to hydrogen production and energy consumption overall. In the United States today, hydrogen accounts for approximately 2% of used energy, the overwhelming majority of which is produced from steam methane reformation. Opportunities for increased hydrogen use exist, however, particularly when shifting electrolysis from retail electricity to direct coupling with low cost renewable power sources.1 Although most electrolysis costs are currently associated with the feedstock power, capital cost becomes dominant at lower electricity cost and reduced capacity as high levels of renewable energy intermittently become available, and lowering catalyst loading from several milligrams of platinum group metals per square centimeter to tenths becomes necessary.2 Although commercial electrolyzers are durable as operated today (primarily steady-state), these systems do not meet hydrogen production cost target necessarily for many applications and the thick high-loaded catalyst layers mask component degradation.3–5 As electrolysis shifts to low loading with intermittent power, efforts are needed to understand how these factors impact durability and electrolysis-based hydrogen production cost.6
In proton exchange membrane (PEM) electrolyzers, iridium (Ir) -based catalysts are typically used at the anode in the oxygen evolution reaction (OER) due to activity (higher than platinum) and durability (higher than ruthenium).7–9 Rotating disk electrode (RDE) durability studies have evaluated the relative stabilities of materials, assessed catalyst degradation mechanisms, and established screening techniques for approximating catalyst durability.7,8,10,11 Catalyst development efforts have also addressed durability, often by adding supports or components that are more stable than Ir (e.g. platinum).12–16 In single-cell studies, researchers have suggested standard protocols for evaluating membrane electrode assembly (MEA) performance and durability.17–20 Various efforts have used MEA durability to assess the potential benefits of novel catalysts and other components.21–27 Several publications focused on durability at low catalyst loading and intermittent operation, including their effect on cell performance, Ir dissolution, and the catalyst layer structure.11,18,19,28
This paper evaluates MEA durability in PEM electrolyzers, focusing on anode catalyst losses at low loading and intermittent operation. These studies are critical in assessing how long-term performance will be affected as electrolysis shifts toward intermittent renewable power input with reduced system cost to meet hydrogen production cost targets. The performance losses observed can provide metrics to component development efforts, including the type and degree of stressor needed to assess durability and the extent that performance improvements are needed to avoid high potential and loss. Durability data further allows cost analysis to assess electrolyzers' abilities to operate with low loading and intermittent input, and both component development and system control may be needed to limit cell potential and performance loss.
Experimental
MEAs (25 cm2) were prepared as catalyst coated membranes, by spraying directly onto Nafion 117. Cathode catalyst layers contained Pt on high surface area carbon (Pt/HSC, Tanaka Kikinzoku Kogyo, TEC10E50E) with an ionomer to carbon ratio of 0.45:1. Anode catalyst layers contained unsupported Ir oxide (Alfa Aesar, product number 43396) with an ionomer to catalyst ratio of 0.27:1. Pt cathodes had a constant catalyst loading of 0.1 mgPt cm‒2; Ir anode loadings were varied between 0.1‒0.4 mgIr cm‒2 to evaluate the effect of loading on durability losses. Following spraying, the coated membranes were hydrated and dried (50°C) on a vacuum plate overnight to ensure uniform contact and compression during cell assembly. MEAs were assembled with carbon (Toray) transport layers and flow fields (Fuel Cell Technologies) at the cathode, platinized titanium transport layers and flow fields (Giner Inc.) at the anode, and Fuel Cell Technologies hardware.
MEAs were tested with Greelight test stands at 80°C, water flow to the anode at 0.3 L min‒1, and no back pressure. Cells were conditioned by a 1 h hold at 0.2 A cm‒2, a 1 h hold at 1 A cm‒2, a 30 min hold at 2 V, a 2 h hold at 1.7 V, and a 30 min hold at 2 V. Galvanostatic polarization curves were then taken anodically then cathodically with a 5 min step duration and the potential averaged over the last min. Cyclic voltammograms were completed in the potential range 0.025‒1.3 V to measure catalyst surface area and impedance at 1‒100,000 Hz for the current densities used in the polarization curves.
Durability was evaluated by potential. Current density as a catalyst durability metric created challenges translating to other cell configurations and cell potential and durability results would change when applying back pressure or when using different (thinner/thicker) components such as membranes and transport layers. Potential was therefore used since it dictated catalyst dissolution rates and allowed for a guide of electrolyzer catalyst durability across different operation parameters and material sets.
A variety of factors were evaluated in MEA durability, including the anode catalyst loading, stressor type (hold, triangle-wave, square-wave, Figure S.1a‒c), stressor severity (peak potential), experiment duration (0‒31.5 k cycles), cycling frequency, potential ramping (sawtooth, easing square-waves), and renewable inputs. Potential holds, triangle-waves, and square-waves were tested at different catalyst loadings (0.1, 0.2, and 0.4 mgIr cm‒2) and upper potentials (1.6, 1.8, 2, 2.2, 2.5 V). These experiments were completed for 525 h (31.5 k cycles) with polarization curves and cell diagnostics (cyclic voltammograms, impedance) taken every 75 h. Sawtooth profiles were used to evaluate the effect of sudden potential increases and decreases (Figure S.1d, S.1e). The sawtooth-up profile consisted of a sudden increase 1.45‒2 V and a gradual decrease to 1.45 V; the sawtooth-down profile consisted of a gradual increase 1.45‒2 V and a sudden decrease to 1.45 V. Cycling frequencies of 10, 30, 60 and 120 s were investigated. Ramp times from 1.45–2 V (or the inverse) were 5, 10, and 15 s, and were used to assess the ability of system controls to mitigate loss and address durability differences between triangle- and square-wave testing. Model renewable inputs for wind and solar sources were adapted from the National Wind Technology Center M2 Tower at 50 m on January 30, 2018 and from the National Renewable Energy Laboratory PVDAQ Site 51 on April 1, 2018, respectively, and representative of an average day. These inputs were translated to potentials to compare to triangle- and square-wave tests and were modeled to keep the upper (2.25 V), lower (1.45 V), and average (1.70 V) potentials the same. Once the inputs (speed in wind, power in solar) were translated to electrolyzer potential, the potential every 30 min was compiled to form test profiles 24 h in duration and experimentally repeated for 90 days. Polarization curves and cell diagnostics (cyclic voltammograms, impedance) were taken every 3 days for the experiment duration.
Cell diagnostics and polarization curve analysis were used to examine the sources of MEA performance loss. Ohmic/resistance loss was determined from high frequency resistance (HFR) and the difference between polarization curves uncorrected and corrected for internal resistance. Transport loss was determined from the difference between polarization curves corrected for internal resistance and Tafel slopes. Limitations due to anode and cathode kinetics were approximated by the OER (Ir oxide, 1.7 × 10‒6 A mgIr‒1) and HER (Pt/HSC, 0.55 A mgPt‒1) exchange current densities, determined in RDE half-cells. Impedance data was fit to Randles cell equivalent circuit models to study changes to the HFR, polarization resistance, and capacitance over time.29–31
The anticipated dissolution rate of Ir oxide at various potentials (1.4, 1.45, 1.5, 1.55, 1.6, 1.7, 1.8, 1.9, 2 V) was calculated based on inductively coupled plasma-mass spectrometry (ICP-MS) data from RDE studies. Ir oxide was coated at a loading of 17.8 μgIr cm‒2 onto polycrystalline gold electrodes by previously published methods.10 Coated electrodes (working) were tested in a three-electrode cell with an Autolab PGSTAT302N potentiostat (Eco Chemie, Metrohm Autolab B.V.) using a gold counter electrode and a reversible hydrogen electrode (RHE) connected to the main cell with a Luggin capillary. Experiments were completed by holding potential for 5 days while the working electrode was rotated at 2500 rpm in 0.1 m perchloric acid (ACS grade); aliquots taken periodically (5 min, 30 min, 1 h, 4 h, 13.5 h, 24 h, 48 h, 120 h) for ICP-MS. ICP-MS measurements were completed with a ThermoScientific iCAP Q that was calibrated to a blank, internal standards, and three Ir standards at concentrations of 2, 20, and 200 ppb. The ICP-MS calibrations resulted in a detection limit of less than 5 ppt and the measurements had a standard deviation of less than 2%. Total dissolved Ir was calculated based on the Ir concentration in the electrolytes (ICP-MS) and the aliquot volume (2.5 ml). A dissolution rate at each potential (ng s‒1) was calculated from the slope of the total dissolved Ir and experiment duration, and the cycle time (60 s per cycle). This data, dissolution rate as a function of potential, was fit (polynomial, R2 = 0.9992) and used to calculate the anticipated dissolution rate for each test protocol based on the time (ramp or hold) spent at given potentials. The dissolution rate in RDEs does not match MEAs due to differences in loading and interfacial contact, nor does it account for potential nonuniformities or gradients in the MEA catalyst layer. It does, however, provide a relative value for dissolution expectations based on the applied cell potential.
Post-characterization of the electrode layers was performed to evaluate the changes to the catalyst and electrode structure. The samples were cut in a liquid-nitrogen bath to ensure clean cross-sectional images. The fractured surfaces were analyzed using a FEI Quanta 45 scanning electron microscope (SEM) with an accelerating voltage of 5 kV. Either a secondary or backscatter electron detector was used, when necessary, to obtain optimal contrast between the membrane and catalyst layers. X-ray fluorescence (XRF) was used to quantitate the catalyst loading on the MEA. A QUANT'X energy dispersive XRF spectrometer (Thermo Fisher Scientific) with a 3.5 mm aperture, an aluminum filter, an accelerating voltage of 12 kV, a tube current of 1.98 mA, and a scan duration of 1 minute/point, was calibrated using 3 thin film standards (Micromatter, Canada) with a linear calibration curve with R2 >0.99, which was used for all XRF measurements. Focused ion beam (FIB) was used to evaluate catalyst layer structure changes, including the electrode porosity. The FIB was a FEI Helios 600 FIB/SEM system with a 5.0 kV electron beam and 30 micron aperture.
X-ray diffraction (XRD) used to quantify changes in catalyst particle size. Catalyst was removed from the MEA by scraping the catalyst layer with a knife edge, removing as much of the catalyst layer as possible (approximately 90%). After scraping, XRDs of the catalyst powder were performed and fitted to determine volume weighted average particle size and particle size distribution. XRDs were performed in a Siemens/Bruker D5000 unit with a graphite diffracted beam monochromator Kα1 and Kα2. Shadow (MDI) software was used for whole profile fitting and data analysis. The X-ray scattering of the Ir catalyst and/or Pt catalyst and carbon support plus residual recast Nafion ionomer were simultaneously convoluted and a least squares minimization fitting routine was used to obtain the best fit for catalyst lattice parameter, concentration, and particle size. Particle size distributions were obtained by Warren-Averbach analysis (WINFIT) of the Pt catalyst diffraction peak profiles. The (111), (200), (220), (311) and (222) Ir or Pt reflections where fit using Pearson VII functions and Fourier transformed to obtain particle size distributions.
Results and Discussion
MEA durability was probed with constant and cycled (triangle- and square-wave) input based on potential. Although potential and current in electrochemical systems are obviously linked, potential drives catalyst dissolution rates and durability.9 Evaluating current density as a catalyst durability metric creates challenges translating to other component/cell configurations since potential at a set current density would change when applying back pressure, using thinner (membrane/transport layers) components, or higher/lower performing materials, including catalysts, diffusion media, and flow fields/separators.21–24,32,33
Extended MEA testing focused on catalyst layer degradation and the degradation mechanism due to steady-state and intermittent electrolyzer operation, and several choices were made to minimize other degradation processes (Supporting Information). Other cell components including the membrane,34 separators/porous transport layers (PTLs),22,35–37 and other degradation processes including start/stop operation (back pressure and hydrogen crossover),38–40 contaminants,41 layer thicknesses (potential gradients), and transport limitations (PTLs, water access)42,43 can contribute to electrolyzer loss over time. Testing aimed at evaluating each of these loss sources may be necessary to project device lifetime. These aspects, however, were avoided in this effort to maintain focus on catalyst degradation, evaluating the effect of intermittency and dynamic loading on catalyst durability, and to establish baseline single-cell durability as a first gate in catalyst development efforts.
By minimizing other degradation sources and mechanisms, durability testing focused on the catalyst layer and the stressors applied (type, extent, time). In addition to steady-state potential operation, triangle- and square-wave cycles were used to evaluate gradual and sudden increases in the applied load (Figure 1). Throughout these tests, several trends were observed. First, low catalyst loading (<0.4 mgIr cm‒2) and exposure to high potential (>1.8 V) was necessary to observe performance losses (Figure 2). During the potential hold, higher loading (≥0.4 mgIr cm‒2, Figures 1a, 1d, and 1g) masks any performance loss regardless of the applied potential, from 1.6 to 2.5 V.11,21 While the degradation did not depend on loading, thicker catalyst layers may have provided a buffer that delayed the onset of performance losses.21 Conversely, lower loading (0.2 mgIr cm‒2, Figures 1b, 1e, and 1h; 0.1 mgIr cm‒2, Figures 1c, 1f, and 1i) accelerated performance loss observations, likely due to thinner catalysts that less effectively masked Ir dissolution. At a hold of 2 V, a loading of 0.4 mgIr cm‒2 resulted in a 0% loss (at 2 V, 2.90 A cm‒2, Figure 1a); loadings of 0.2 and 0.1 mgIr cm‒2, however, resulted in losses of 1% (at 2 V, 2.88 to 2.86 A cm‒2, Figure 1b) and 5% (at 2 V, 2.86 to 2.72 A cm‒2, Figure 1c) respectively. Higher potential was also necessary to induce loss and exposure to mild potential (1.6 V) resulted in no or small performance changes regardless of the test profile used. Performance losses increased when the MEA was exposed to higher potential for each profile and loading evaluated, likely since the Ir dissolution rate increased with potential.10,44 Second, intermittent input resulted in higher loss rates even though less time was spent at elevated potential. At a loading of 0.1 mgIr cm‒2, continual operation at 2 V resulted in a 5% loss (at 2 V, 2.86 to 2.72 A cm‒2, Figure 1c). With triangle- and square-wave tests, however, the losses were 19% (at 2 V, 2.86 to 2.31 A cm‒2, Figure 1f) and 30% (at 2 V, 2.86 to 2.00 A cm‒2, Figure 1i).

Figure 1. Steady-state potential holds of MEAs with Ir-loadings of (a) 0.4, (b) 0.2, (c) 0.1 mgIr cm‒2. Potential-based triangle-waves of MEAs with Ir-loadings of (d) 0.4, (e) 0.2, (f) 0.1 mgIr cm‒2. Potential-based square-waves of MEAs with Ir-loadings of (g) 0.4, (h) 0.2, (i) 0.1 mgIr cm‒2.Performance data was presented in terms of current density at 2 V, initially and following 75, 150, 225, 300, 375, 450, and 525 h, corresponding to 4.5, 9, 13.5, 18, 22.5, 27, 31.5 k cycles (triangle- and square-waves). Potential holds were completed at 1.6, 1.8, 2, 2.2, and 2.5 V. Triangle- and square-waves were completed at a lower potential of 1.45 V and an upper potential at 1.6, 1.8, 2, 2.2, and 2.5 V.
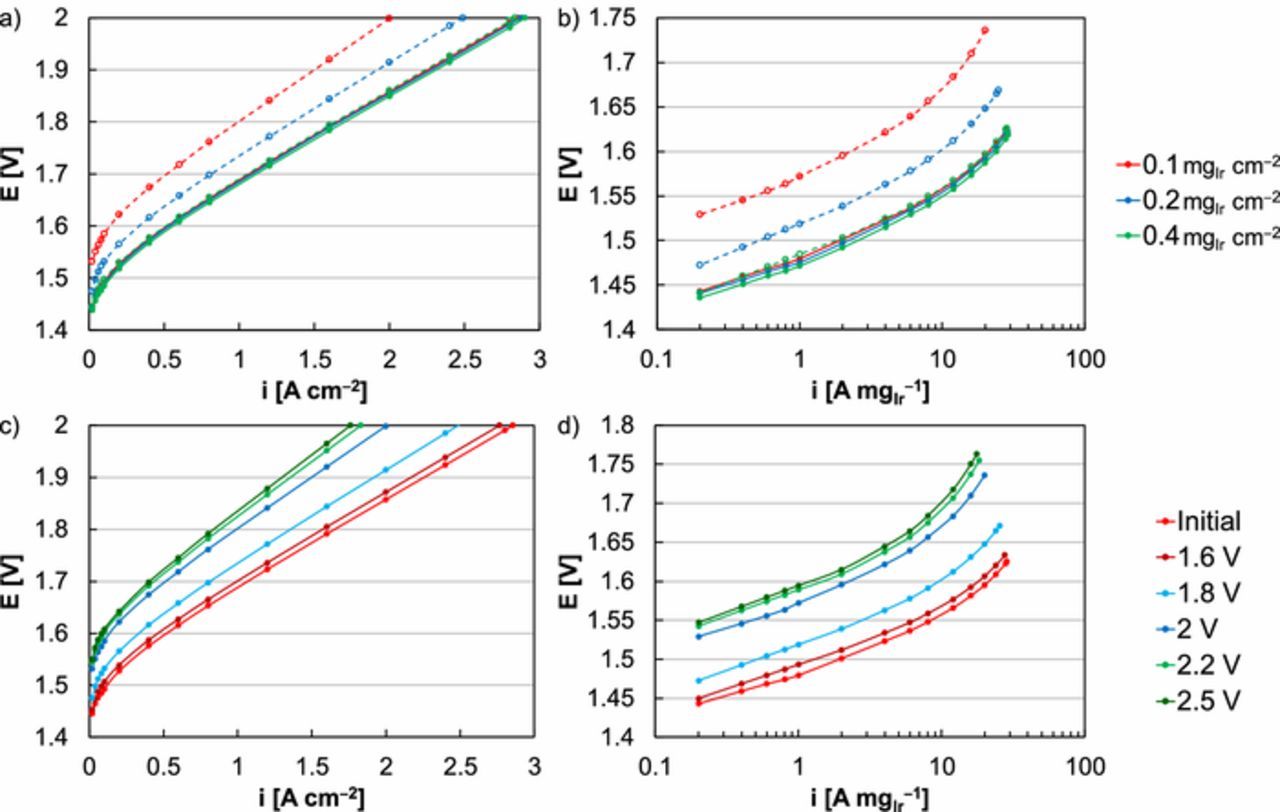
Figure 2. Comparisons of initial MEA polarization curves (solid) and after 31.5 k square-wave cycles (525 h, 1.45‒2 V) at anode loadings of 0.1 (red), 0.2 (blue), and 0.4 (green) mgIr cm‒2, with a focus on (a) overall performance (not corrected for resistance, HFR) and (b) kinetic performance (corrected for resistance, HFR). Comparisons of an initial MEA polarization curve (red) and after 31.5 k square-wave cycles (525 h) at anode loadings of 0.1 mgIr cm‒2 and an upper potential of 1.6 (dark red), 1.8 (blue), 2 (dark blue), 2.2 (green), and 2.5 (dark green) V, with a focus on (c) overall performance (not corrected for resistance, HFR) and (d) kinetic performance (corrected for resistance, HFR).
Throughout all MEA tests, regardless of upper potential or Ir loading, intermittent operation resulted in larger losses than constant potential (Figures 1, 3). These results (higher loss with cycling) are somewhat unexpected in Ir/electrolysis since the potential range (>1.45 V) did not cycle through Ir redox and incorporate Ir aggregation or higher dissolution rates associated with Ir metal.9,45,46 Potential cycling in MEAs, however, may not result in instantaneous or uniform potentials in the catalyst layer and may accelerate dissolution due to localized potential spiking. Previous RDE efforts have found that square-wave cycling and faster ramp rates momentarily increased the rate of Ir dissolution, attributed to non-equilibrated processes in the catalyst layer.47 In MEAs, a similar process may occur and may be exacerbated by the relative thickness (membrane/catalyst layer) compared to RDEs. During square-wave testing, performance losses were observed (by 20 times kinetically, 1.45‒2 V) that were more severe than overall catalyst layer changes (30% thinning), and may indicate nonuniform loss. Exposure to higher potentials (square-wave or triangle wave 1.45‒2.5 V) also resulted in slight increases in the high frequency resistance, suggesting pitting in the catalyst layer and membrane/catalyst contact limitations. In MEA testing, however, a large internal resistance drop or potential gradient was not expected through the catalyst layer due to low catalyst loading and the lack of a support. Differences between an adsorbing and non-adsorbing electrolyte may also account for half- (perchloric acid) and single-cell observations (sulfonate-based ionomer). RDE testing in perchloric and sulfuric acid electrolytes, however, have previously shown minimal difference in the performance, durability, or dissolution rate of Ir oxide at electrolysis-relevant potentials.10
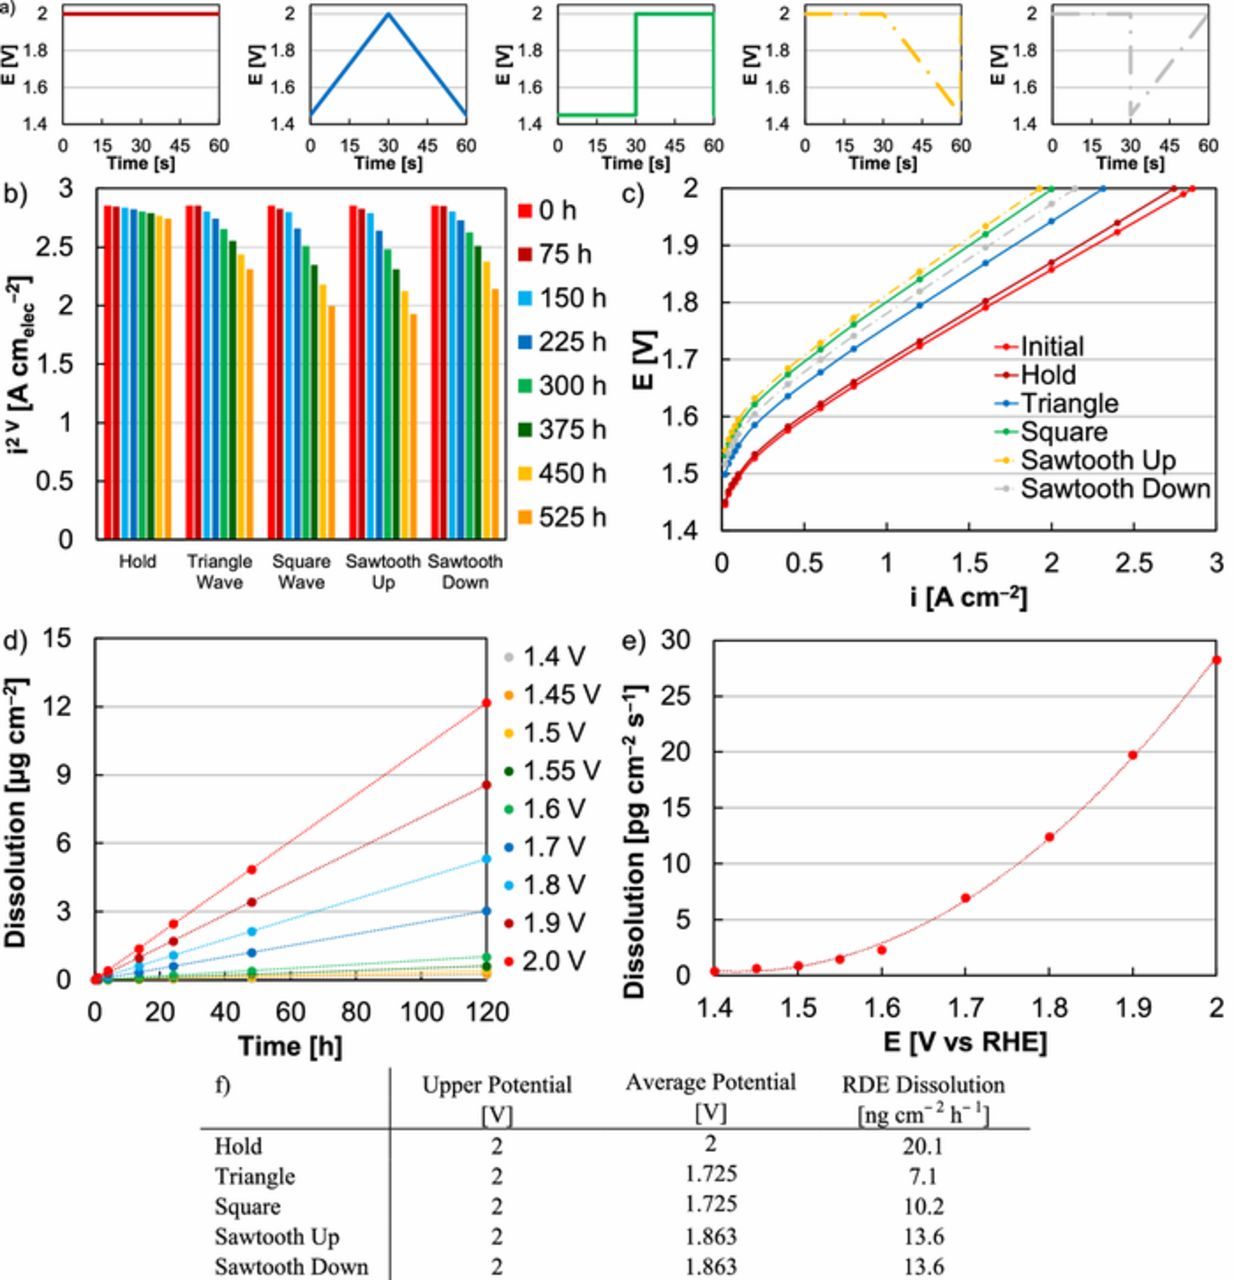
Figure 3. (a) Potential hold, triangle-wave, square-wave, sawtooth up, and sawtooth down profiles applied during MEA testing. (b) Comparison of MEA performance at 2 V during potential hold (525 h), triangle-wave (1.45‒2 V, 525 h or 31.5 k cycles), square-wave (30 s at 2 V, 30 s at 1.45 V, 525 h or 31.5 k cycles), sawtooth up (30 s at 2 V, 30 s 2‒1.45 V, 525 h or 31.5 k cycles), and sawtooth down (30 s at 2 V, 30 s 1.45‒2 V, 525 h or 31.5 k cycles) tests at an Ir-anode loading of 0.1 mgIr cm‒2. (c) Comparisons of an initial MEA polarization curve (red) and polarization curves following extended operation (525 h or 31.5 k cycles) by potential hold (2 V, dark red), triangle-wave (1.45‒2 V, blue), and square-wave (30 s at 2 V, 30 s at 1.45 V, green), sawtooth up (30 s at 2 V, 30 s 2‒1.45 V, yellow), and sawtooth down (30 s at 2 V, 30 s 1.45‒2 V, gray). (d) Ir dissolution over time, determined by ICP-MS, in RDE half-cells as a function of applied potential (subfigure legend). Total dissolution was determined by multiplying the Ir electrolyte concentration (ICP-MS value) by the electrolyte volume (150 ml). (e) Expected Ir dissolution rate in RDE as a function of applied potential. The dissolution rate was determined from the linear fits (dashed lines) in subfigure (d). (f) Upper potential limit, average potential, and approximated dissolution rate (in RDE) for potential hold, triangle-wave, square-wave, sawtooth up, and sawtooth down profiles. Dissolution rates based on test profile were calculated from the potential protocols in subfigure (a) and the fit (dashed line) of the approximate Ir dissolution rate at potential in subfigure (e).
Losses during square-wave tests were also consistently larger than triangle-wave (Figure 1). Differences in loss observations between these protocols may be due to differences in the Ir dissolution rate (Figures 3d‒3f). To evaluate the effect of potential on catalyst dissolution, Ir oxide was held at various potentials in RDEs for 120 h, with electrolyte samples taken periodically and analyzed by ICP-MS (Figure 3d). Approximate dissolution rates were calculated based on the quantity of Ir dissolved in the electrolyte as a function of time (Figure 3e). Although these values do not directly correspond to Ir oxide dissolution rates in MEAs due to differences in loading, electrode area, and electrolyte/interface exposure, they provided relative comparisons for expected Ir dissolution rates (Figure 3f). These results demonstrated that Ir dissolution did not vary linearly with potential and that specific load profiles may significantly increase Ir dissolution and durability losses, depending on the time spent at given potentials. Although the upper (2 V) and average (1.725 V) potentials in triangle- and square-wave testing were identical, the expected Ir oxide dissolution rate during square-wave tests was larger, 10.2 ng cm‒2 h‒1 in square-wave compared to 7.1 ng cm‒2 h‒1 in triangle-wave. These differences were due to the larger amount of time spent at 2 V (in square-wave) resulting in a higher expected dissolution rate and may account for durability differences between the two load profiles.
In addition to differences in the Ir dissolution rate, the ramp rate may have also accelerated degradation. To evaluate this effect, sawtooth profiles were applied to evaluate the relative contributions of potential ramping and time spent at potential (Figure 3a). Two sawtooth profiles were used, where sawtooth up denoted a step-change from 1.45 to 2 V and a gradual decrease back to 1.45 V, and sawtooth down denoted a gradual increase from 1.45 to 2 V and a step-change back to 1.45 V (Figure 3a). For these tests, the average potential (1.863 V) and the expected Ir oxide dissolution rate (13.6 ng cm‒2 h‒1 in RDE) were the same. The sawtooth up profile, however, resulted in higher losses (32% at 2 V, 2.85 to 1.93 A cm‒2) than sawtooth down (25% at 2 V, 2.85 to 2.14 A cm‒2), indicating that the sudden increases in load accelerated loss in the catalyst layer (Figures 3b, 3c). Comparing sawtooth up and square-wave, where both profiles produced sudden increases in potential (1.45 to 2 V), the sawtooth up resulted in similar but slightly higher loss (32% vs 30% at 2 V, Figures 3b, 3c). The trend was similar when comparing sawtooth down (25% loss at 2 V) and triangle-wave (19% loss at 2 V), where both profiles produced gradual increases in potential (Figures 3b, 3c). Larger durability losses with sawtooth profiles were expected since they exposed the catalyst layer to higher potentials and likely higher amounts of Ir dissolution (Figure 3f). These results suggest that the ramp rate can also accelerate degradation and affect device lifetime, and the ramp rate was varied to assess the ability of system controls to mitigate loss (Supporting Information, Figure S.2). Slowing potential increases were found to gradually bridge differences between square- (30% at 2 V) and triangle-wave (19% at 2 V) losses. While decreasing the ramp rate can be used minimize loss associated with sudden potential increases, intermittency (load cycling) and applied potential (dissolution rate) appeared to have a larger effect on MEA durability, and limiting potential may be a more effective system control strategy during intermittent operation.
Ex-situ characterization and cell diagnostics were used to assess how extended operation affected cell components. Post-operation analysis focused on square-wave testing (30 s at 2 V, 30 s at 1.45 V) at an Ir-anode loading of 0.1 mgIr cm‒2 as an example. Microtomed MEA cross-sections revealed that extended operation thinned the catalyst layer and that potential cycling exaggerated the thinning (Figure 4, Tables I, S.1).21 Following cycling, a slight decrease was also observed in the Ir catalyst layer porosity (38.8 to 33%) and a large decrease in the equivalent pore diameter (52.9 to 35.9 nm, Figure S.3, Table S.2). XRD of the Ir catalyst before and after MEA operation further demonstrated a change in the Ir crystal structure, from face-centered-cubic with a symmetric unit cell lattice parameter (initial) to body-centered-tetragonal (post-testing). Square-wave testing, however, resulted in a higher concentration of metallic Ir, suggesting that the profile induced a higher degree of crystallographic changes on the Ir catalyst structure. During impedance measurements, the low-frequency resistance (Rp,α) increased and the capacitance (Cα,) decreased following cycling (Randles cell equivalent circuit model), potentially due to corrosion of the catalyst layer and loss at the catalyst/ionomer/membrane interface (Figures 5c, 5d, S.4). Degradation of other components, including thinning the membrane and PTL passivation or corrosion may have occurred, but were potentially smaller contributors due to constant HFR (membrane/contact resistance, Figures 5c, 5d, S.4) and repeated PTL use.34,36

Figure 4. SEM of microtomed MEA cross-sections showing back-scattered electrons to highlight the catalyst layer, (a) initially and following extended operation (525 h, 31.5 k cycles) by (b) potential hold (2 V), (c) triangle-wave (1.45‒2 V), and (d) square-wave (30 s at 2 V, 30 s at 1.45 V).
Table I. Anode catalyst layer thickness, porosity, pore area, and pore diameter, initially and following extended operation (525 h, 31.5 k cycles) by square-wave (30 s at 2 V, 30 s at 1.45 V).
| Initial | Square-Wave | ||
|---|---|---|---|
| IrO2 Thickness | [μm] | 1.07 | 0.77 |
| IrO2 Porosity | [%] | 38.8 | 33 |
| IrO2 Average Pore Area | [μm2] | 0.004 | 0.002 |
| IrO2 Equivalent Pore Diameter | [nm] | 52.9 | 35.9 |
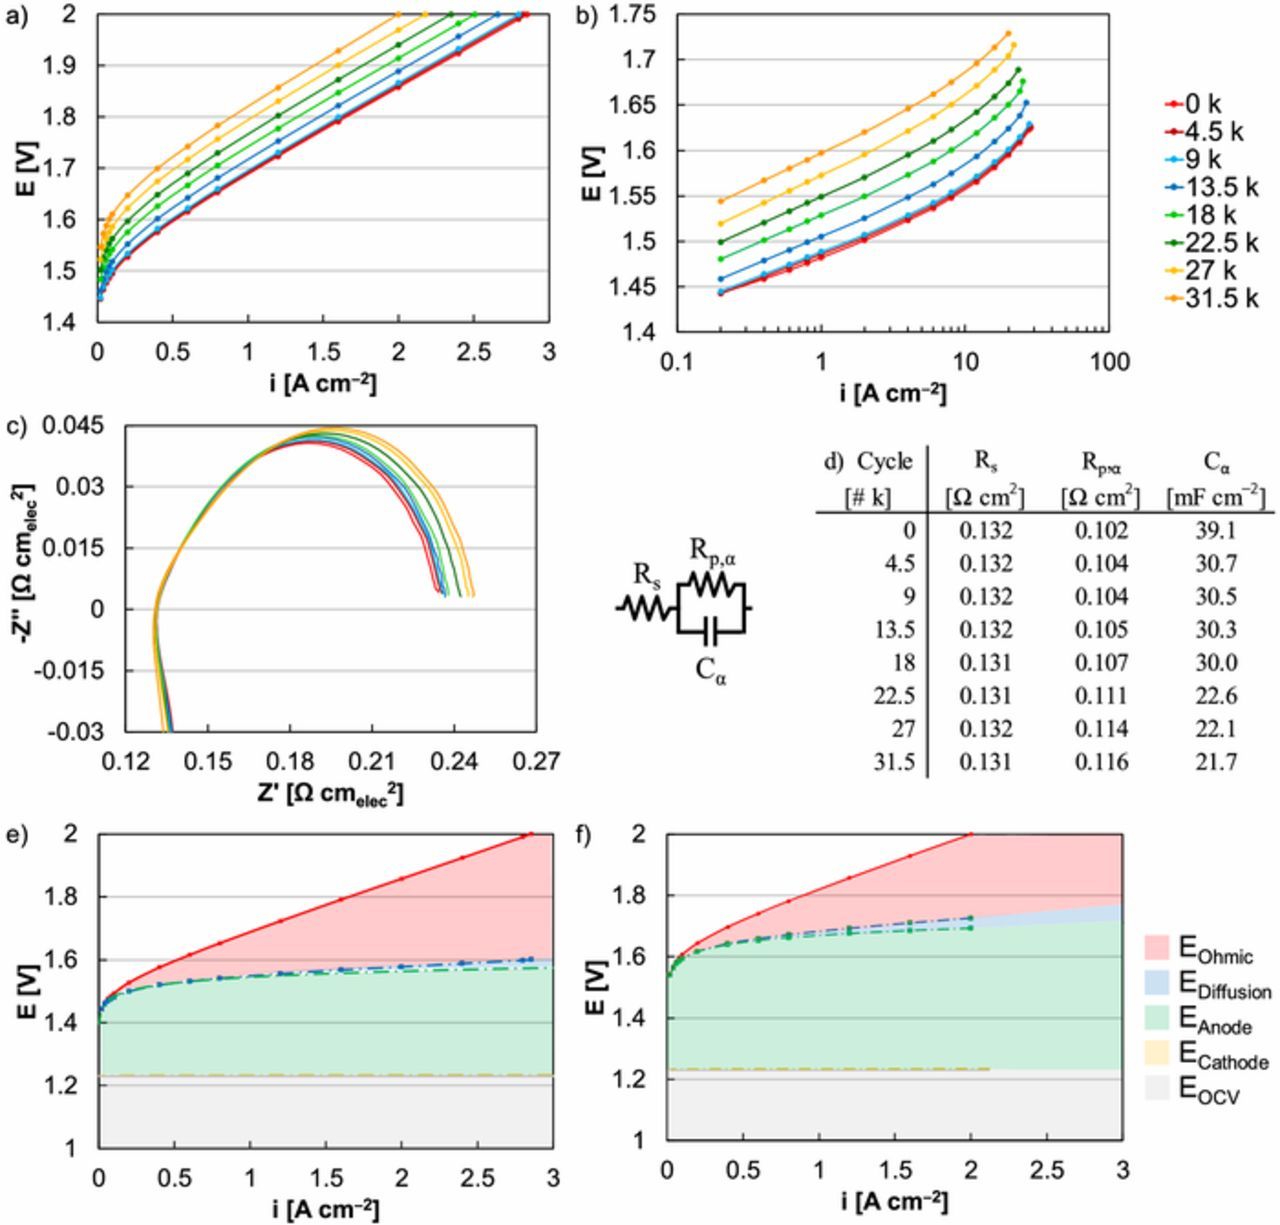
Figure 5. Polarization curves of MEA durability (square-wave, 1.45‒2 V) at an Ir-anode loading of 0.1 mgIr cm‒2 with a focus on (a) overall performance (not corrected for resistance, HFR) and (b) kinetic performance (corrected for resistance, HFR). (c‒d) Impedance data and equivalent circuit model fits of MEA durability (square-wave, 1.45‒2 V) at a current density of 0.2 A cm‒2. MEA performance at (e) beginning of life (0 k) and (f) after 31.5 k cycles (square-wave, 1.45‒2 V).
Polarization curves (Figure 5a) were also analyzed to evaluate to relative role of kinetics, transport, and resistance in MEA durability, using square-wave testing (30 s at 2 V, 30 s at 1.45 V) at an Ir-anode loading of 0.1 mgIr cm‒2 as an example.48 Resistance loss (EOhmic, Figures 5e, 5f) was determined by the difference between the resistance-corrected (HFR) and -uncorrected polarization curves. Transport loss (EDiffusion, Figures 5e, 5f) was determined by the difference between the kinetic performance (Tafel slope) and resistance-corrected (HFR) polarization curve. Kinetic loss (EAnode, ECathode in Figures 5e, 5f) was determined by Tafel plots (Figure 5b) corrected for resistance (HFR) and transport (Tafel slope), with the relative anode and cathode kinetics approximated by the Ir RDE exchange current density (OER, 1.7 × 10‒6 A mgIr‒1) and Pt MEA exchange current density (hydrogen pump, 535 A mgPt‒1).10,49 Significant loss was found when comparing MEA performance at the beginning of life and following 31.5 k cycles, 30% at 2 V (2.86 to 2.00 A cm‒2) and approximately 20 times in the kinetic region (0.8 to 0.04 A cm‒2 at 1.532 V, Figures 5a, 5b). On a potential basis, the overpotential increased by 142 mV at 2 A cm‒2 and 101 mV at 0.02 A cm‒2 (Figures 5a, 5b). When examining the polarization curves, several trends were observed. First, resistance- and transport-based losses slightly increased but did not change significantly following extended operation, expected since the test profiles primarily focused on catalyst durability as opposed to the membrane (no added back pressure) or other components (coated PTLs, flow fields). Small increases in resistance and transport loss may have been affected by changes in the catalyst layer deteriorating the catalyst/ionomer/membrane interface. Second, increasing kinetic loss was the primary source of lower performance following extended operation (Figures 5b, 5e, 5f). Kinetic loss was evident from Tafel plots, where large shifts in the exchange current density were observed (Figure 5b). These trends, including large increases in kinetic loss and minimal changes to resistance/transport, were observed for all MEAs regardless of the exposed potential and test profile applied.
In addition to evaluating the effect of stress type on MEA durability, the cycle period was shortened and lengthened to study how cycling frequency impacted performance over time (Figure 6a). These experiments were completed using MEAs with an Ir-anode catalyst loading of 0.1 mgIr cm‒2 and square-wave testing in the potential range 1.45‒2 V. Increased cycling frequency resulted in higher durability losses, although increasing the frequency did not proportionally increase performance loss (Figures 6b, 6c). As with other durability experiments, the losses were dominated by decreasing kinetics. Although the mechanism for kinetic loss (Ir dissolution) and how it manifests in MEAs (thinning cyclic voltammograms, increasing polarization resistance) did not appear to change, increasing the cycling frequency clearly accelerated degradation and resulted in higher performance losses.
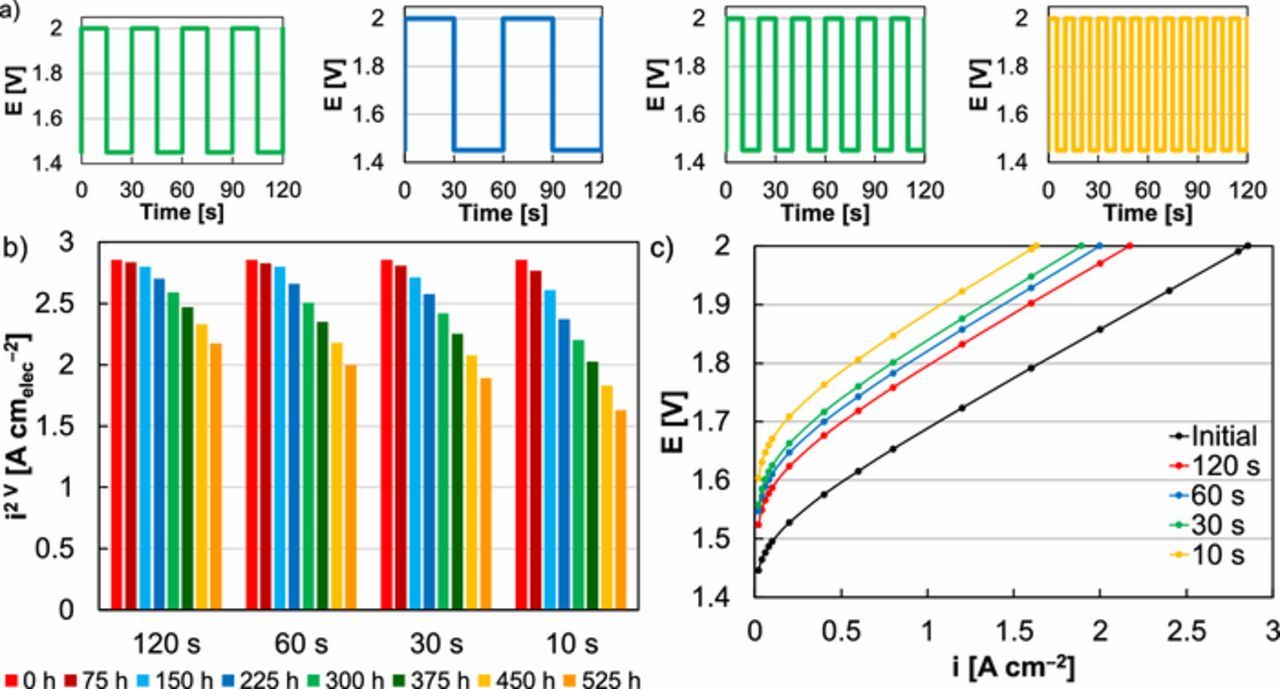
Figure 6. (a) Load profiles applied varying square-wave cycling frequency, including 120, 60, 30, and 10 s per cycle. (b) Comparison of MEA performance at 2 V with varied cycling frequency. (c) Comparisons of an initial MEA polarization curve (black) and polarization curves following extended operation (525 h) varying square-wave cycling frequency, including cycles of 120 (red), 60 (blue), 30 (green), and 10 s (yellow).
Wind and solar inputs were adapted and applied to single-cell durability tests to assess whether square- and triangle-wave operation relate to and accelerate losses from renewable load profiles. The wind and solar inputs used were from the National Wind Technology Center M2 Tower at 50 m on January 30, 2018 and from the National Renewable Energy Laboratory PVDAQ Site 51 on April 1, 2018, respectively. These inputs were translated to potentials to compare to previous tests (Figure 1) and were done to keep the upper (2.25 V), lower (1.45 V), and average (1.70 V) potentials the same (Figures 7a, 7b). After 90 days, the wind-modeled input resulted in 13% loss at 2V, or 62 mV in overpotential at 2 A cm‒2 and 45 mV at 0.02 A cm‒2 (Figures 7c, 7d). Solar-modeled input losses were similar, 12% at 2 V or 54 mV in overpotential at 2 A cm‒2 and 36 mV at 0.02 A cm‒2 (Figures 7c, 7f). These performance decreases were much smaller than triangle- and square-wave tests at comparable potentials (1.45‒2.2 V) and catalyst loading (0.1 mgIr cm‒2), which resulted in current density decreases of 36% and 28% respectively at 2 V. The renewable loss also occurred over a much longer periods of time (3 months versus 3 weeks). In comparison to continual cycling, shifts between the application of no (1.45 V) and full load (2.25 V) occurred once per day instead of once per minute, and cycling frequency appeared to have a significant impact on observed performance loss over time. Comparing the wind and solar inputs, the wind input had a slightly larger loss, potentially due to: a slightly higher anticipated dissolution rate (in RDE, 150 ng cm‒2 day‒1 wind, 131 ng cm‒2 day‒1 solar); and multiple, sudden increases in potential (at 6:30 and 20:00, Figure 7a).
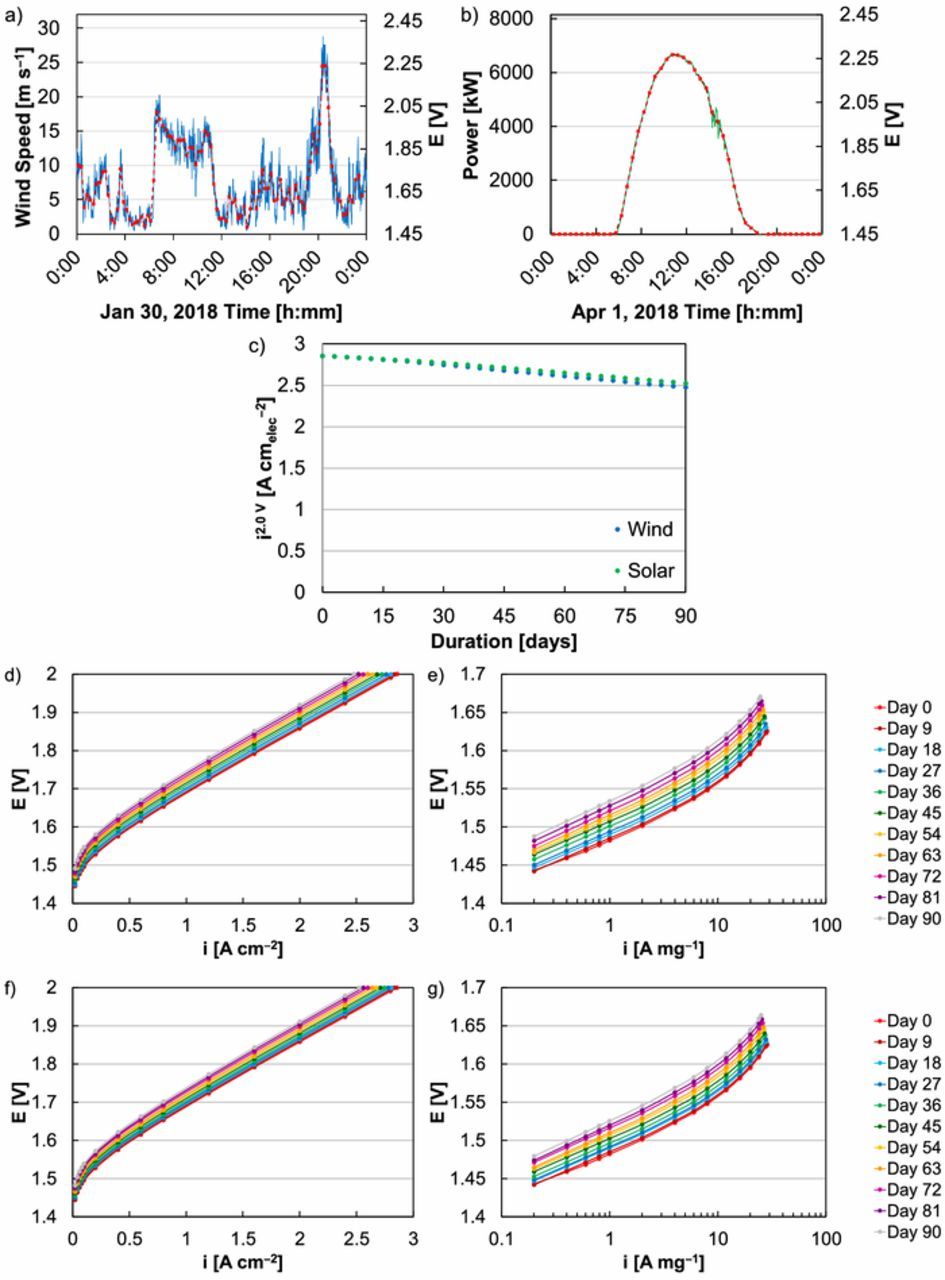
Figure 7. (a) Model wind profile from the National Wind Technology Center M2 Tower at 50 m on January 30, 2018 with corresponding potential applied during extended MEA operation. (b) Model solar profile from the National Renewable Energy Laboratory PVDAQ Site 51 on April 1, 2018 with corresponding potential applied during extended MEA operation. Applied potentials were calculated to maintain the same range (1.45‒2.25 V) and average (1.70 V). (c) Comparison of MEA performance at 2 V with wind (blue) and solar (green) profiles. MEA polarization curves and Tafel plots during extended operation with (d‒e) wind and (f‒g) solar input profiles.
While renewable inputs resulted in MEAs with higher durability than regular or frequent cycling, analysis of polarization curves revealed that the loss mechanism was the same (Figures 7e, 7g). As with triangle- and square-wave tests, losses were dominated by kinetics and changes in resistance or transport loss were minimal (Figures 7e, 7g). Impedance results were also fit to a Randles cell equivalent circuit model, where: the high frequency resistance (ohmic loss) was relatively constant; the polarization resistance increased; and the capacitance decreased (Figure S.5). As with frequent cycling, performance loss from renewable input was likely due to Ir dissolution thinning the catalyst layer and deteriorating the catalyst/ionomer/membrane interface. In this sense, frequent cycling of MEAs may accelerate losses due to intermittent input and could be used to project its effect on device lifetime.
For MEAs at a constant loading (0.1 mgIr cm‒2), durability results (current density loss at 2 V) were compiled in Figure 8 for all factors tested, including stressor type (hold, triangle-wave, square-wave), stressor severity (peak potential), experiment duration (0‒525 h, 0‒31.5 k cycles), cycling frequency, potential ramping (sawtooth, easing square-waves), and renewable inputs. Performance decline was plotted as a function of the cycling frequency (x-axis) and the anticipated dissolution rate (from RDE, y-axis). From these results it was clear that even at low catalyst loading, some combination of an aggressive stressor (higher anticipated dissolution rate) and intermittent operation was needed to produce MEA performance loss over a reasonably short period of time. High cycling frequency was a necessity and constant holds resulted in small MEA performance loss even if relatively high potential was applied. Conversely, an aggressive stressor was needed to increase the anticipated dissolution rate and produce MEA performance loss. Losses generally increased with a higher anticipated dissolution rate and higher cycling frequency. On occasion, deviations from these trends were observed due to differences in the ramp rate (square-and triangle-wave); these differences, however, tended to be a secondary factor. These results indicated that high potential may be necessary to observe loss over a relatively short period of time and that moderate current densities may not be adequate to reasonably project lifetime. Intermittent input also appeared to result in significant higher durability losses that may impact operation strategies and cost projections for PEM-based low temperature electrolysis.
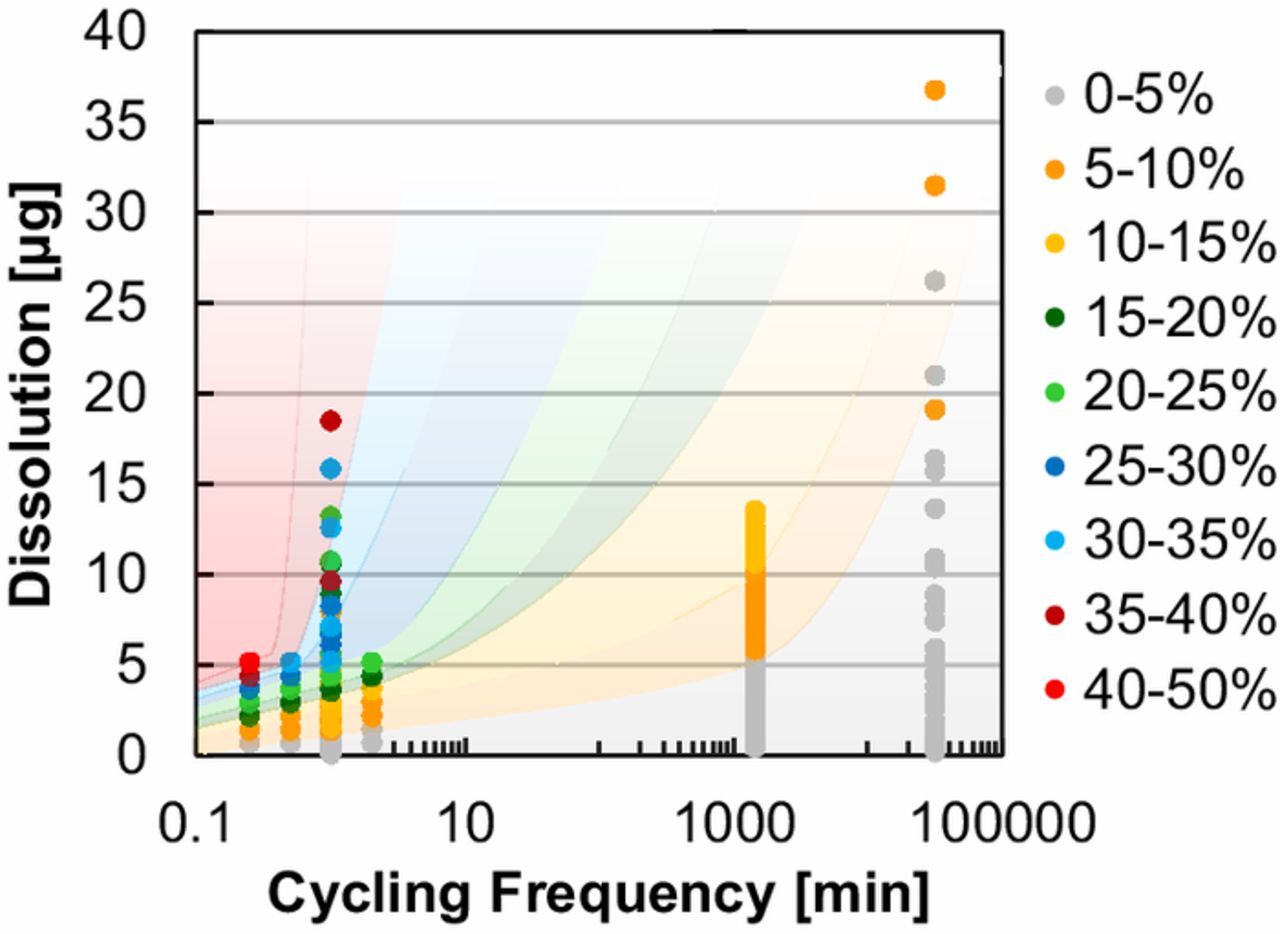
Figure 8. MEA performance loss on a percentage basis at 2 V as a function of cycling frequency (x-axis) and the approximate dissolution rate (in RDE).
Conclusions
MEA electrolyzer durability was studied with a focus on catalyst layer degradation at low catalyst loading and intermittent operation. Although Ir dissolution occurs regardless of catalyst loading, thicker catalyst layers provided an Ir buffer, delaying and masking performance decreases. Significant durability losses were observed at low catalyst loading over relatively short periods of time (525 h), however, particularly at high potential. Dynamic operation also resulted in larger loss and while potential ranges were used to avoid redox transitions, frequent cycling accelerated degradation.
Test variables, including stressor type (hold, triangle-wave, square-wave), stressor severity (peak potential), cycling frequency, and potential ramping (sawtooth, easing square-waves) produced varying degrees of kinetic loss. Decreasing kinetic performance corresponded to thinning the catalyst layers and increased polarization resistance, indicating that Ir and interfacial deterioration contributed to durability loss. Higher cycling frequency and higher cell potentials generally resulted in larger drops in performance. Sudden changes in potential, however, also slightly increased loss rates. Triangle- and square-wave testing resulted in the same loss pathway as model renewable power inputs; higher cycling frequency, however, accelerated performance loss and can potentially be used to project how intermittent operation affects device lifetime.
Although electrolyzers today are durable, electrolysis will shift toward lower catalyst loadings and intermittent power sources to reduce hydrogen production costs. As low loading and dynamic operation dramatically accelerate loss observations, evaluating and mitigating electrolyzer loss under these conditions is needed. Thin, low-loaded Ir layers and high potential were critical to observing loss, suggesting that testing at moderate loadings and current densities over short durations may be inadequate in assessing long-term durability. These durability losses may further impact electrolyzers' abilities to operate with low catalyst loading and intermittent inputs, and both component development and system control may be needed to limit cell potential and loss.
Acknowledgments
This work was authored by the National Renewable Energy Laboratory, operated by Alliance for Sustainable Energy, LLC, for the U.S. Department of Energy (DOE) under Contract No. DE-AC36-08GO28308. Funding provided by U.S. Department of Energy Office of Energy Efficiency and Renewable Energy, Fuel Cell Technologies Office. The views expressed in the article do not necessarily represent the views of the DOE or the U.S. Government. The U.S. Government retains and the publisher, by accepting the article for publication, acknowledges that the U.S. Government retains a nonexclusive, paid-up, irrevocable, worldwide license to publish or reproduce the published form of this work, or allow others to do so, for U.S. Government purposes.