Abstract
We present data on broadband, white light emission from insulating hosts under intense excitation in the near infrared in host materials that are undoped, partially-doped with rare earth ions, and that contain stoichiometric concentrations of rare earth ions. Much of the emission is found to have a blackbody-like structure in the visible and near infrared region. The origin of the emission as from a blackbody is also supported by the temporal characteristics of the emission in response to turning on and off the laser, and also by the dependence of the air pressure in the chamber. However, some of the data presented cannot be explained by blackbody emission alone, so other processes are proposed to explain the observed spectra. The role of the rare earth ion dopants in enhancing the broadband emission is also considered.
Export citation and abstract BibTeX RIS

This is an open access article distributed under the terms of the Creative Commons Attribution 4.0 License (CC BY, http://creativecommons.org/licenses/by/4.0/), which permits unrestricted reuse of the work in any medium, provided the original work is properly cited.
Over the last several years, numerous works have reported a broadband, white-light emission from insulating powders under intense, near infrared (IR) excitation.1–19 The materials investigated are usually nano-powders of insulators, such as yttrium oxide, yttrium silicate, Al2O3, GGG, and others, either pure or doped with rare earth ions (e.g. Er, Nd, Yb, Tm) or transition metal ions (e.g. Cr). Spectral and temporal characteristics of the broadband emission suggest that it is thermal in origin. One study on the origin of the emission, conducted by Debasu et al.,16 concluded that the emission is indeed blackbody emission, with temperatures in the range of ∼1200 K–1900 K. We have studied the white-light emission phenomenon in several host materials, both doped and undoped. In this work, we present results representative of this body of work, and we consider how these results fit into the blackbody model.
For lighting applications, one of the main goals is the generation of high quality, white light with highest possible efficiency. Broadband white light based on blackbody-like emission can be of very high quality, but it is never efficient, especially compared to compact fluorescent or LED-based lighting. The white light we report on here is probably no different in that regard, and so it likely will be of little usefulness as a general lighting source. One difference between these emitters and tungsten-based blackbody sources is the means by which energy is delivered to the system; the energy source is a near infrared diode laser instead of electrical power converted to Joule heating, as in a tungsten lamp.
Production of white light using near IR photons can occur in different ways. One method of recent interest is the upconversion process in rare earth doped systems that depend on energy transfer and/or excited state absorption to produce emission of high-energy photons. Usually, this occurs in systems co-doped with, for example, Yb, Er and Tm,20,21 and the emission is exclusively from the f-f transitions of the dopant ions. The white light reported on here is generated in a fundamentally different way. The energy contained in the exciting near infrared (IR) photons is ultimately converted into energy in the form of heat, which leads to thermal (i.e. blackbody) emission. Of course, the conversion of near IR photons into visible radiation is, by definition, an upconversion process. As with all upconversion processes, the emission intensity is supralinear with respect to the excitation power, with sometimes ten or more near IR photons required to produce a single photon of visible light. However, very little in known regarding the precise details of how this upconversion process occurs. These questions include: How does the absorption occur? What processes are responsible for converting the electronic energy into heat? What other processes are present that compete with those that lead to thermal emission, and how do these processes contribute to the emission from the sample? Thus, there is still much to learn about how these materials respond to high intensity radiation. Our main interest in the phenomenon of white light emission is to gain a deeper understanding of the processes leading to the white light emission. Studying such systems may uncover new physics that could be relevant to applications beyond white light sources. Indeed, as light sources (e.g. LEDs, lasers) become more powerful and excitation intensities increase accordingly, it is becoming increasingly relevant to understand the processes that can occur under high intensity excitation.
This paper is organized as follows. First, we briefly discuss the synthesis of the materials, their structural characterization, and the experimental methods we used to determine the characteristics of the white light emission. We then present results, some already published and some new, on the spectral and temporal characteristics of white light in materials that are: (1) undoped insulators; (2) insulators doped to with rare earth ions; and (3) fully doped systems, i.e. systems with stoichiometric concentrations of rare earth ions. Finally, we discuss models that could lead to the white light emission that are consistent with the observed data.
Materials and Experimental Methods
Most of the nano-powders we report on here were prepared by the thermal decomposition method. All chemicals used in this study were obtained from Sigma-Aldrich, were of analytical grade, and were used as received without any further purification. Details of the preparation of the yttrium oxide and yttrium silicate (doped and undoped) nano-powders are given elsewhere.22 The fully doped rare earth oxides (Er2O3 and Yb2O3) were prepared as follows. Erbium(III) nitrate pentahydrate Er(NO3)3.5H2O and ytterbium(III) nitrate pentahydrate Yb(NO3)3.5H2O were used as precursors for synthesis of Er2O3 and Yb2O3 nano-crystals, respectively. Alginic acid sodium salt (low viscosity, 250 cps, 2% solution in water) was used for ionic gelation. To synthesize rare earth oxide nano-crystals, rare earth nitrate solution (0.2 mol/L) and 1% (w/v) sodium alginate solution were prepared by dissolving in bi-distilled water. Rare earth alginate beads of average diameter 1 mm were produced by dropwise addition of 25 mL of sodium alginate solution to 50 mL of rare earth nitrate solution, using a syringe which has a stainless-steel needle. The prepared rare earth alginate beads were shaken for 30 minutes in the gelling medium at a rate of 250 rpm. The beads were then separated from the solution, placed in a porcelain crucible, and heated at 500°C for 24 h and a pinky powder for Er2O3, bluish powder for Nd2O3, white powder for Yb2O3 was formed. In addition to the sample mixed in the lab, high purity undoped Al2O3 and Y2O3 nano-powders (∼50 nm grain size) were purchased from Sigma Aldrich.
Estimation of the particle sizes of the synthesized materials were made using the X-ray Diffraction Technique (XRD) and electron microscopy techniques (SEM and TEM). The details are given elsewhere.22
The continuous emission spectra of the samples were obtained by pumping the samples with the output of a Laser Drive Inc. Model LDI-820 diode laser operating at 975 nm or near 800 nm. The signal was directed toward the entrance slit of a 1 m McPherson Model 2051 monochromator and chopped at a frequency of 250 Hz before entering the slit. The monochromator provided a resolution of 0.8 Å with the slits set at 50 μm and a wavelength reproducibility of 0.1 Å. The optical signal was detected by a Hamamatsu R1387 photomultiplier tube with an S20 response, sent to an EG&G Model 5210 lock-in amplifier and recorded in a computer. The experimental data on the responses of the samples to sudden changes in excitation were obtained by employing a shutter to interrupt the diode laser beam and a Tektronix Model TDS3052B oscilloscope. An Avantes AvaLight-Hal-Cal calibration light source was used to correct the spectrum for the sensitivity of the system. An Allied Scientific Pro ASP-MK350 Model Illuminance Meter was also used to allow measurements of the International Commission on Illumination (CIE) coordinates, the Correlated Color Temperature (CCT), the Color Rendering Index (CRI) and the illuminance values of the white light to be obtained.
Undoped Nano-Powders
White light emission from Y2O3 nano-powders
The white light emission was observed from undoped Y2O3 nano-powders (diameter ∼20 nm) under both 803.5 and 975 nm laser diode excitation, and are shown in Figures 1 and 2, respectively. Figure 1a shows that the raw white light emission spectra under 2 Watts of 803.5 nm excitation, with the cryogenic cooler set to at two different temperatures. Figure 1b shows the same spectra, after correcting for the monochromator throughput and detector sensitivity. The peak near 800 nm in Figures 1a and 1b is due to scattered light from the laser diode excitation source. Figure 1c shows the spectrum taken using the illuminance meter. The color temperature according to the meter was 2756 K, and the Color Rendering Index (CRI) value is 99. The white curve in Figure 1c represents blackbody emission curve at 2756 K given by Planck's formula:
![Equation ([1])](https://content.cld.iop.org/journals/2162-8777/7/1/R3199/revision1/d0001.gif)
where I(λ,T) is the intensity, which depends on both wavelength (λ) and temperature (T). We note that the spectrum in Figure 1c and the blackbody curve have been normalized to unity at 760 nm. Both the corrected spectrum and the illuminance meter show that the emission increases throughout the visible region and into the near IR. Although the data shown in Figure 1 suggests that the emission is thermal in nature, the spectrum deviates considerably from a blackbody emission at the designated temperature (2756 K).
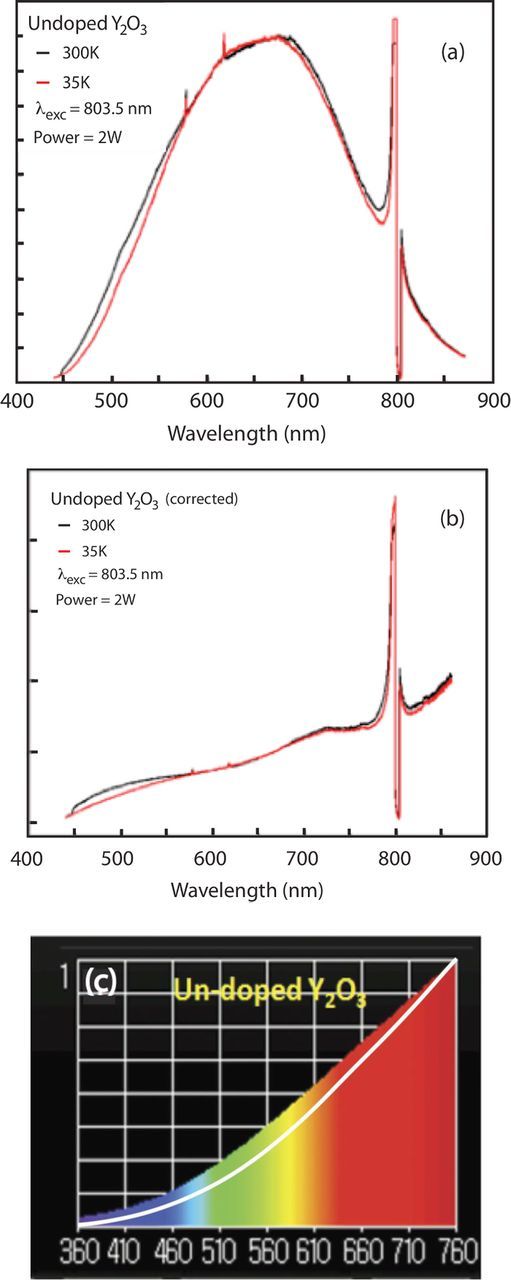
Figure 1. (a) Raw emission spectra of undoped Y2O3 under 2 Watts of 803.5 nm excitation. (b) Same spectra in (a) but corrected for system response. (c) Spectrum taken with illuminance meter and with blackbody curve at 2756 K between 360 nm and 760 nm.
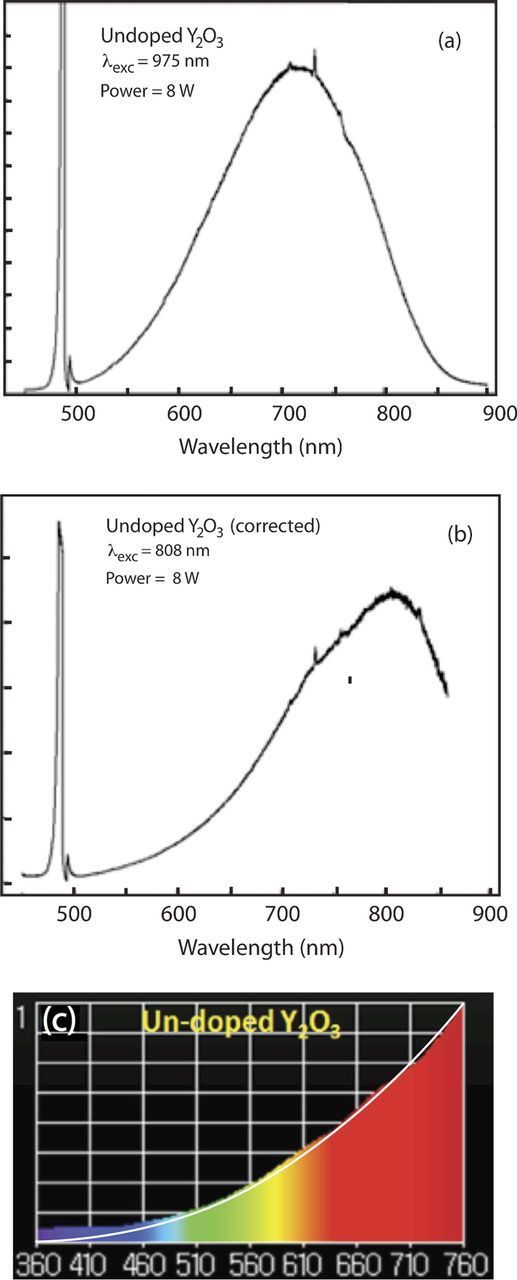
Figure 2. Raw emission spectra of undoped Y2O3 under 8 Watts of 975 nm excitation. (b) Same spectra in (a) but corrected for system response. (c) Spectrum taken with illuminance meter and with blackbody curve at 2416 K between 360 nm and 760 nm.
Figures 2a–2c show similar results under excitation of Y2O3 with 8 Watts of 975 nm radiation from a laser diode. The corrected spectrum (Figure 2b) shows a broad peak near 800 nm. The peak just below 500 nm is due to reflection of the 975 nm from the sample and passing through the monochromator, which is operated in the second order. Also, the threshold for white light is higher under 975 nm excitation than it is under 803.5 nm excitation.
Thus, we see that in undoped Y2O3 broadband, white light emission appears at high excitation intensities. We note also that a similar emission is observed in 99.999% pure undoped Y2O3 purchased commercially, so that the white light does not seem to be specific to the preparation method or purity. Because the bandgap of Y2O3 is ∼5.5 eV, much more energetic than the near IR photons, the mechanisms by which 803.5 nm or 975 nm radiation is absorbed are not obvious.
The data in Figures 1 and 2 were obtained under low pressure (∼0.02 mbar). The pressure dependence of the intensity of the white light emission under 2 Watts of excitation power at 803.5 nm is shown in Figure 3. At 2 Watts, the white light disappears above 14 mbar of pressure, while at 8 Watts, it is possible to observe white light up to ambient pressure. The chamber holding the sample was also filled with He and with N2 gas, and in both cases the observed pressure dependence of the white light was similar to that observed when the chamber was initially filled with air.
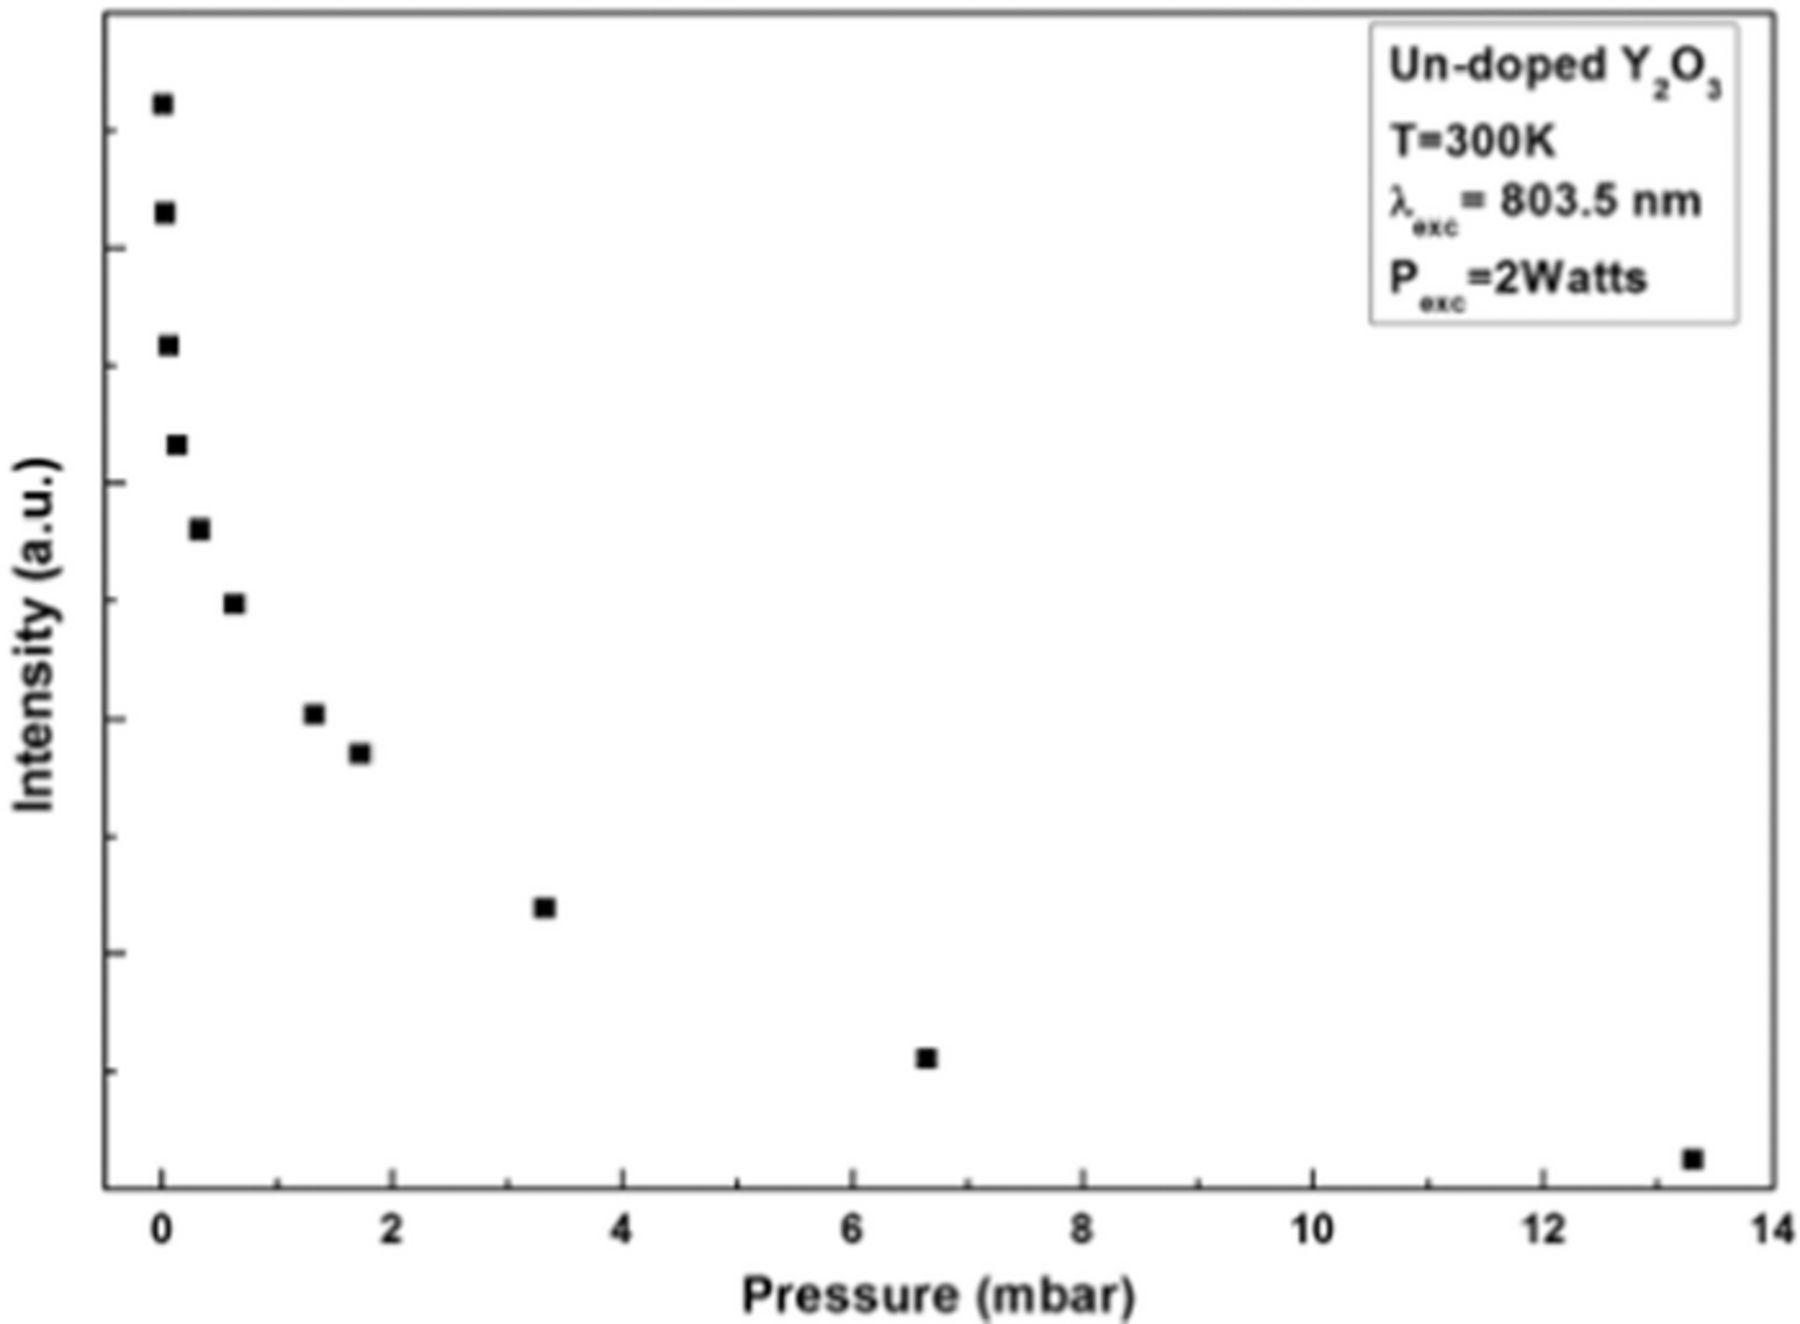
Figure 3. (a) Decay patterns and (b) rise patterns of white light emission in Y2O3 under different excitation powers.
The production of white light under IR excitation necessitates a non-linear process be responsible for the white light. A log-log plot of the intensity of the emission with respect to the laser power is shown in Figure 4. In general, the intensity if the emission obeys the following relationship to the excitation power:
![Equation ([2])](https://content.cld.iop.org/journals/2162-8777/7/1/R3199/revision1/d0002.gif)
where I is the intensity, P the power of the exciting near IR radiation, and n the slope of the line. The slope n represents the order of the process that leads to emission, i.e. the number of absorbed photons that lead to the emission of one photon. The plot shows that at lower powers n = 4.6, indicating that about five photons need to be absorbed to produce one photon of emission. At higher powers, n = 3.1, showing that the order of the process decreases significantly under high excitation powers. Also, the transition from one slope to another is sharp, indicating a distinct change in either the absorption or emission process.
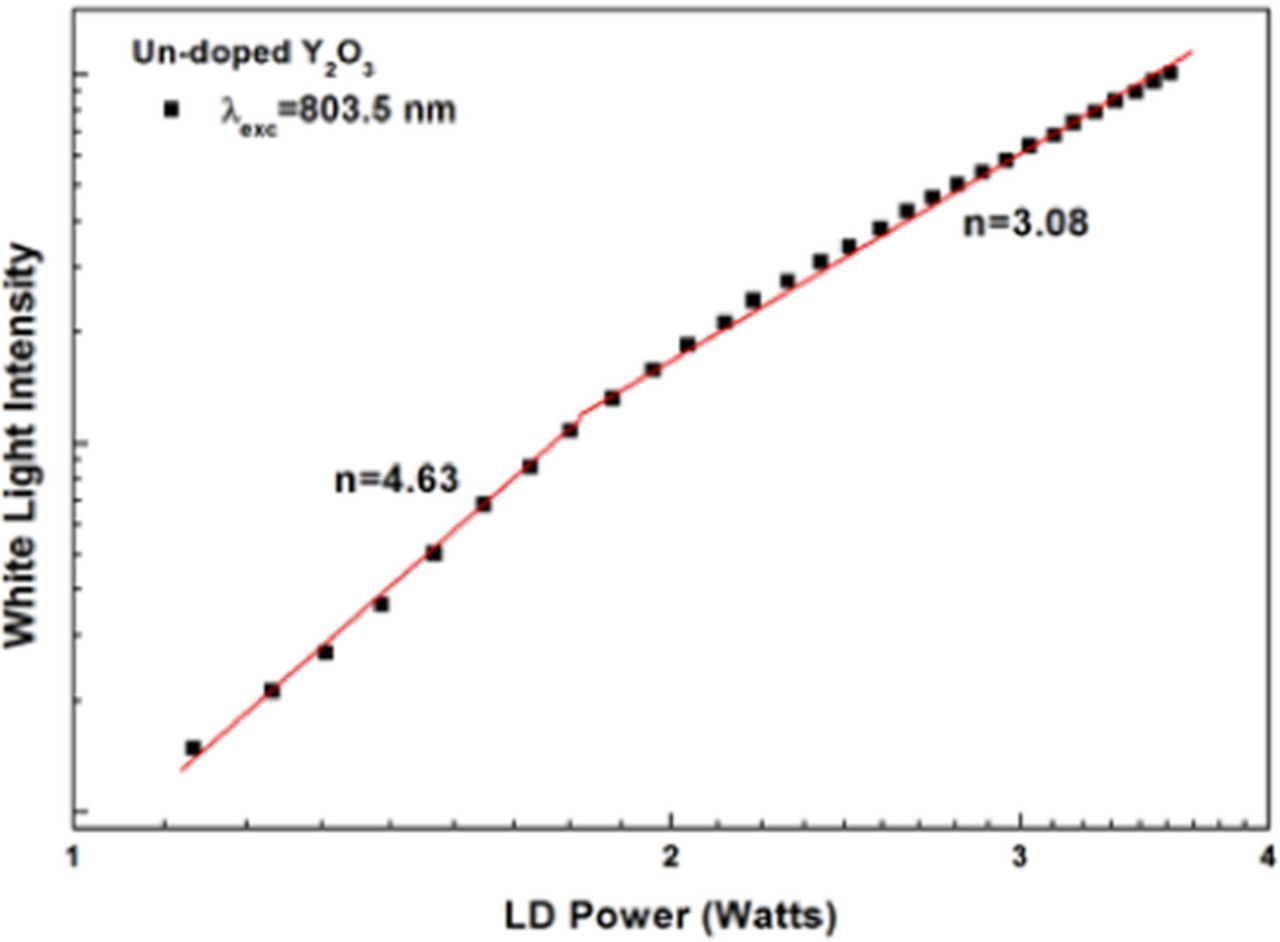
Figure 4. Log-log plot of Y2O3 emission intensity vs. 803.5 nm laser power.
The rise– and decay–patterns were measured to obtain some information regarding the dynamics of the white light emission process. Figure 5a shows normalized decay patterns after the excitation beam is suddenly blocked. The decay times are on the order of a few tenths of a second or less, and were independent of the excitation power. The rise times, shown in Figure 5b, measure how the intensity of the emission changes when the laser is suddenly turned on. Figure 5b indicates that the rise time of the emission increases from about 0.2 seconds at higher excitation powers to about 2 seconds at lower excitation powers.
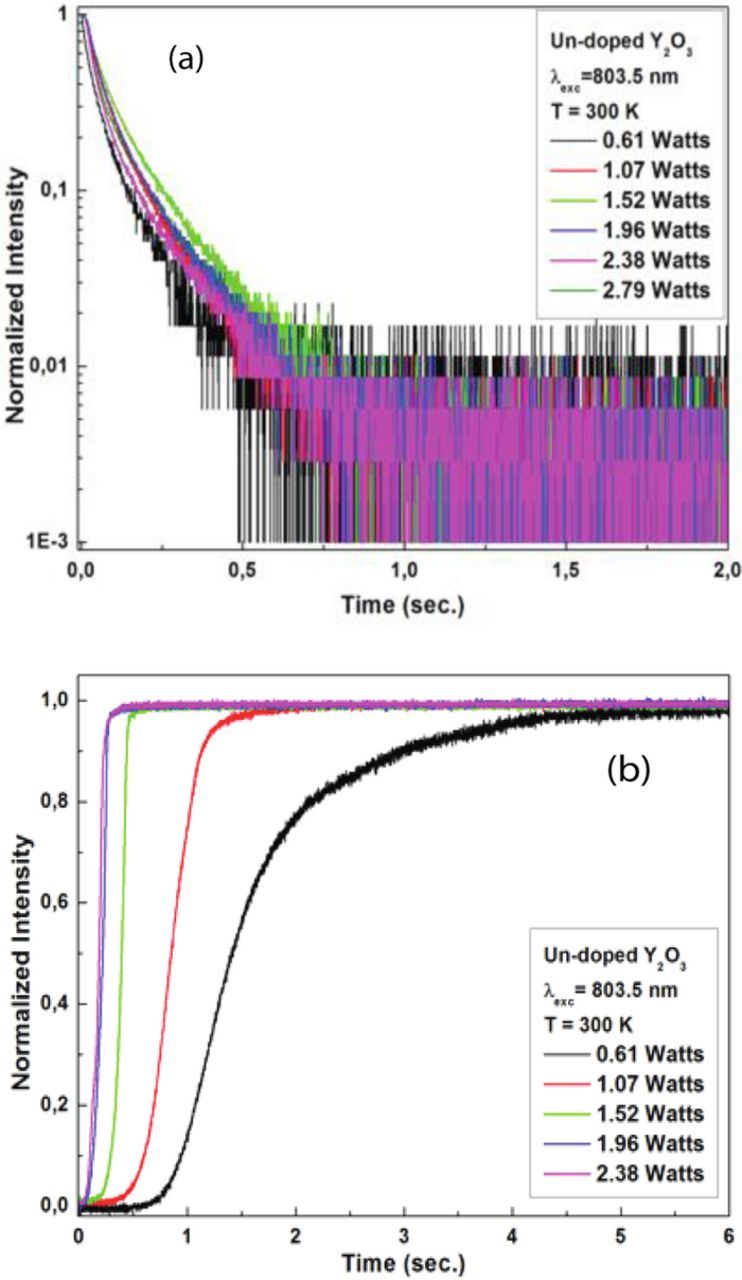
Figure 5. Pressure dependence of the white light emission from Y2O3.
White light emission from Al2O3 nano-powders
The γ-Al2O3 nanopowders with the crystalline size of 20–50 nm were purchased from Sigma-Aldrich. The Al2O3 has a bandgap of ∼7 eV. The white light emission spectra of γ-Al2O3 under 975 nm laser diode excitation at different excitation powers are given in Figure 6a. The raw data spectral profile of the white light emission was found to similar to that of the Y2O3 emission. As the laser intensity is increased, the peak of the emission shifts toward lower wavelengths. The measured color quality parameters using the illuminance meter (Figure 6b) showed that this emission has a CCT = 3285 K and a CRI = 86, which is poor in quality with respect to the emission from the Y2O3. The white curve in Figure 6b is the blackbody curve corresponding to a temperature of 3285 K. Obviously, the discrepancy between this spectrum and the blackbody curve is considerable. The pressure dependence of the emission intensity (not shown here) is similar to that shown in Figure 3 for Y2O3 nanopowders. The intensity of the emission vs. the excitation laser power (Figure 7) shows only a single slope, with n = 4.75.
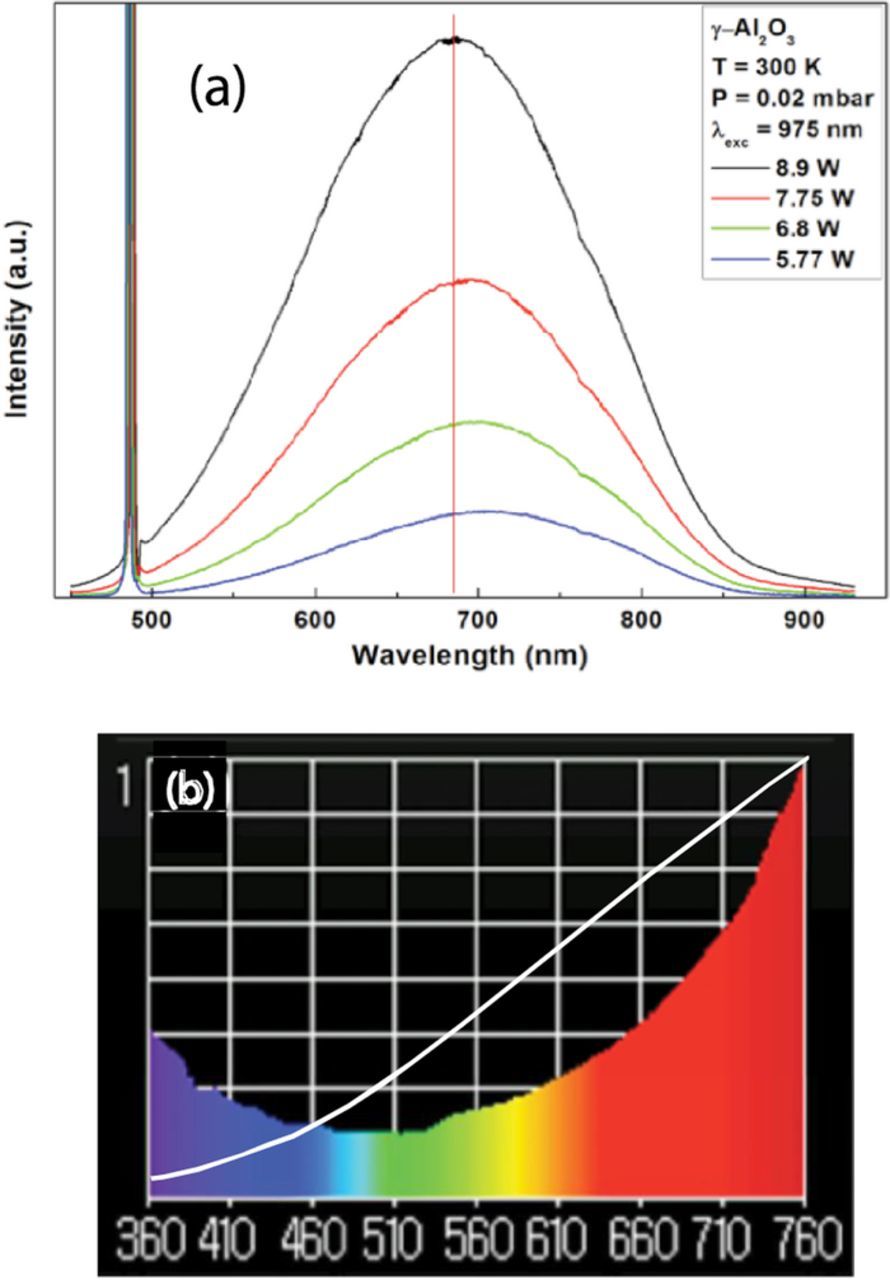
Figure 6. Raw data of white light emission from Al2O3 nano-powders under 975 nm excitation at different powers. (b) Sample spectrum taken with illuminance meter between 360 nm and 760 nm and blackbody curve at 3285 K.
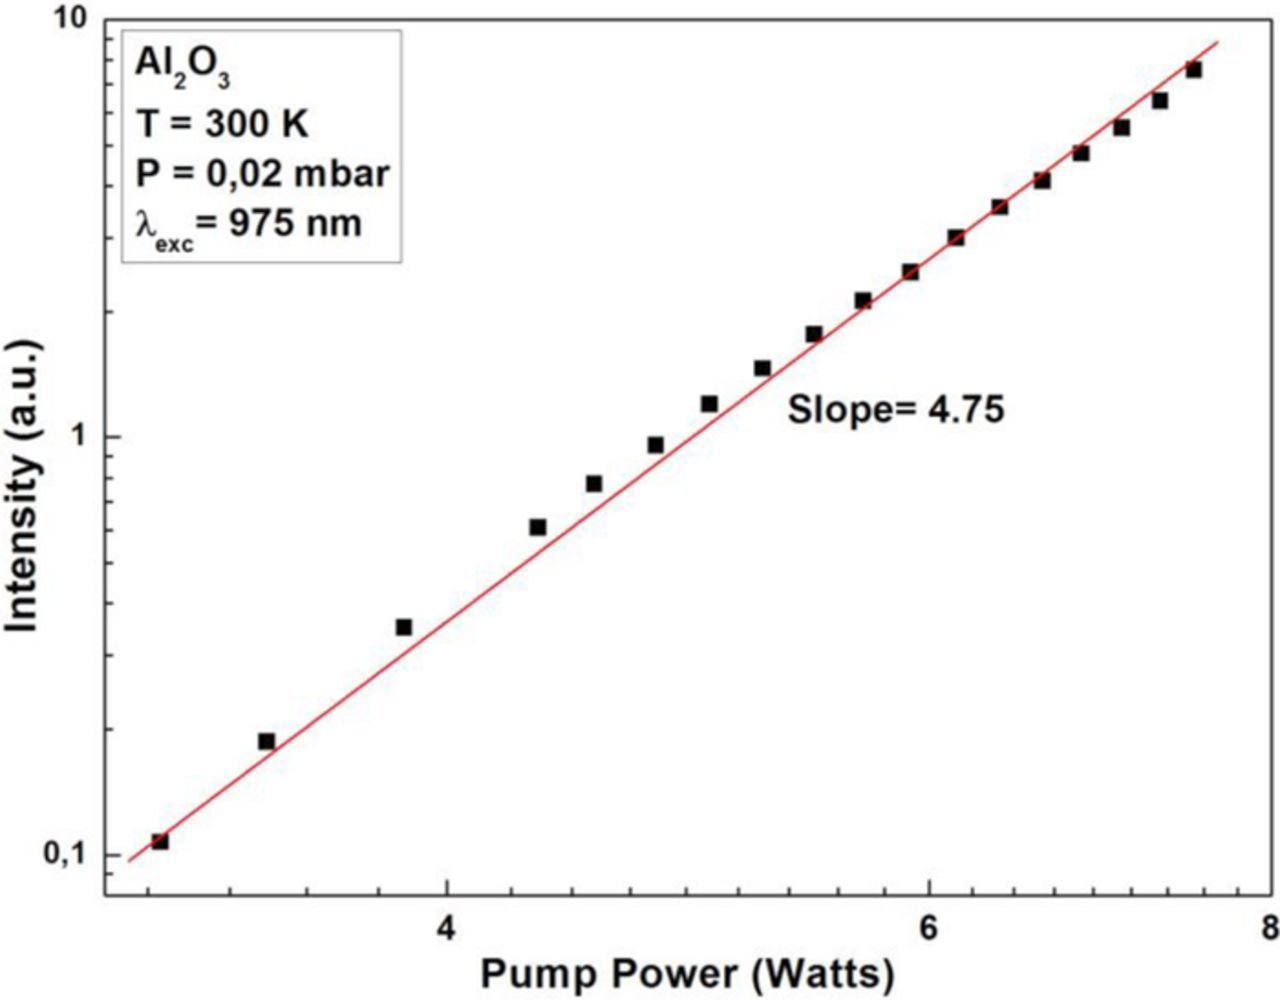
Figure 7. Log-log plot of Al2O3 emission intensity vs. 975 nm laser power.
Partially-Doped Nano-Powders
There are several studies in the literature of white light involving insulating hosts doped with one or more types of rare earth ions. [e.g. 2, 16, 17, 21] The results of these studies all show similar broadband emission that is reminiscent of thermal emission. As opposed to undoped systems, systems doped with optically active ions, such as rare earths, have energy levels that can provide a means of resonant absorption of the exciting radiation not present in the undoped system. Also, these ions have their own emitting levels that can contribute to the emission properties of these systems. In this section, we report on three representative systems, Yb-doped Y2Si2O7, Nd-doped Y2SiO5, and Nd-doped Y2O3.
Yb-doped Y2Si2O7
Yttrium silicate nano-powders doped with Yb were studied for Yb concentrations in the range 1%–20%. The Y2Si2O7 host has 3 phases: α, β, and y. When preparing the samples, α-Y2Si2O7 and y-Y2Si2O7 were the only phases found to be present. We report here on the emission properties of the white light, and its dependence on the phase is not considered here.
The emission spectra from Y2Si2O7 (Yb:10%) at low ambient pressure under different 975 nm laser excitation powers are shown in Figure 8. The Yb ions can absorb the 975 nm via the 4F7/2 → 4F5/2 transition. At low laser power (< 0.12 Watts), the main emissions correspond to Er emission in the 600–800 nm region. The Er emission was somewhat unexpected since it was not intentionally doped into the sample, but it is known to be present in low concentrations in Yb-doped systems. After the Yb ions absorb the radiation, it can transfer energy to the Er ion, resulting in a well-known upconversion process leading to Er emission in the visible region. One also notices emission lines just below 500 nm that are identified as being due to a cooperative emission process involving two Yb ions. As the laser power increases, the line emission from Er first increases, but eventually disappears and is replaced by a single broadband emission. As the excitation power increases further, the peak of the broadband emission shifts to the blue.
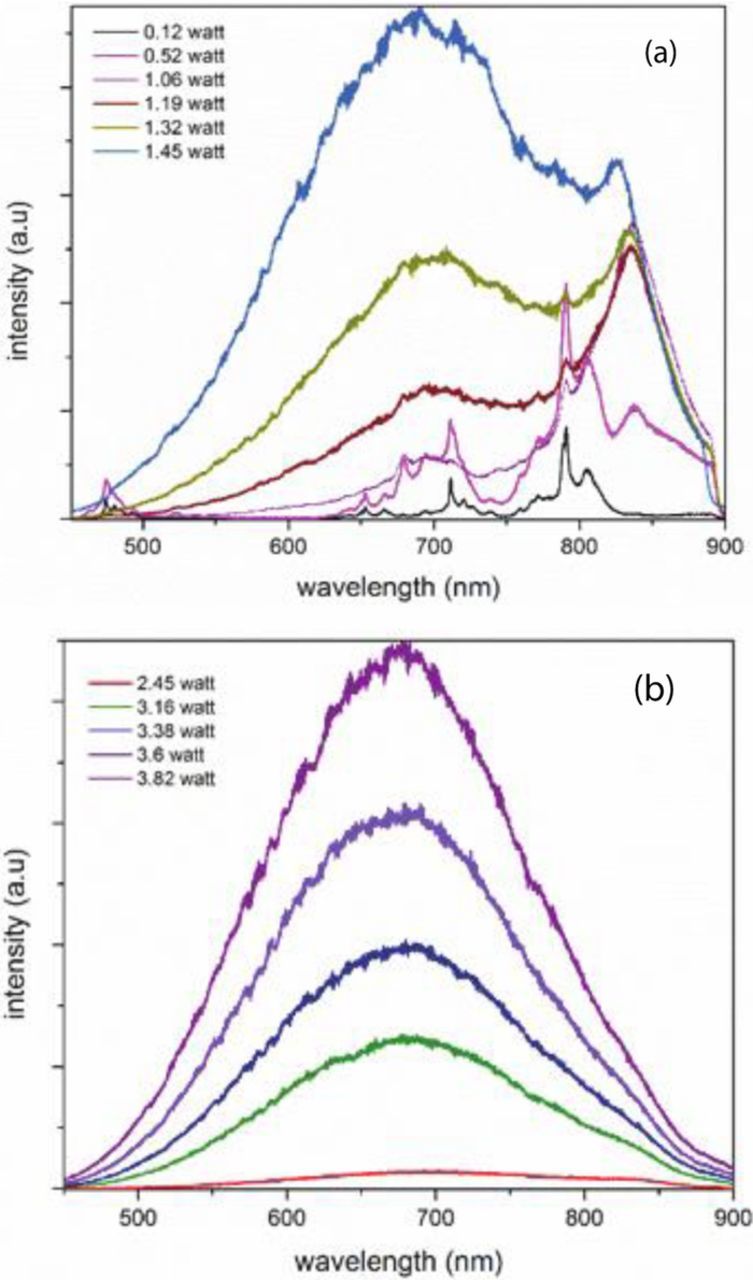
Figure 8. Emission spectra from Y2Si2O7:Yb(10%) at low pressure and under excitation with a 975 nm laser diode at (lower powers) and (b) higher powers.
Figure 9a shows how the intensity of the white light emission depends on pressure for different Yb concentrations, and Figure 9b shows how the threshold pump power at 975 nm depends on the Yb concentration. Both figures indicate that as the Yb concentration increases, the easier it is to obtain white light from the sample. Clearly, the presence of Yb, with an absorption line at the excitation wavelength, provides a direct pathway for transferring optical energy into the sample, which ultimately leads to heating of the sample and the corresponding broadband emission.
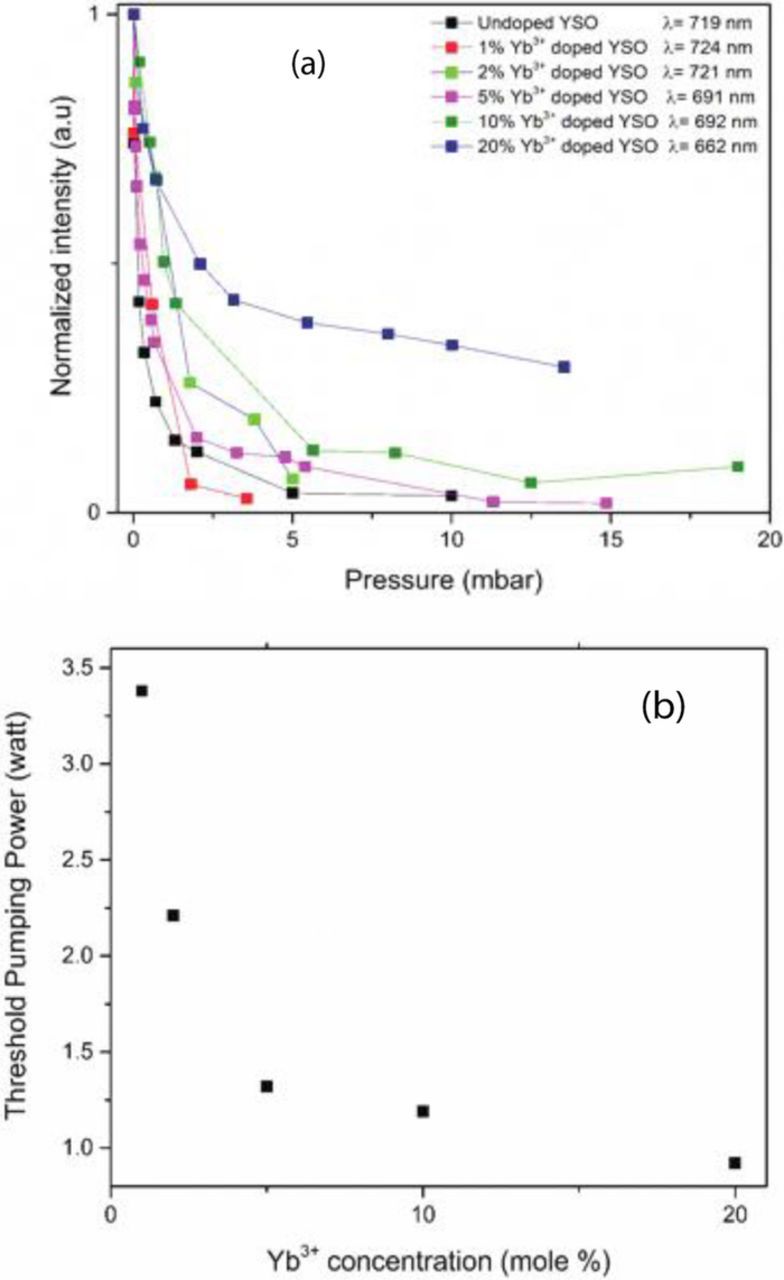
Figure 9. (a) Dependence of the intensity of the emission as function of pressure from Y2Si2O7:Yb at different Yb concentrations, and (b) threshold power of white light emission as a function of Yb concentration.
Nd-doped Y2SiO5
Y2SiO5 nano-powders with an average particle size of 51 nm doped with Nd(1%) was pumped with a laser diode at 808 nm. Emission spectra under different pumping powers at room pressure and at low pressure are shown in Figures 10 and 11, respectively. The spectra at room pressure show mostly line emission from Nd in the red region at low pump power, while at higher power the emission is largely broadband, with peaks showing evidence of Nd in the sample. At low pressure, the emission shows a combination of broadband emission and Nd emission, with peaks at 525 nm, 600 nm, 675 nm, and 750 nm. As pump power increases, the general features remain the same, with the broadband emission and the Nd peaks both growing in intensity.
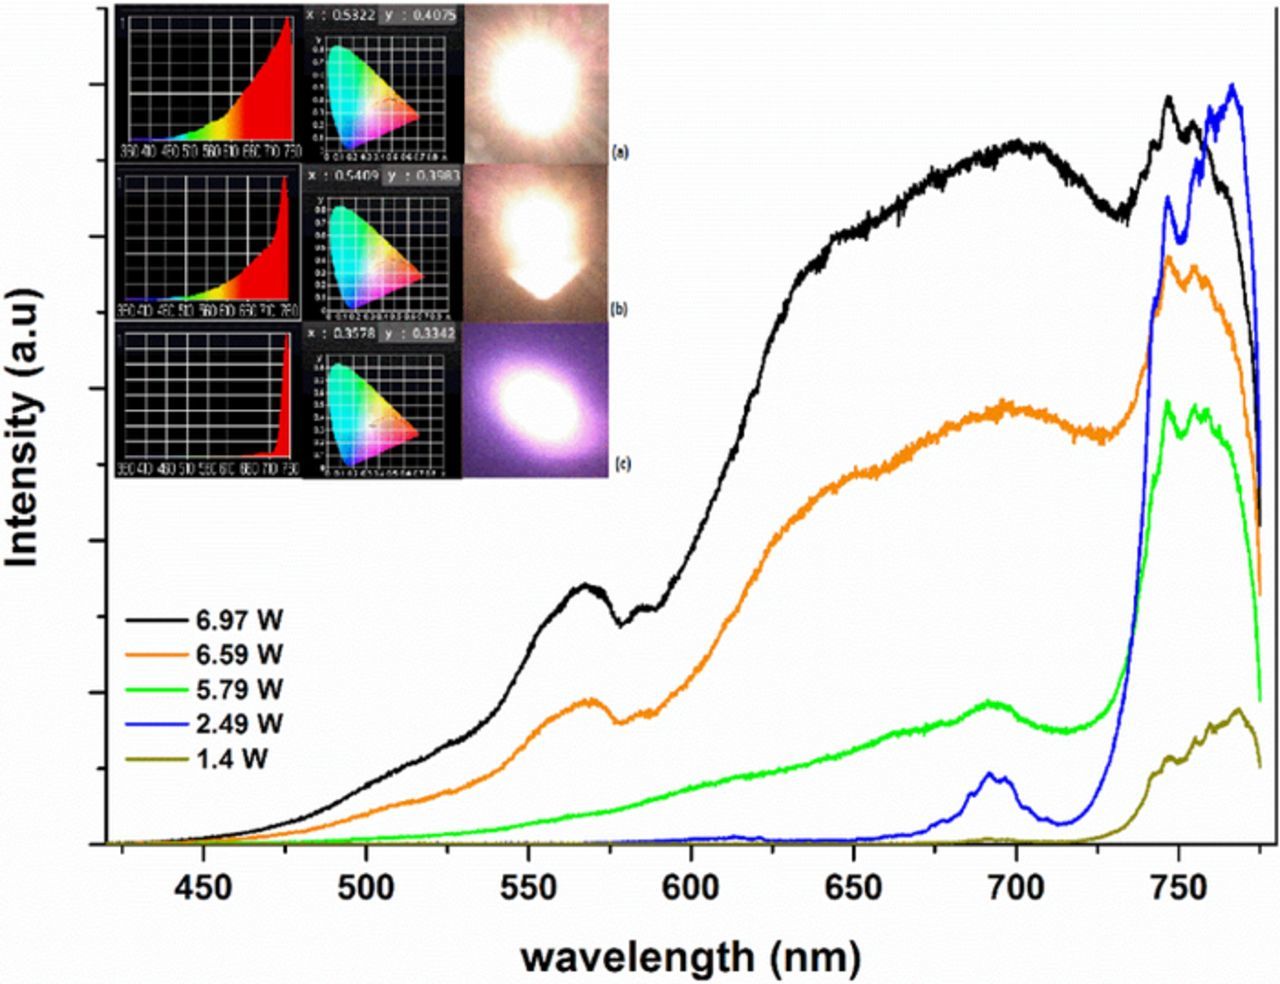
Figure 10. Emission from Y2SiO5:Nd(1%) under excitation at low powers with at 808 nm excitation. Insert shows the spectrum and color diagram placement as determined by the illuminance meter between 360 nm and 760 nm at three different pump powers. The corresponding CIE(x,y) coordinates of the emission shown in (c) are: (0.4551, 0.3548) at 1.4 Watts, (0.5177, 0.4121) at 5.79 Watts, and (0.5726, 0.4106) at 6.97 Watts.
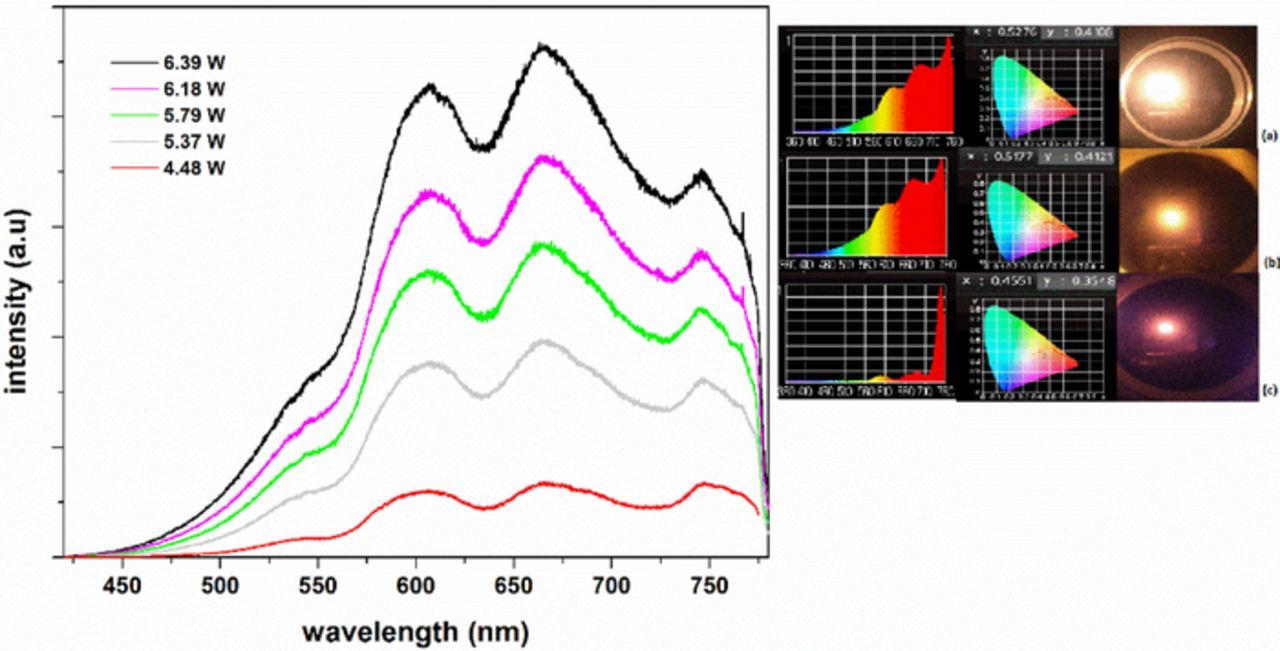
Figure 11. Emission from Y2SiO5:Nd(1%) under excitation at high powers with at 808 nm excitation.
Nd-doped Y2O3
Y2O3:Nd(20%) nanoparticles with average particle size of 26 nm were excited with a diode laser at 803.5 nm. The raw data and corrected emission spectra are shown in Figures 12a and 12b, respectively. The data show a broadband emission along with Nd emission peaks. As in undoped Y2O3 (Undoped Nano-powders section), the broadband emission continues to increase into the near IR. The spectrum taken with the illuminance meter (Figures 12c) shows a similar behavior, with the color temperature of 2422 K. The white curve in Figure 12c is the blackbody curve corresponding to a temperature of 2422 K. Although the spectrum shown on the illuminance meter is similar to that blackbody curve, the two curves deviate considerably from one another, particularly due to the Nd emissions and also to strong emission in the violet and near UV region.
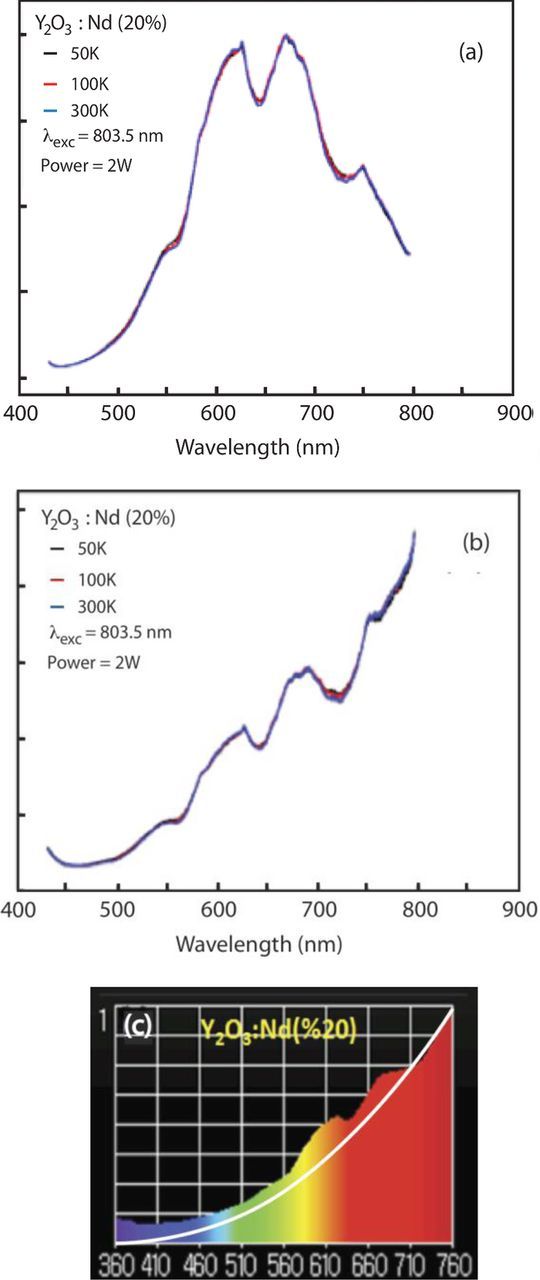
Figure 12. (a) Raw data and (b) corrected emission from Y2O3:Nd(20%) nanoparticles under 803.5 nm excitation. (c) The spectrum from the illuminance meter between 360 nm and 760 nm. The white curve corresponds to a black body at 2422 K.
Stoichiometric Rare-Earth-Doped Nano-Powders
Er2O3
The Er2O3 nano-powders studied had an average grain size estimated to be between 20 and 25 nm. We investigated the emission in this system at high and low pressure under excitation at 975 nm, a wavelength corresponding to the 4I15/2 → 4I11/2 transition of Er3+. The emission spectra are shown in Figure 13. A dominant white light emission was observed and the emission peak shifts to shorter wavelengths as pumping power increases.
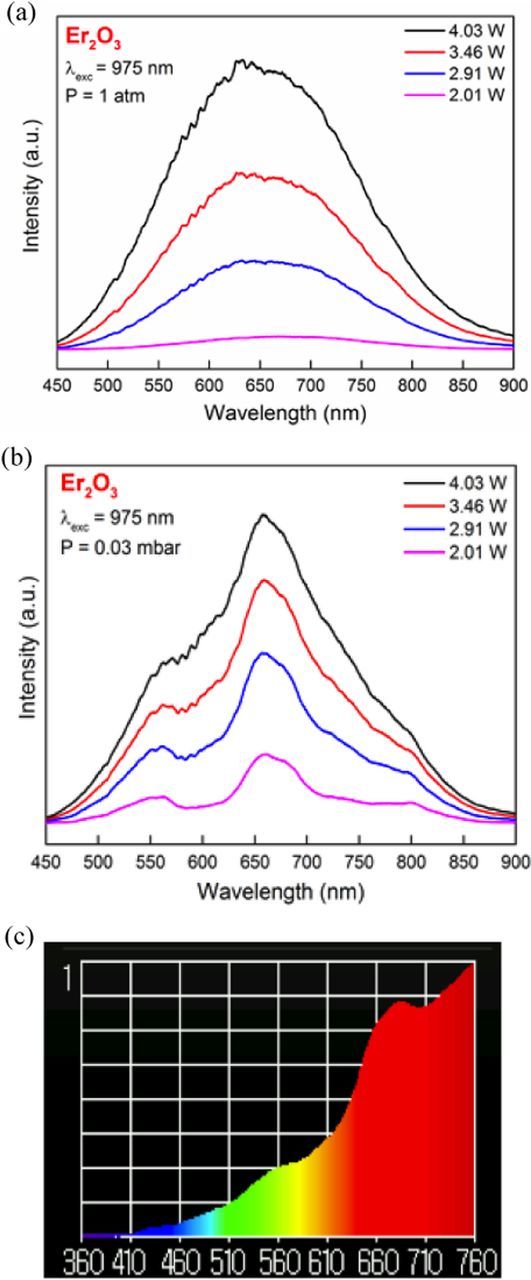
Figure 13. Emission spectra of Er2O3 nano-powder at (a) atmospheric pressure and (b) 0.03 mbar under high excitation powers. (c) shows the white light emission spectrum under 4 Watts as measured by the illuminance meter.
Generally speaking, at low pressure the white light intensity is much higher than at atmospheric pressure. For example, the white light intensity was measured to be ∼5 times stronger at vacuum pressure than at atmospheric pressure at an excitation power of 4 Watts. The peaks observed in the low-pressure spectrum correspond to emission transitions of Er3+: 4F15/2 →4I15/2, (550 nm), 4S3/2 →4I15/2 (660 nm), and 4I9/2 →4I15/2 (800 nm). Similar peaks were observed by Wang et al.24 at low pressure in Er2O3. The color temperature of Er2O3 nano-crystalline powder at room and vacuum condition under 4 Watts of 975 nm infrared excitation were measured to be 2467 K and 2281 K, respectively. Under excitation powers less than 1 Watt, the emission spectrum of the system at low pressure (.03 mbar) is shown in Figure 14. The emission spectrum shows the same four Erbium emissions as in Figure 13, but no broadband white light emission is observed at these low powers. At atmospheric pressure, no emission was observed at pump powers less than 1 Watt.
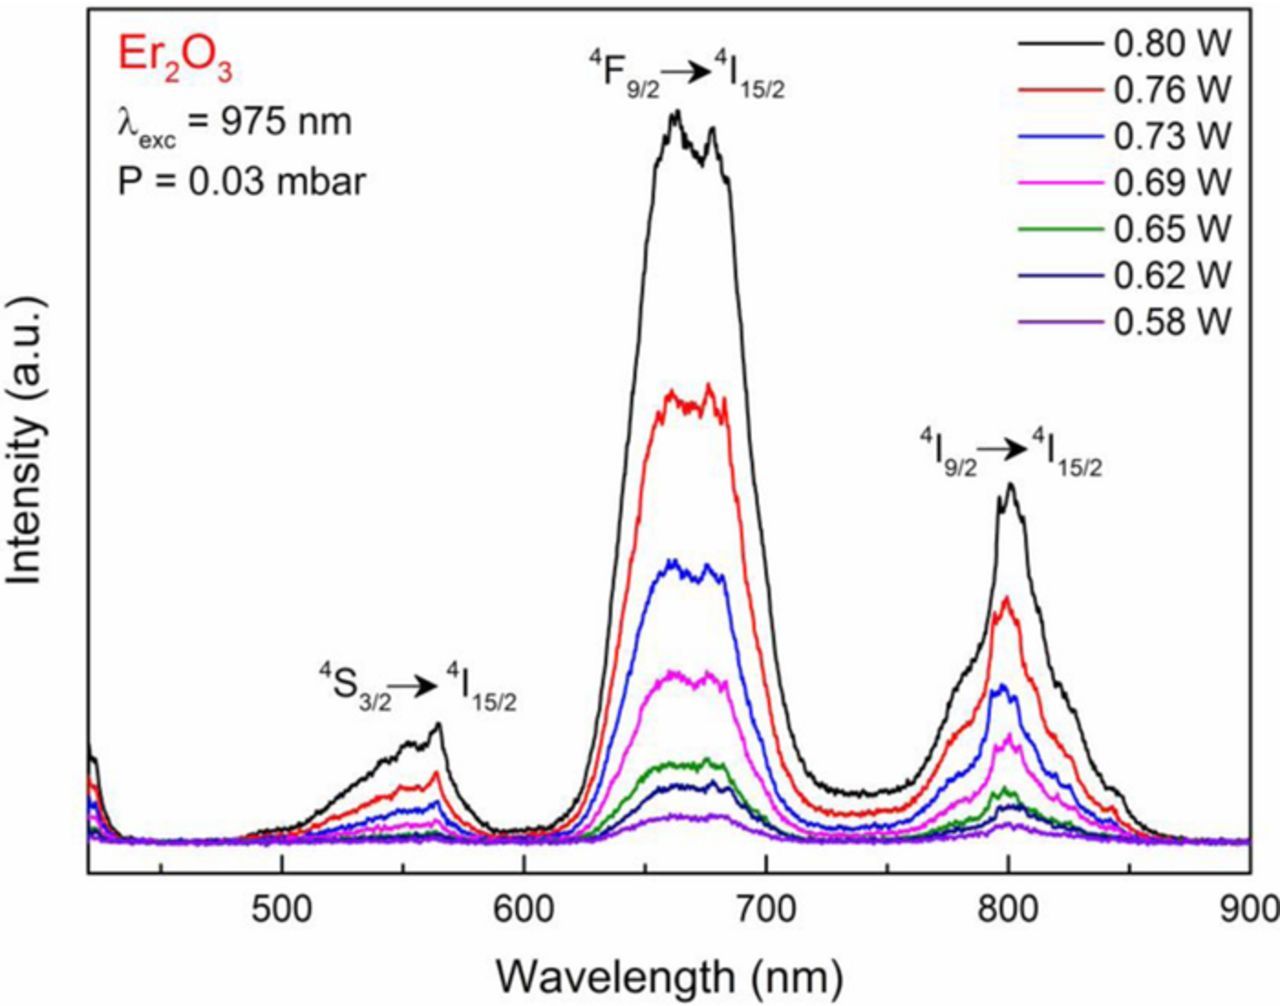
Figure 14. Emission spectra of Er2O3 nano-powder at 0.03 mbar pressure under low excitation power.
Figure 15 shows a ln-ln plot of the power dependence of the white light emission intensity of erbium oxide sample under vacuum and room pressure condition. The observed slopes of the lines, corresponding to the number of photons absorbed that produce a single emitted photon, are smaller under the vacuum than at atmospheric pressure. Also, we again notice a sharp transition from a higher to a lower slope value as the power increased beyond a certain value.
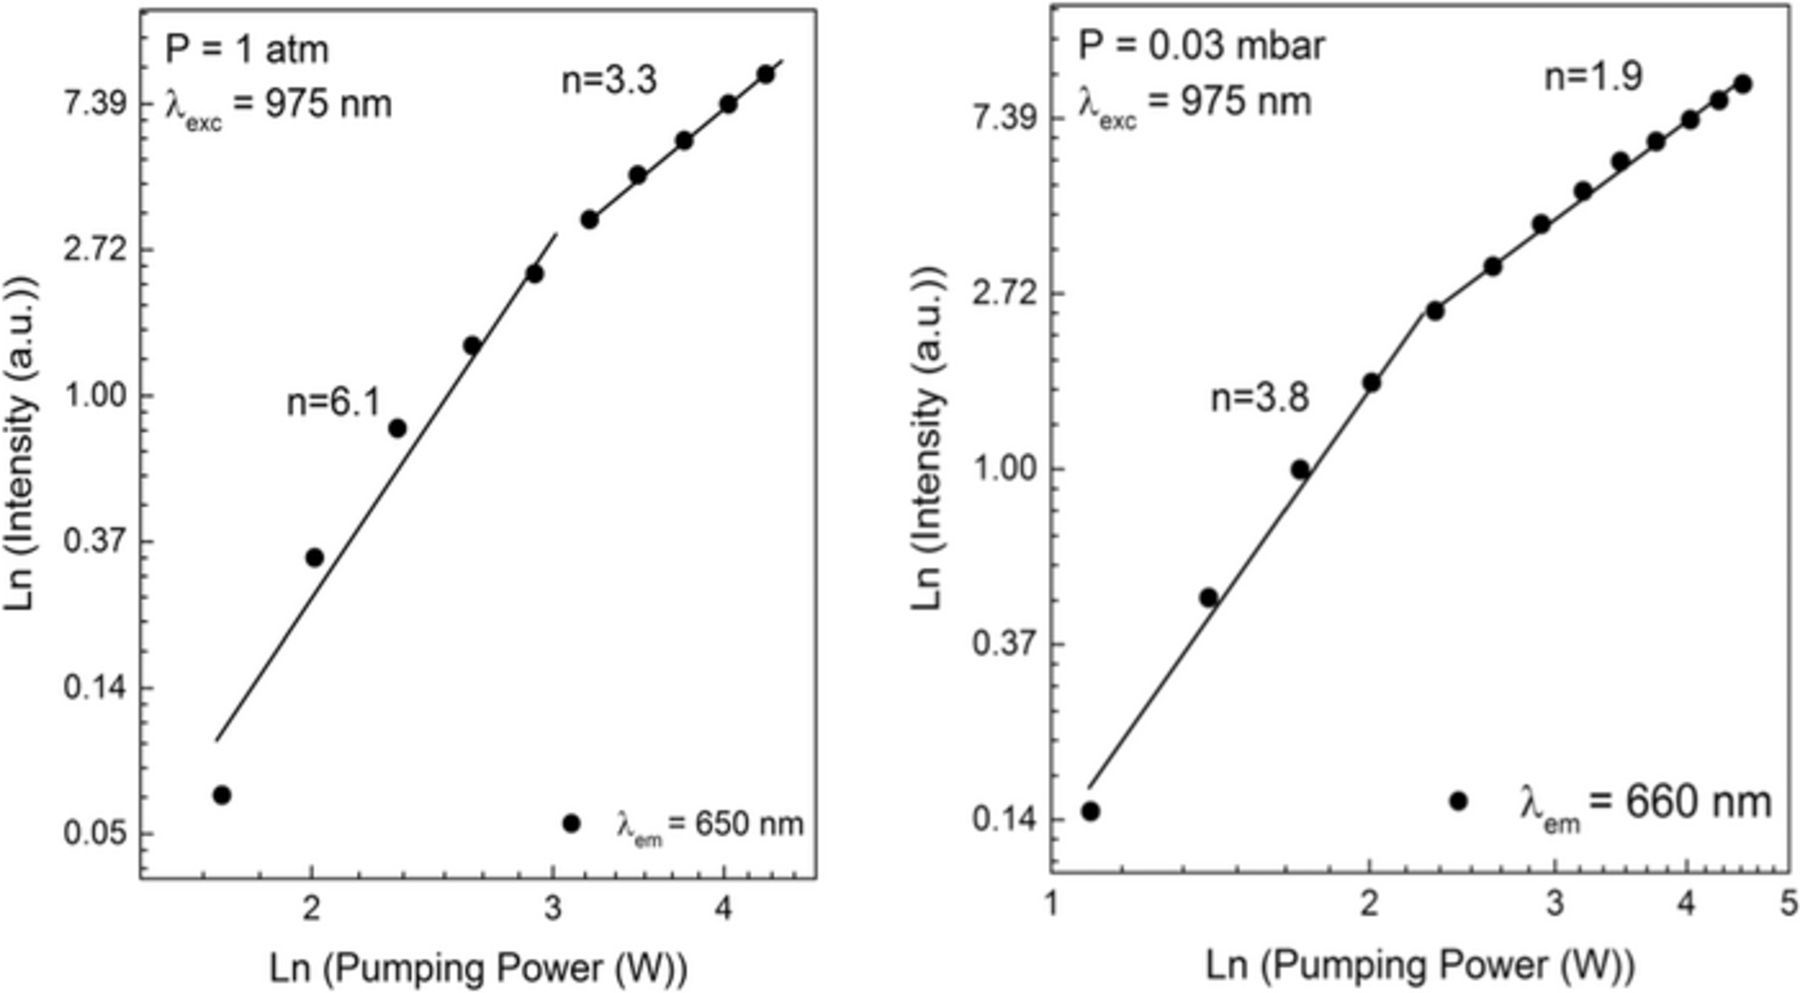
Figure 15. Ln-ln plot of emission intensity vs. pumping power in Er2O3 at pressure of (a) 1 atm and (b) 0.03 mbar.
The rise- and decay-patterns were also measured by the sudden turning on and shutting off the laser light, respectively, at 1 atm and 0.03 mbar pressure. The results are shown in Figure 16. The rise patterns are sensitive to the pumping power and the rise becomes faster as the pumping power increases, independent of the pressure conditions. The decay patterns are largely insensitive to pumping power at both atmospheric and low pressures. The rise times are generally longer at high pressure than at low pressure, whereas the decay times are shorter. These observations are consistent with the fact that at high pressure the sample will heat up more slowly after turning on the laser, and cool down more rapidly after turning off the laser, due to heat transfer into the gas. Also the timescales observed (a few seconds for the rise and a few tenths of a second for the decay) suggest heating and cooling times, rather than lifetimes associated with any energy level in the system.
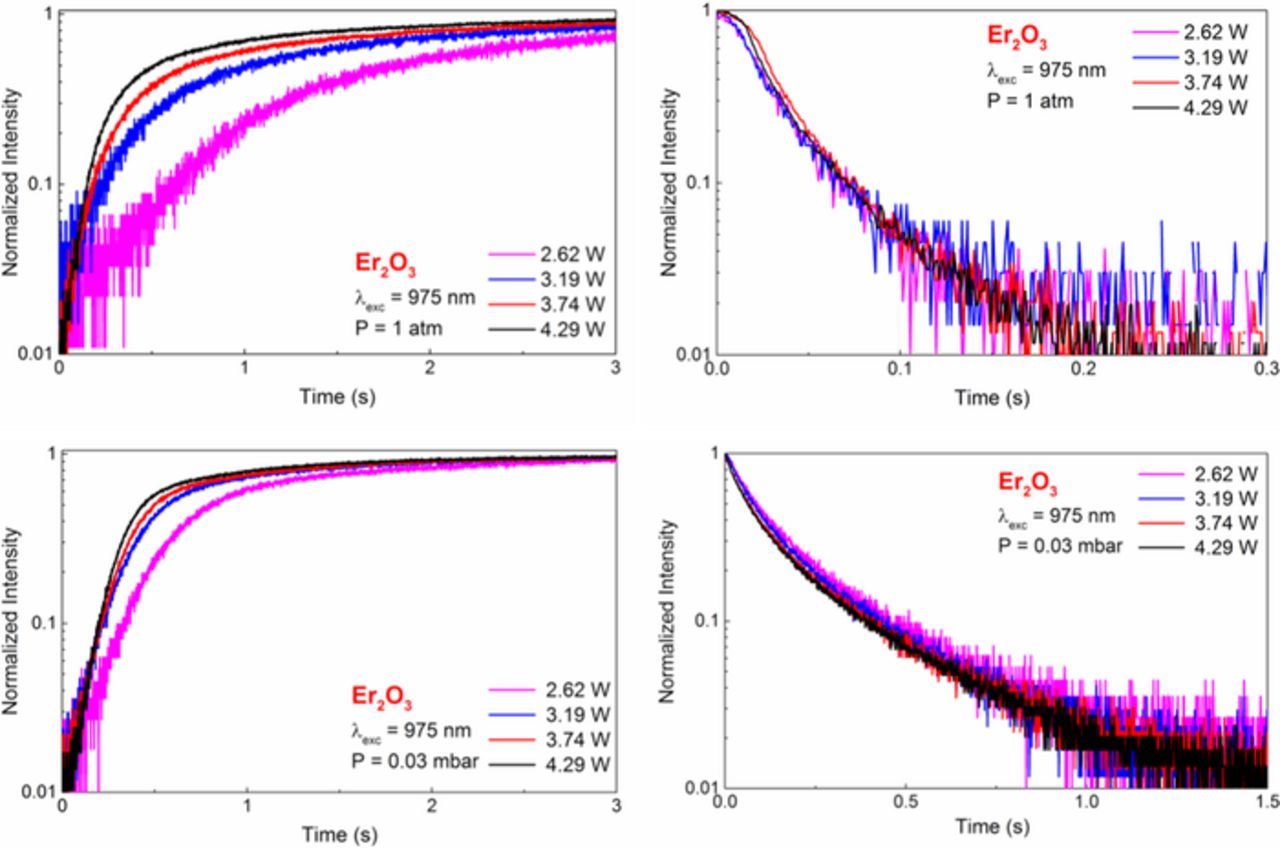
Figure 16. Rise and decay pattern of Er2O3 nano-powder powder at 1 atm pressure (top) and at 0.03 mbar (bottom).
Yb2O3
White light emission from cubic Yb2O3 nano-powders, with an average grain size of about 24 nm, were investigated by pumping the system with a laser diode at 975 nm, which corresponds to the 4F7/2 → 4F5/2 absorption transition in Yb. Emission spectra in the optical region with the sample at 1 atm and at 0.03 mbar pressures are given in Figures 17 and 18, respectively. Under vacuum, low intensity, cooperative emission from Yb3+ ion pairs are observed at ∼505 nm, indicated by the arrow in Figure 18. Figures 17 and 18 also show the white light spectrum as measured by the illuminance meter. The color temperatures were measured as 2435 K at room pressure, and 2535 K at .03 mbar. The color rendering index (CRI) of Yb2O3 at 4 Watts excitation power is the highest value (99%) under vacuum and at atmospheric pressure. Yb2O3 is whiter than erbium oxide at both atmospheric pressure and under vacuum.
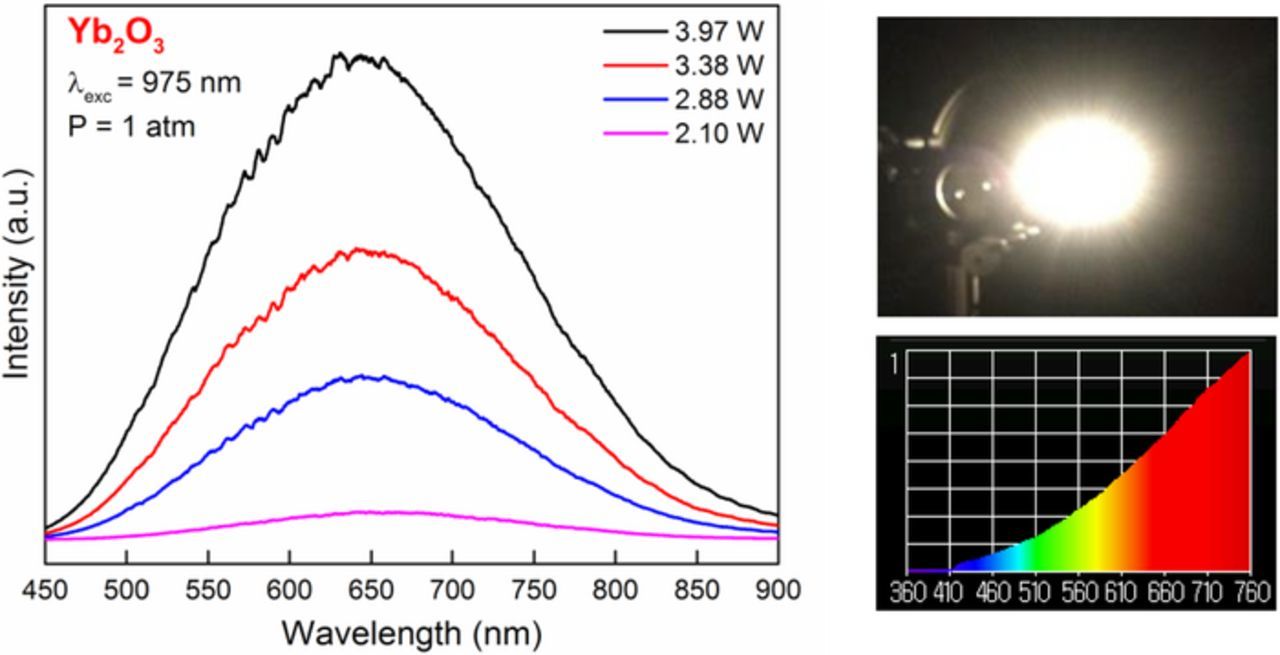
Figure 17. Emission spectra of Yb2O3 nano-powder powder at atmospheric pressure, a photograph of the white light (top right) and a spectrum between 360 nm and 760 nm taken with the illuminance meter.
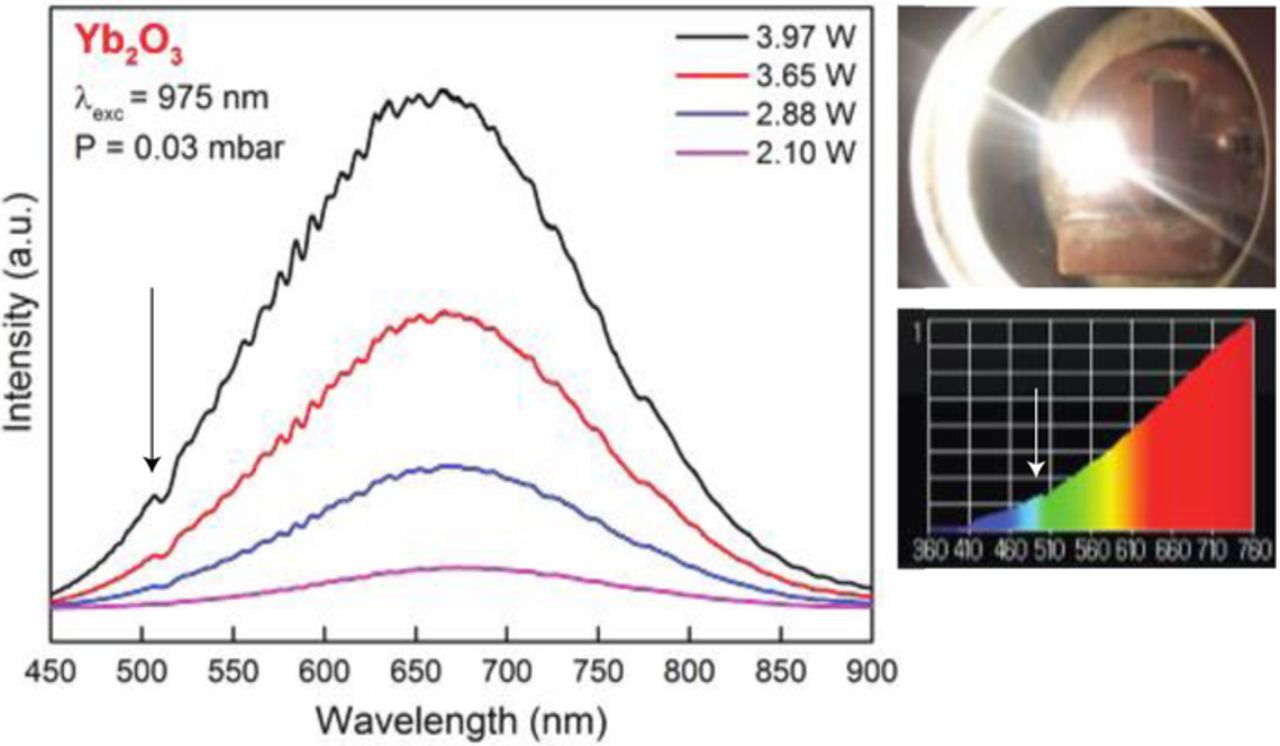
Figure 18. Emission spectra of Yb2O3 nano-powder powder at 0.03 mbar pressure.
Figure 19 shows the ln-ln plots of the luminescence intensity vs. the pumping power at atmospheric pressure and at .03 mbar. In both cases, at lower powers the slope is steeper, with values of 8.9 and 5.1 at high and low pressure, respectively. At high powers, the slopes are similar to one another, with values of 3.6 at 1 atm of pressure and 3.3 at .03 mbar. As previously observed, the transition from a larger slope to a smaller slope is abrupt.
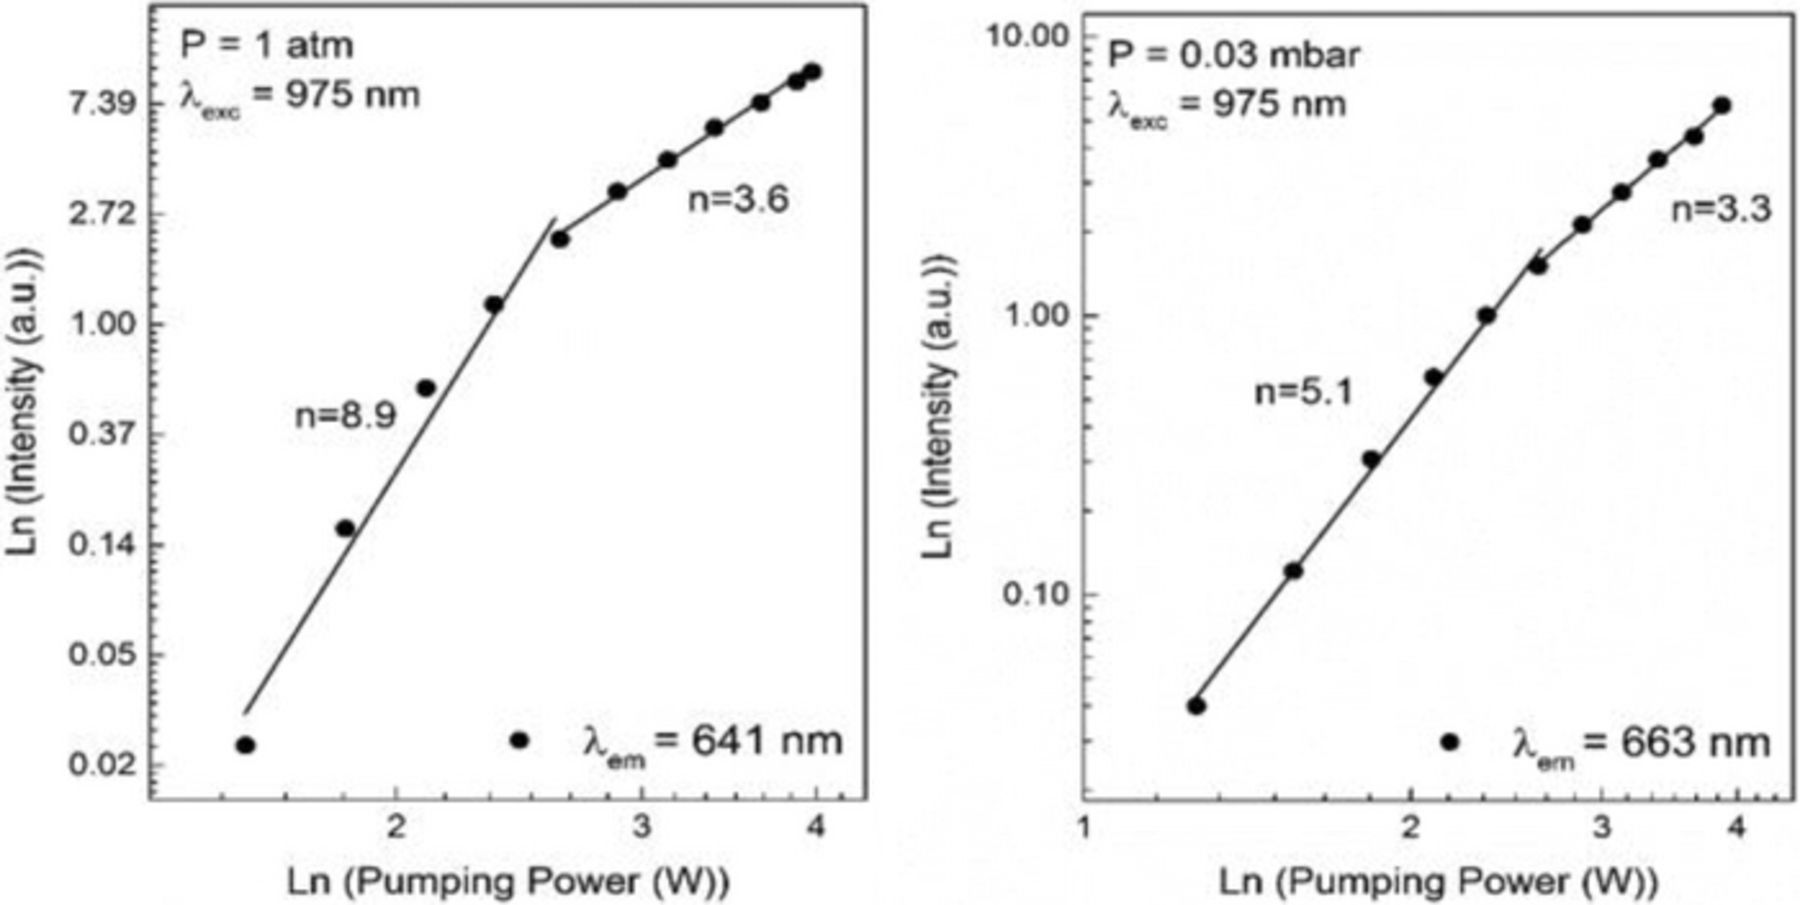
Figure 19. Pumping power dependence of the intensity of the 663 nm emission of Yb2O3.
Discussion
In this work we report on the generation of broadband, visible light from insulating materials, both undoped and doped with rare earth ions, under near IR excitation. The most fundamental task is to explain the origin of the emission and the processes leading to it. The work by Debasu et al.16 suggests that the observed white light is due to blackbody emission. The main evidence presented in that work are fits of the emission in the visible region to the Planck's blackbody emission curve (Eq. 1). Also consistent with this interpretation are the temporal data of the white light (Figures 5 and 16), which show the rise and decay patterns that are consistent with heating and cooling times, respectively, of the samples. Also, the observed dependence of the white light emission intensity on the pressure of the gas in the sample chamber (Figures 3 and 9a) suggest that when the gas conducts heat away from the sample, the temperature and the emission both decrease. Combining all these observations, it is possible that at least some of the observed white light emission is blackbody-like.
On the other hand, if the emission were blackbody-like, strong emission further into the IR (beyond 900 nm) would also be present. Emission spectra of Li1-xYbxP4O12 nano-crystals reported on by Marciniak et al.21 show no evidence of such thermal emission between 1–1.8 μm. Wang et al.24 also show emission spectra in Er2O3 in the 1100–1700 nm region under 975 nm pumping, in which the main emission is from Er near 1500 nm, and only a weak broadband emission is observed. Also, in the work presented here (Figures 1c, 2c, 6b, and 12c) there are significant differences between the observed emission and Planck's blackbody curve. In addition to the questions regarding the emission, there are also questions as to how the absorption of IR radiation occurs in these high bandgap materials, particularly in the undoped systems. Thus, it seems that a satisfactory understanding of the origin of the white light emission remains elusive.
In this discussion, we speculate on possible explanations of the observed properties (spectral, temporal, etc.) of the broadband emission and on the possible absorption processes. First, we highlight a few results that have been observed by others and/or us.
- (1)Based on experiments done by Strek et al.,11 a pellet formed of compressed rare-earth-doped nanoparticles exhibited photoconductivity when a voltage was applied across the sample and an IR source was used to excite white light. In that work, they conclude the "efficient photoconductivity starts before the white emission".
- (2)For many of the materials investigated in this work (e.g. Er2O3, Y2O3, Yb2O3), the log-log plots of emission intensity vs. power show a transition from a steep slope to a shallower slope as the pumping intensity increases, indicating an increase in white light efficiency once a certain threshold is reached.
- (3)An interesting experiment performed by Marciniak et al.21 used rare-earth-doped nanoparticles as thermometers to measure the temperature of the material under intense excitation conditions and while emitting the broadband white light. Their results indicated that the temperature of the material was on the order of 900 K, though the temperature associated with the emission (as measured with a thermal camera) was much higher.
- (4)In the undoped and doped nano-powders, there is broadband radiation, especially in the near UV and visible, that cannot be accounted for assuming that a single blackbody radiator is responsible for all of the emission.
Let us first consider some possibilities of how the exciting IR radiation is absorbed by the undoped materials. In these materials, the only absorption will be from defect centers that happen to be resonant with the exciting radiation, where such defects may be part of the bulk material or may be located at the surface of the nanoparticles. Under low intensities, absorption by a defect center typically is followed by non-radiative relaxation back to the ground state. As the presence of white light shows, however, under high intensity excitation additional processes are occurring. Point (1) above shows that some of the electrons reach the conduction band before the white light is emitted. Reaching the conduction band in Y2O3 (bandgap = 5.6 eV) would require about four 800 nm (five 975 nm) photons. Thus, under high intensities, it appears that there are multiple upconversion processes (e.g. via excited state absorption, energy transfer, photon cascade) that excite electrons into the conduction band. The exact nature of the defect centers involved and which processes dominate the upconversion are unknown. In systems doped with optically active ions, the dopant ions, along with the defects, can act to absorb the exciting radiation, making it easier for the powders to absorb the radiation, resulting ultimately additional heating of the sample and more electrons in the conduction band.
As the dopant or defect centers absorb and decay non-radiatively, the sample temperature increases. It is well known that as the temperature increases, the bandgap decreases, thus we expect that the bandgaps of these materials will decrease as we increase the excitation intensity. Though a lot of work on the temperature dependence of the bandgap has been done in semiconductors, much less work has been done in insulators. One example is the work by Bortz et al.,25 which shows the bandgaps in MgO, MgAl2O4, and Al2O3 decrease by ∼1 eV as the temperature is changed from 300 K to 1400 K, exhibiting roughly a linear dependence. Given that the color temperatures we report on suggest our samples obtain temperatures over 2000 K, we expect our band gaps could be decreasing by as much as a few eV. Decreasing the bandgap by a few eV could make the absorption significantly more efficient, since a smaller gap decreases the order of the upconversion process necessary to bring electrons into the conduction band. Of course if the melting temperature is reached, the concept of a bandgap no longer holds. We have not seen any evidence of melting, though Redmond et al.23 report melting in Y2O3 nanoparticles doped with Er and Yb under very high pumping intensities (30 kW/cm2). In that work, the authors note that the porosity of the powders, which can vary from one location to another even in an apparently uniform powder, is very important in determining the local temperature within the powder.
Another possible contribution to the absorption is by electrons in the conduction band. Because the conduction band presents a quasi-continuum of energy levels, there will likely be electronic transitions at near IR energies by electrons near the bottom of the conduction band to higher energy levels in the band. When the density of electrons in the conduction band is high enough, the absorption could increase substantially.
These previous observations suggest how the IR radiation might be absorbed by undoped and doped nanoparticles. The decrease in the bandgap with temperature and the absorption of the exciting IR radiation by electrons in the conduction band imply that the absorption of the exciting radiation should increase with increasing power, because at high powers the temperature of the material is higher and more electrons are in the conduction band. These effects could account for point (2) above, i.e. the change in the slope of the log-log plots of white light emission intensity vs. laser power at high laser power (Figures 4, 15, and 19).
Now let us consider the mechanisms responsible for the white light emission. We first note that in the undoped materials at high laser intensity the white light emission is purely broadband; only in doped materials do we see line emission, and that emission can be attributed to the dopants. Let assume, then, that the broadband emission is from the host material. Many host materials (e.g. tungstates) produce broadband emission when excited into the conduction band. However, such emissions usually exhibit short lifetimes, in contrast to the long times over which the white light decays. One scenario that could explain the long lifetimes is if many of the excited electrons reside in traps below the conduction band, and thermally escape the traps into the conduction band over long time frames, similar to persistent luminescence.26 Once released from the traps, they occupy the energy states in the conduction band, resulting in a broadband emission. At elevated temperatures, the spectral content of the broadband emission may appear very different than at room temperature.
Let us now consider a second scenario; that a significant portion of the emission is from a blackbody at temperature T. By modeling the heat transfer properties of the powders, Redmond et al.27 showed that under high excitation intensities it is it feasible for the powder to reach the high temperatures, at least locally, that could lead to blackbody emission similar to what is observed. Also, Debasu et al.16 claims to have directly measured temperatures up to 1200°C, even under only modestly high pumping conditions, in a sample containing Gd2O3:Er,Yb nanorods coated with gold nanoparticles. In this scenario, much of the emission can be attributed to blackbody emission, so only the discrepancies between the observed emission and blackbody emission must be accounted for. In the undoped samples, the most severe of these discrepancies is the strong emission between 360 and 450 nm.
In order to account for these, let us consider the behavior of the electrons in the conduction band. As mentioned above, these excited electrons will absorb radiation, and may decay either radiatively or non-radiatively before absorbing another photon. Thus, these electrons will be continually recycled from higher to lower to higher energies in the conduction band. One possible scenario is that kinetic energies of this system of conduction electrons could obtain a high effective temperature, and emit blackbody radiation corresponding to that temperature. If the effective temperature of the conduction electrons is higher than the temperature of the ions of the lattice, that could explain point (4) above, since a higher temperature leads to a greater fraction of visible and near UV emission. In such a model, the hot electrons in the conduction band, through collisions with ions and other electrons, reach a steady-state, quasi-equilibrium; they absorb IR radiation, transfer some of that energy to the lattice through non-radiative decay processes, and emit blackbody radiation.
Let us use this model to re-examine the spectrum of undoped Y2O3 under 803.5 nm. The spectrum from the illuminance meter shown in Figure 1c shows a fit to Eq. 1 for the color temperature determined by the meter –2756 K. The fit is fair, but clearly there are emissions throughout the visible range that are not accounted for. A better fit is obtained if we assume two blackbody emissions, one at 2756 K (lattice) and the other at 3600 K (conduction electrons) according to the equation:
![Equation ([3])](https://content.cld.iop.org/journals/2162-8777/7/1/R3199/revision1/d0003.gif)
where I(λ, T) is the total emission intensity, I1 is the emission intensity due to the lattice at temperature T1, I2 is the blackbody emission intensity due to the conduction electrons at temperature T2, and C is fitting a parameter, which would be related to an effective surface area of the electronic system at T2 relative to that of the lattice at temperature T1. The fit, shown in Figure 20a (top line), has T1 = 2756 K, T2 = 3600 K, and C = 0.2, is much improved compared with the fit to the single blackbody emission at 2756 K (Figure 1c or bottom line in Figure 20a). We also used Eq. 3 to fit the Y2O3 emission under 975 nm excitation and the Nd-doped Y2O3 under 803.5 nm excitation. The results are shown in Figures 20b and 20c, which compares the fits with Eq. 1 with Eq. 3. We see that for these systems, the fits with Eq. 3 (top curves) are only marginally better that the fits to Eq. 1 (bottom curves). Examining the Al2O3 emission curve in Figure 6b, it is obvious that neither Eq. 1 nor Eq. 3 will give a good fit, due, in part, to the strong emission below 450 nm. The emission between 360 nm to 500 nm also limits the ability of Eq. 3 to provide good fits to the Nd-doped and undoped Y2O3 under 975 nm excitation.
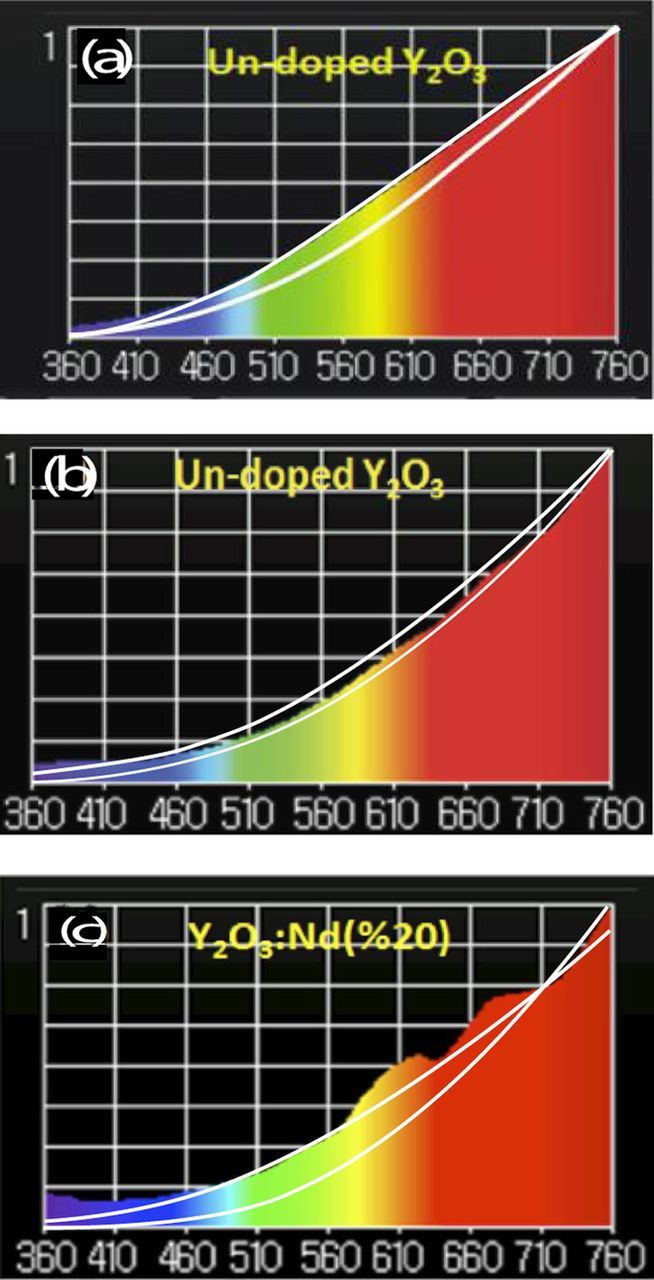
Figure 20. Spectra and fits in from 360 nm to 760 nm for (a) un-doped Y2O3 pumped at 803.5 nm, (b) un-doped Y2O3 pumped at 975 nm, and (c) Nd-doped Y2O3 pumped at 803.5 nmIn each figure, the bottom-most fit is to Eq. 1 with the temperature given by the color temperature as determined by the illuminance meter (see text), and the top fit is to Eq. 2, with the following parameters: (a) T1 = 2754 K, T2 = 3600 K, and C = 0.2, (b) T1 = 2300 K, T2 = 3700 K, and C = 0.02, (c) T1 = 2190 K, T2 = 3200 K, and C = 0.09.
Given that the assumptions underlying Eq. 3 cannot account for all the emission in the violet and near UV in both undoped and doped systems, the origin of some of these emissions likely involves transitions of the host material. The roles of the host and the defects have been mentioned above, and those emissions may account for those that cannot be ascribed to blackbody emission. More work needs to be done to determine whether defect centers are important to the white light emission.
In our experiences, the near infrared-excited, broadband, white light emission is observed only in nanoparticles. Regarding this, there are two relevant differences between bulk crystals and nanoparticles to consider. First, the larger surface-to-volume ratio in nanoparticles leads to more surface defects. These defects could assist in the absorption of near IR radiation as the electrons are promoted into the conduction band. Also, the thermal conductivity through the sample will generally decrease as the particle size decreases, in part because the porosity of the sample will tend to increase as the particle size decreases. Redmond et al. have found that under high power excitation heating to high temperatures is more likely to occur in regions of high porosity. Thus, in nanoparticles there is a greater likelihood of local heating to the high temperatures needed to produce strong, visible thermal emission.
The role of dopants in the white light emission is twofold. First in the materials that are partially- and fully-doped with rare earth ions, the white light is accompanied by f-f transitions of the dopants. The peaks of these transitions are clearly visible in the spectrum. Only when the dopant level was very low, as the Er impurity in Yb2O3, the dopant emission is observed only at low excitation intensity. When the dopant concentration is significant, the f-f lines are easily observed. Consider, for example, the Y2SiO5:Nd(1%) emission, shown in Figure 11. This Nd emission is a result of electrons in states having energies greater than the pump photon energy (i.e. from higher Nd levels or from the conduction band) relaxing to metastable Nd levels, from which emission occurs. These electronic levels associated with the rare earth ions provide further absorption, followed by non-radiative losses that help heat the sample. Referring to Figures 11 and 13b, the fact that the strength of the rare earth ion emission lines increase as the white light emission increases indicates that the ground state absorption of rare earth ions is not near saturation; even at high pumping intensities there are always a significant number of dopant ions that can continue to absorb the pumping radiation. Thus, we see that the dopant ions are responsible for the line emission, and also for increasing the white light emission by both increasing the absorption and, through that process, increasing the non-radiative decay processes that are responsible for heating up the sample.
Conclusions
In this paper we present work on the white light emission from several insulating hosts, undoped and doped with rare earth ions. Fits of the spectral data to blackbody emission curves, in addition to temporal behavior and pressure dependence of the white light emission, suggest that much of the emission is consistent with blackbody emission. However, a significant part of the observed emission, especially in the high energy range (UV and violet), cannot be accounted for in the single blackbody model. We suggest two possible mechanisms that could account for this unexplained emission. First, we propose a model whereby the electrons in the conduction band under high intensity excitation can form a second, blackbody-like system that exists at higher temperature than the measured temperature of the system, resulting in additional broadband emission of photons of higher average energy. Fits of the spectrum to the model of two sources of thermal emissions at different temperatures are excellent for the Y2O3 system under 803.5 nm pumping, but cannot completely explain the emission from other systems. Thus, a different emission process must be occurring, which we speculate could involve impurities, vacancies, or other traps that exist these systems.
In order to better understand the origin of white light in nano-powders, investigations into these systems should include the following. (1) The emission should be investigated further into the infrared, in order to verify that the white light is blackbody emission. (2) The blackbody curves need to be checked for a larger number of materials for the over a wide range of excitation intensities. That is, it needs to be understood under what conditions the fit to Eq. 1 is valid, and under what conditions other emission processes play a significant role. (3) The role of defects and traps in the absorption and emission processes need to be investigated, especially to see if they can account for the strong emission in the violet and near UV. (4) Especially in the undoped, wide gap materials, it is of interest to discover what absorptions are occurring that could help bring an electron into the conduction band. (5) Finally, it would be interesting to investigate the role of the surface in both the absorption and emission processes.