
Abstract
X-ray photoelectron spectroscopy (XPS) was used to investigate the surface chemistry of high voltage spinel, LiNi0.5Mn1.5O4 (LNMO) positive electrodes cycled 5 and 10 times in Li-cells with 1 M LiPF6 in (3:7) EC:DMC. The XPS spectra were collected using conventional Mg X-rays with energy of 1253.6 eV as well as synchrotron X-rays with energies of 2493.6 and 3498.4 eV in order to examine the depth distribution of various surface chemical species induced during cycling. The XPS spectra revealed a 5 – 10 nm surface layer of organic and LixPFyOz-type species formed as result of electrolyte decomposition, and a comparatively thinner layer composed of transition metal fluorides and LiF. These results suggest that electrolyte decomposition is a major contributor to parasitic reactions in LNMO battery electrochemistry. Limiting electrolyte decomposition with the use of solvents with wide electrochemical stability windows thus comprises a promising strategy for ensuring the practical feasibility of high voltage spinel materials in future Li-ion systems.
Export citation and abstract BibTeX RIS

This is an open access article distributed under the terms of the Creative Commons Attribution 4.0 License (CC BY, http://creativecommons.org/licenses/by/4.0/), which permits unrestricted reuse of the work in any medium, provided the original work is properly cited.
Rechargeable lithium-ion batteries (LIBs) are among the widest used energy sources for portable electronic devices, but are currently being considered for more energy-dense applications such as electric vehicles and short-term grid support. In order to realize these possibilities, gravimetric energy densities of typical LIBs, which currently provide 400–550 Wh/kg need to be improved. LiNi0.5Mn1.5O4 (LNMO) is a particularly promising positive electrode material in this regard, as it operates at an exceptionally high voltage of 4.8 V vs Li+/Li,1 resulting in an energy density of ∼706 Wh/kg based on a theoretical capacity of 147 mAh/g for 1e− transfer.2 Such a high voltage is however above the potential at which most LIB electrodes, cell components and electrolytes decompose (>4.2 V vs Li+/Li), and results in the formation of highly resistive parasitic species that hamper battery reversibility and cycle life.
In order to design LIBs that are chemically stable enough for practical application, a strong fundamental understanding of electrolyte decomposition and side product formation mechanisms is required. In positive LIB electrodes, battery cycling typically results in an electrode-electrolyte interface (EEI), the study of which can yield mechanistic insights into particularly critical parasitic reaction pathways responsible for poor electrochemical performance.3 Thus, understanding the structure and composition of the surface EEI in LNMO-based positive electrodes is key to their commercial realization.
Previous studies exploring LNMO performance degradation during cycling have explored the influence of stoichiometry,4 cation ordering,4,5 doping6 and particle morphology.5,7,8 There have been relatively fewer studies exploring EEI formation in detail, likely owing to the difficulty of characterizing thin layers (typically < 20 nm) of product. Using Raman and Electrochemical Impedance Spectroscopy (EIS) measurements, Aurbach et al.9 suggested that LNMO is stable upon aging in contact with dimethyl carbonate (DMC) and ethylene carbonate (EC)-based electrolytes. However, using X-ray photoelectron and Fourier-transform infrared (FT-IR) spectroscopy measurements, Yang et al.10 showed that constant polarization of LNMO at 4.5 V vs Li+/Li results in the oxidation and polymerization of EC, forming poly(ethylenecarbonate) (PEC) species. EC oxidation has been rationalized on the basis of a high highest occupied molecular orbital (HOMO), which has inspired the use of fluorine-based electrolyte solvents with lower HOMO that result in smaller capacity fade during LNMO cycling.11,12
Despite these advances, an accurate understanding of the chemical composition and thickness of the EEI in LNMO remains elusive. Raman, EIS and FT-IR measurements are not specifically sensitive to the surface chemistry of parasitic species formed during electrochemical conditioning, and conventional, lab-based XPS probes only ∼ 2 nm of product, whereas EEI thicknesses are typically larger. Such information is critical for understanding the relative contributions of electrolyte decomposition10,13,14 and transition metal dissolution15,16 to the EEI and capacity fade, about which there is considerable debate.
In this study, we used X-ray photoelectron spectroscopy (XPS) spectra collected with conventional and synchrotron X-rays at different excitation energies to study the depth distribution of various chemical species of the EEI in Li/LNMO cells after 5 and 10 cycles. XPS allows a fairly precise understanding of decomposition reactions at the EEI, as it combines elemental specificity in chemical species identification with unique surface sensitivity (within ∼ 1–10 nm of the surface). Depth profiling using different excitation energies17 was used as an alternative to Ar-ion depth profiling to avoid changing the electrode chemical state via bombardment with Ar-ions. Conventional XPS spectra were measured using a non-monochromatic Mg Kα (1253.6 eV) while synchrotron XPS spectra were collected utilizing monochromatic X-rays with excitation energies of 2493.6 and 3498.4 eV. Combining results from different core spectra and excitation energies resulted in the reconstruction of depth distributions of concentrations of different chemical species formed on the positive electrode during cycling. We have found that (i) the positive electrode surface became more Li-rich with cycling and that (ii) a thick, 5–10 nm layer composed of LixPFyOz and organic species was formed as a result of decomposition of the LiPF6 electrolyte salt and carbonate electrolyte solvent, while a thinner (<4 nm) layer of transition metal fluorides was formed close to the positive electrode surface. These results suggest that electrolyte decomposition plays a major role in previously observed capacity fade during LNMO cycling, and further support the importance of developing solvents or additives that confer wider (>5 V vs Li+/Li) electrochemical stability window to electrolytes used in practical high voltage spinel systems.
Experimental
Electrochemical measurements
LNMO was prepared in the ordered phase18 using a two-step solid-state method with Li2CO3 (Alfa Aesar, 99.998%) and nickel manganese oxide (molar ratio Ni:Mn = 1:3) coprecipitated from nickel nitrate hexahydrate (Alfa Aesar, 98%) and manganese nitrate hydrate (Alfa Aesar 99.98%). Li2CO3 and nickel manganese oxide were uniformly mixed with mortar and pestle (lithium 1.4% molar ratio rich), and the mixture was heated first at 1000°C for 30 min and then subsequently annealed at 700°C for 24 h under pressurized oxygen at 200 kPa. The positive electrode material was prepared by ink-casting LNMO powder and polyvinylidene fluoride (PVDF) binder onto a 15 mm diameter Al foil substrate, and pressing the finished positive electrodes at 166 MPa. Reversible electrode capacities and cycling stability were tested using a two-electrode lithium cell (Tomcell type TJ-AC). Lithium cells were constructed inside a glove box (H2O, O2 < 0.1 ppm, Mbraun, USA) using a lithium metal foil as the negative electrode and LNMO positive electrode separated by two polypropylene microporous separators (Celgard 2500). The electrolyte used was 1 M LiPF6 in EC:DMC (3:7 by volume). The assembled lithium cells were rested for 6 h for full electrolyte wetting, prior to electrochemical cycling at a C/5 rate between 3.5 and 5.0 V for either 5 or 10 cycles. Cycled cells were disassembled in the glove box.
XPS measurements
Three sets of XPS spectra were collected. The first set was collected using a Physical Electronics model 5400 X-ray photoelectron spectrometer. The excitation source used was nonmonochromatic Mg Kα (1253.6 eV) located at 54.7° relative to the analyzer axis and was operated at 400 W (15 kV and 27 mA). The model 5400 spectrometer incorporated a model 10-360 electron energy analyzer with an Omni-Focus I input lens to the analyzer (small area mode). The data were collected at an electron-take-off angle 45° with respect to the sample plane. Each positive electrode was removed from the hermetically sealed container and mounted onto the sample puck with only a few minutes of exposure to ambient conditions. The introduction chamber was evacuated for 10–15 min before transferring the sample to the analysis chamber. Data collection proceeded when the pressure in the analysis chamber reached ∼2 × 10⁻⁸ Torr. Survey spectra (0–900 eV) were collected at analyzer pass energy of 89.45 eV with energy resolution of 1.34 eV, 0.5 eV/step and an integration interval of 50 ms/step. The survey spectra consist of the average of 20 cycles with total acquisition time of 30.42 min. Multiplex spectra were collected at analyzer pass energy of 35.75 eV with energy resolution of 0.54 eV, 0.2 eV/step and an integration interval of 50 ms/step. The binding energies were reported with respect to the binding energy of the C 1s line for carbon black at 284.4 eV, which is in close agreement with a number of previously reported results.19,20 The binding energies of reference compounds in powder form are reported with respect to hydrocarbon at 285.0 eV. These procedures yielded the same binding energies for the C 1s and F 1s lines for powder polyvinylidene fluoride PVDF and an electrode, which consisted of a mixture of PVDF and carbon black.
The second and third sets of spectra were collected on beamline X24A of the National Synchrotron Light Source utilizing monochromatic X-rays with energy of 2493.6 and 3498.4 eV, respectively, compared to 1253.6 eV for Mg Kα X-rays in order to increase the depth of the analyzed region. The experimental setup consisted of a 2-stage high vacuum chamber with base pressure below 10−9 Torr and a Scienta R4000 detector running in transmission mode at pass energy of 200 eV with 0.3 mm analyzer aperture. The pass energy and aperture combination gives a resolution of about 0.29 eV at beam energy of 2139 eV as measured by the width of the Ag Fermi foot; though it will change with energy. The spectra were collected at an electron takeoff angle of 80° relative to the plane of the sample. The angle between the beam axis and the analyzer axis is 90°.
The sampling depth (SD90), defined as three times the mean free path, of C 1s, O 1s and F 1s, photoelectrons generated by Mg X-rays (1253.6 eV) at an electron takeoff angle of 90° with respect to the sample plane are 7.3, 5.8, and 4.8 nm, respectively.21 Note that (1) the sampling depth at an electron takeoff angle of θ degrees, SDθ, is equal to SD90*sin(θ) and (2) the sampling depth is proportional to (E)m where E is the kinetic energy of the photoelectrons and the exponent m for many elements and compounds is very close to 0.77.22 Based on the above discussion, the sampling depths for the Li 1s, C 1s, O1s, F 1s, P 2p, Mn 2p and 3p, Ni 2p and 3p are reported in Table I and will be referred to as needed.
Table I. The sampling depths SD of C 1s, O 1s, F 1s, and Co 2p lines at different energies and electron takeoff angles.
| Energy | SD (1253.6 eV, 45°) | SD (2494 eV, 80°) | SD (3498 eV, 80°) |
|---|---|---|---|
| Li 1s | 6.1 | 14.6 | 19.1 |
| C 1s | 5.2 | 13.6 | 18.1 |
| O 1s | 4.1 | 12.3 | 17.0 |
| F 1s | 3.4 | 11.5 | 16.2 |
| P 2p | 5.8 | 14.3 | 18.7 |
| Mn 3p | 6.1 | 14.7 | 19.1 |
| Mn 2p | 3.6 | 11.8 | 16.5 |
| Ni 3p | 6.0 | 14.6 | 19.0 |
| Ni 2p | 2.6 | 10.8 | 15.6 |
Results and Discussion
Cycle life
Galvanostatic voltage profiles (Figure 1) displayed well-defined discharge and charge plateaus around 4.7 V vs Li+/Li, corresponding to the Ni2+/Ni3+ and Ni3+/Ni4+ redox processes, with little polarization. The lack of a second plateau at lower voltage is consistent with little or no oxygen defects/non-stoichiometry in our LNMO, which are expected give rise to the Mn3+/Mn4+ redox transition around 4.0 V vs Li+/Li. We observe first discharge/charge capacities around 110 mAh/g, with no capacity fade for up to 10 cycles, which is in good agreement with literature data where LNMO cells have been cycled >100 times at capacities between 110 and 120 mAh/g at comparable C rates.5
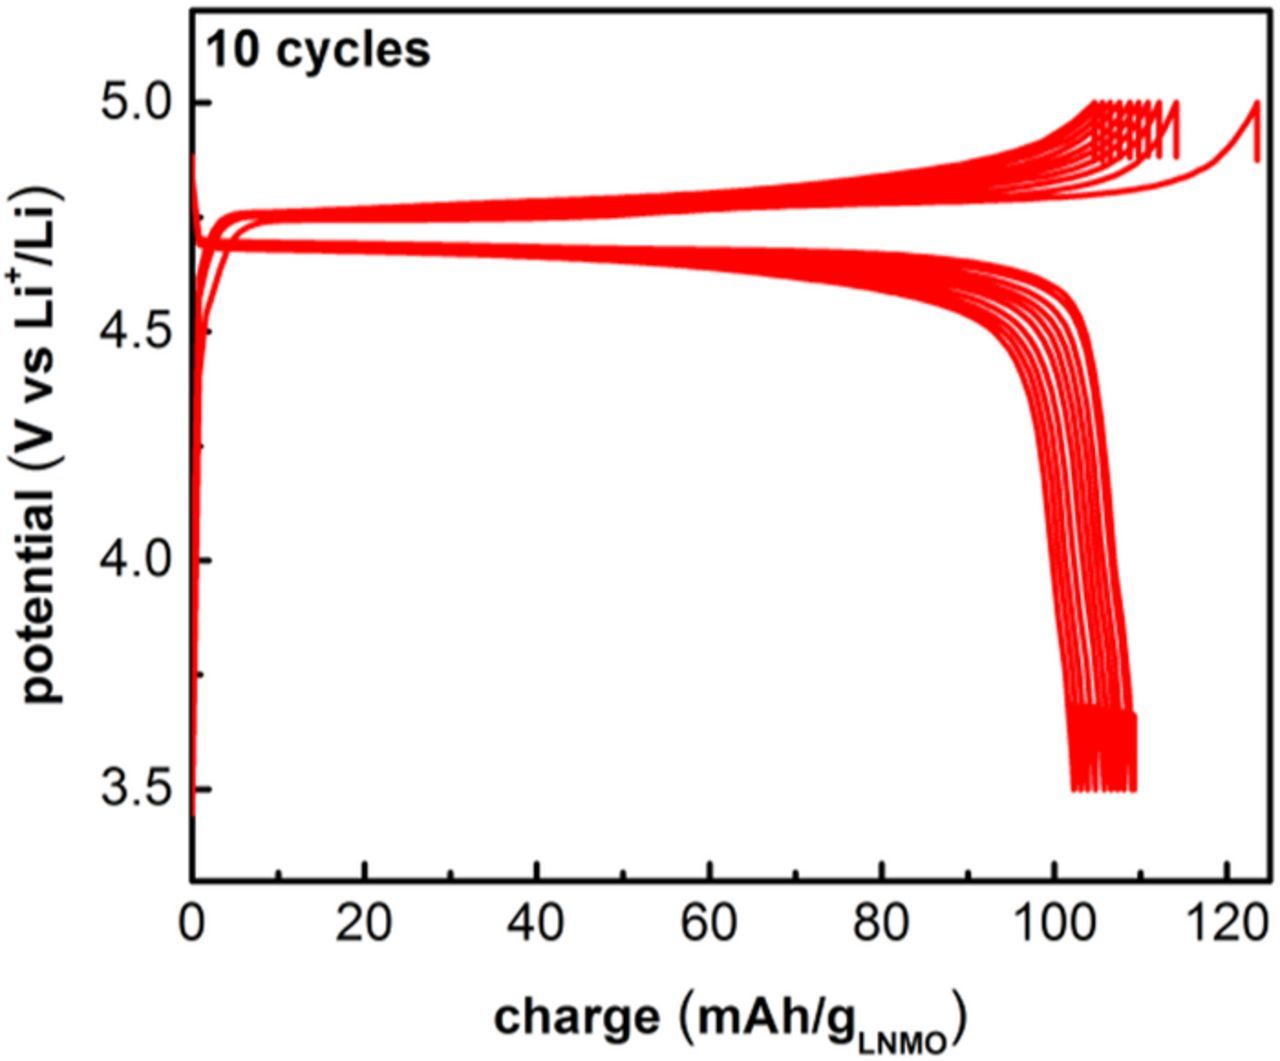
Figure 1. Voltage profiles for LNMO positive electrodes cycled at C/5 between 3.5–5.0 V vs Li+/Li for 10 cycles.
XPS results
The XPS spectra for the C1s, O1s, F 1s, P 2p, Ni 2p, and Mn 2p, photoemission regions as a function of X-ray excitation energy are shown in Figures 2–6, and 7 respectively. The spectrum for the combined Mn 3p, Li 1s and Ni 3p regions is shown in Figure 8. Various possible chemistries for each region are indicated by the vertical dashed lines. Binding enery and atomic percentage data for fitted regions are shown in Table II. Hereafter, the results for each region will be discussed.
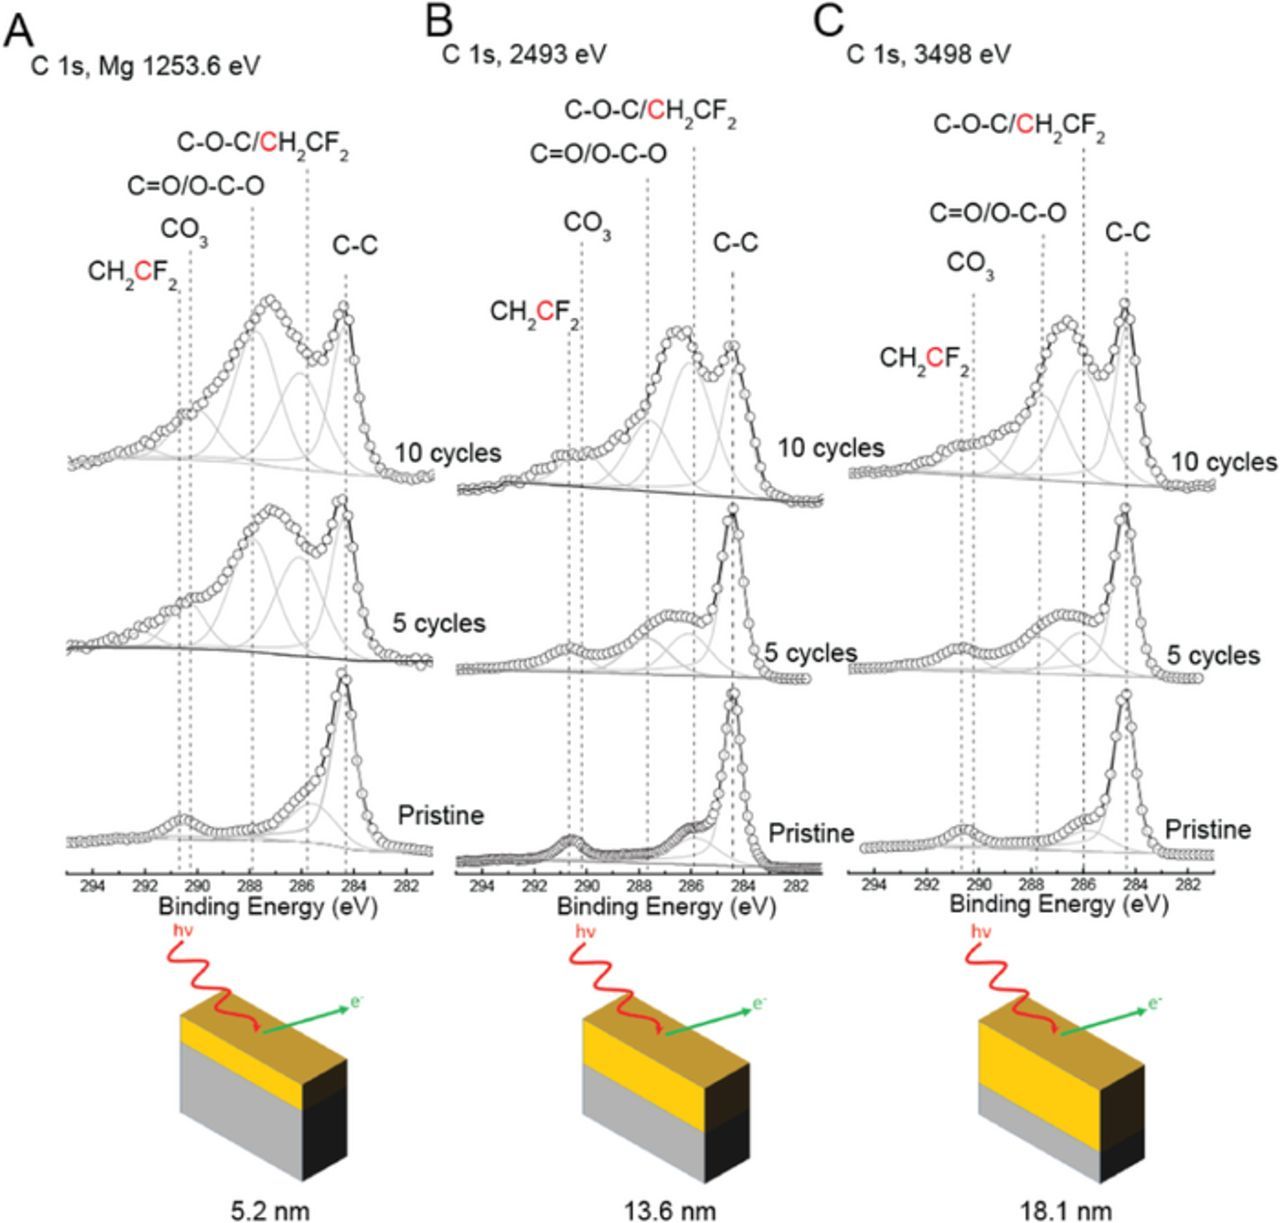
Figure 2. XPS spectra of the C 1s photoemission line for pristine positive electrode, and positive electrodes cycled for 5 and 10 cycles using (a) lab-based Mg X-rays, and synchrotron X-rays with excitation energies of (b) 2493 eV and (c) 3498 eV. Dashed vertical lines represent binding energy values for graphitic carbon (C-C), carbon singly bonded to two oxygen atoms (O-C-O), carbonate (CO3), carbon bound to two fluorine atoms in PVDF (CF2) and other species. The x-axis is the same for all spectra, but spectra have been shifted vertically for ease of comparison. A schematic of the dependence of probe depth with X-ray excitation energy is shown below: 5.2, 13.6 and 18.1 nm for X-ray excitation energies of 1253.6, 2493 and 3498 eV respectively (see Table I for probe depths for all regions).
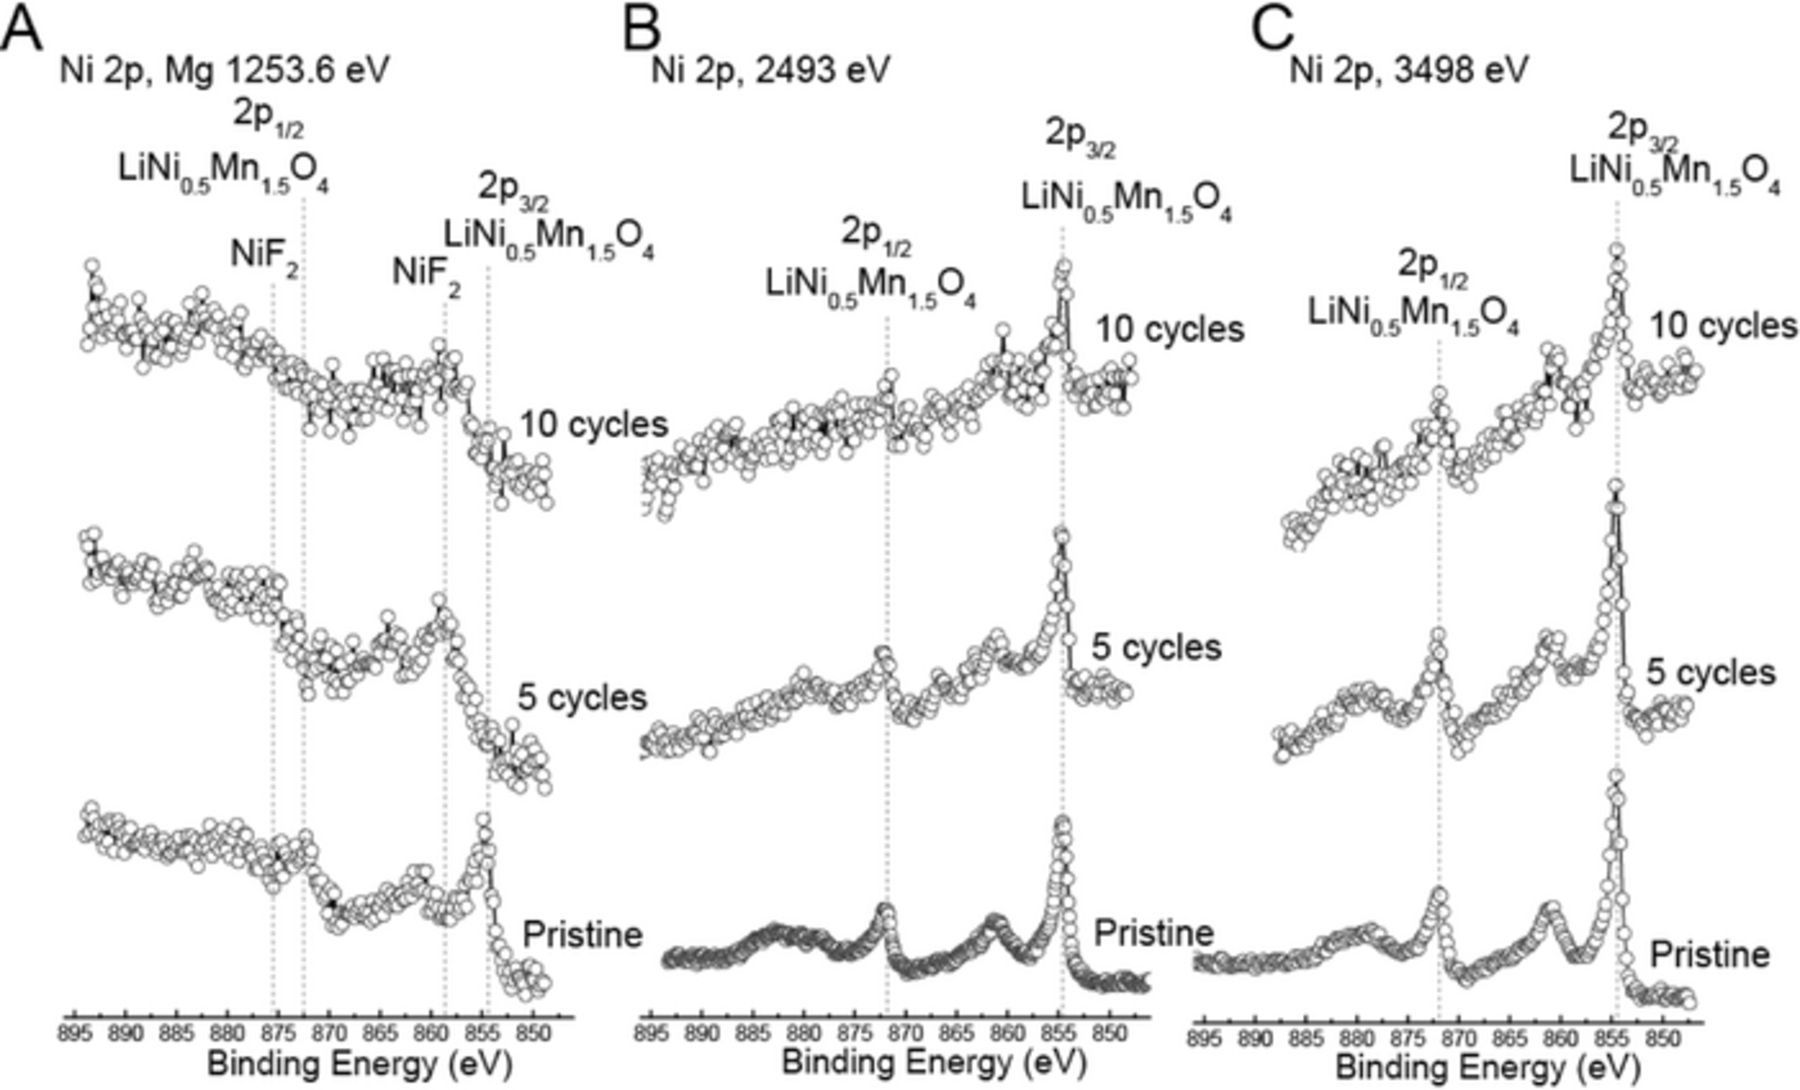
Figure 6. XPS spectra of the Ni 2p photoemission line for positive electrode, and positive electrodes cycled for 5 and 10 cycles using (a) lab-based Mg x-rays, and synchrotron x-rays with excitation energies of (b) 2493 eV and (c) 3498 eV. Dashed vertical lines represent binding energy values for LNMO and NiF2. The x-axis is the same for all spectra, but spectra have been shifted vertically for ease of comparison.
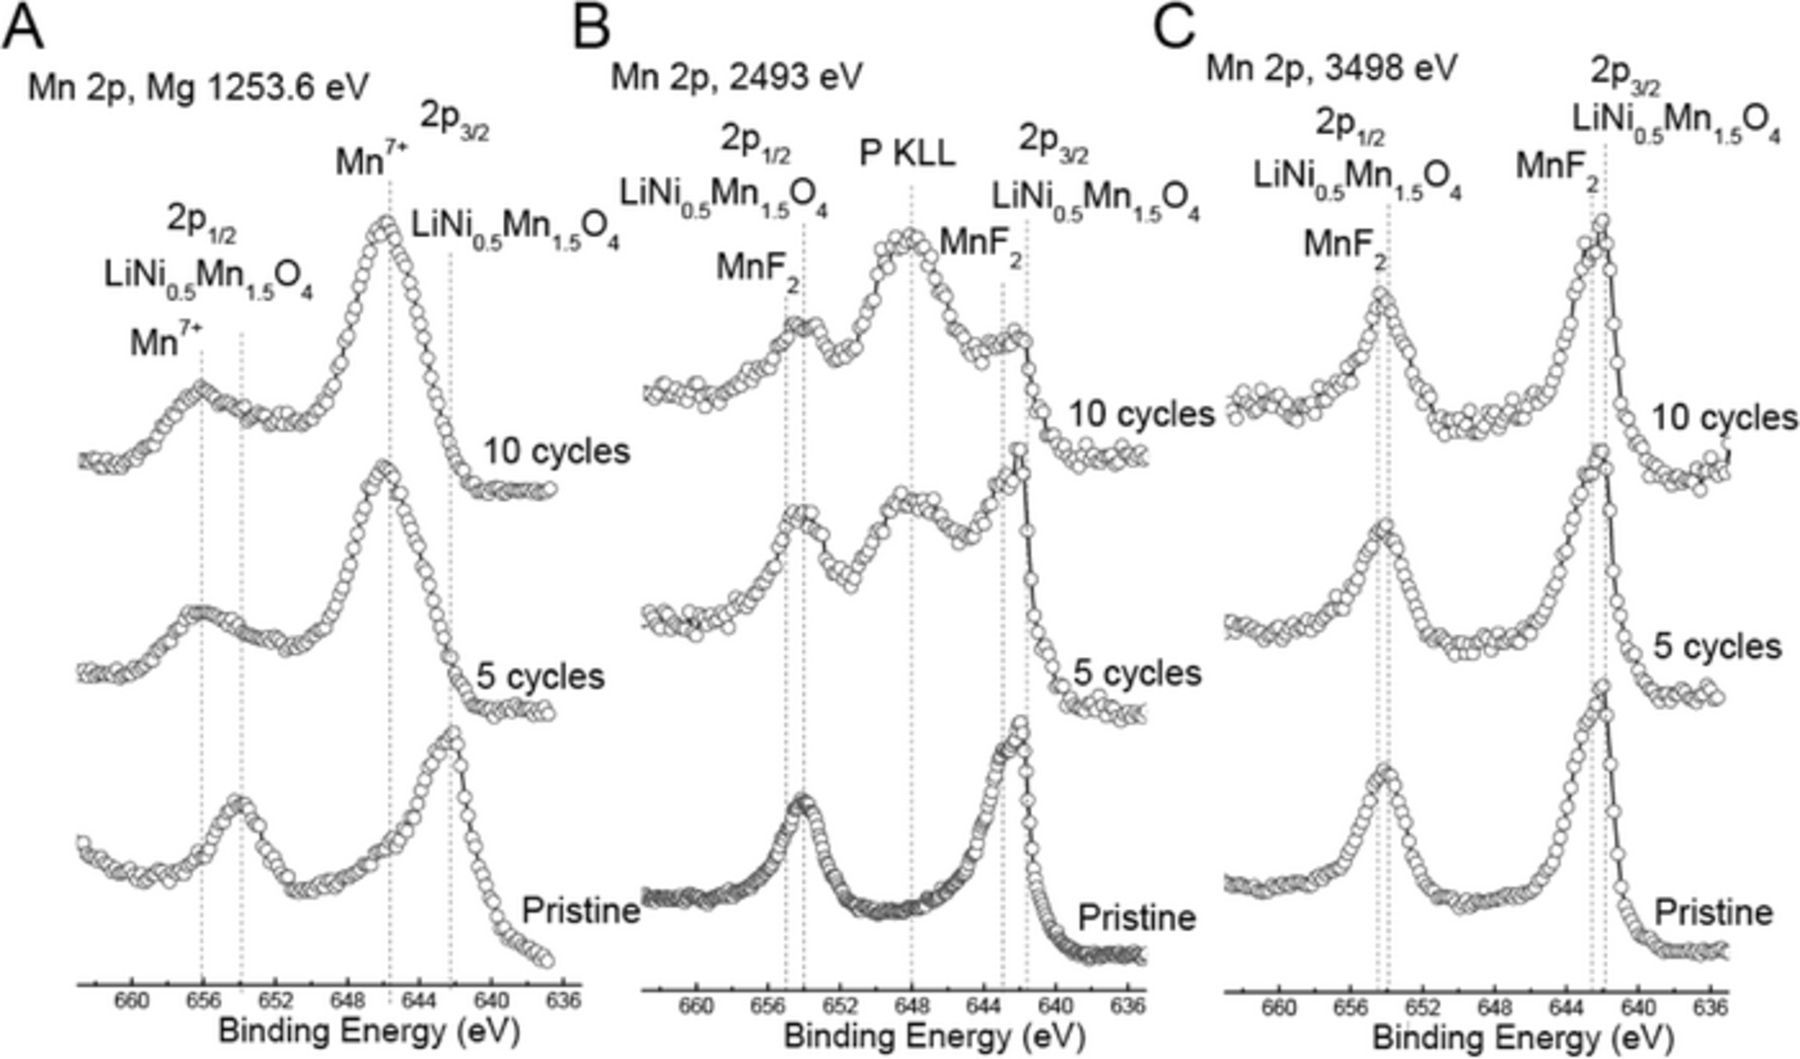
Figure 7. XPS spectra of the Mn 2p photoemission line for pristine positive electrode, and positive electrodes cycled for 5 and 10 cycles using (a) lab-based Mg X-rays, and synchrotron X-rays with excitation energies of (b) 2493 eV and (c) 3498 eV. Dashed vertical lines represent binding energy values for lattice manganese (Mn 2p3/2 and 2p1/2), manganese fluoride (MnF2), Mn7+ and the phosphorus KLL Auger peak. The x-axis is the same for all spectra, but spectra have been shifted vertically for ease of comparison.
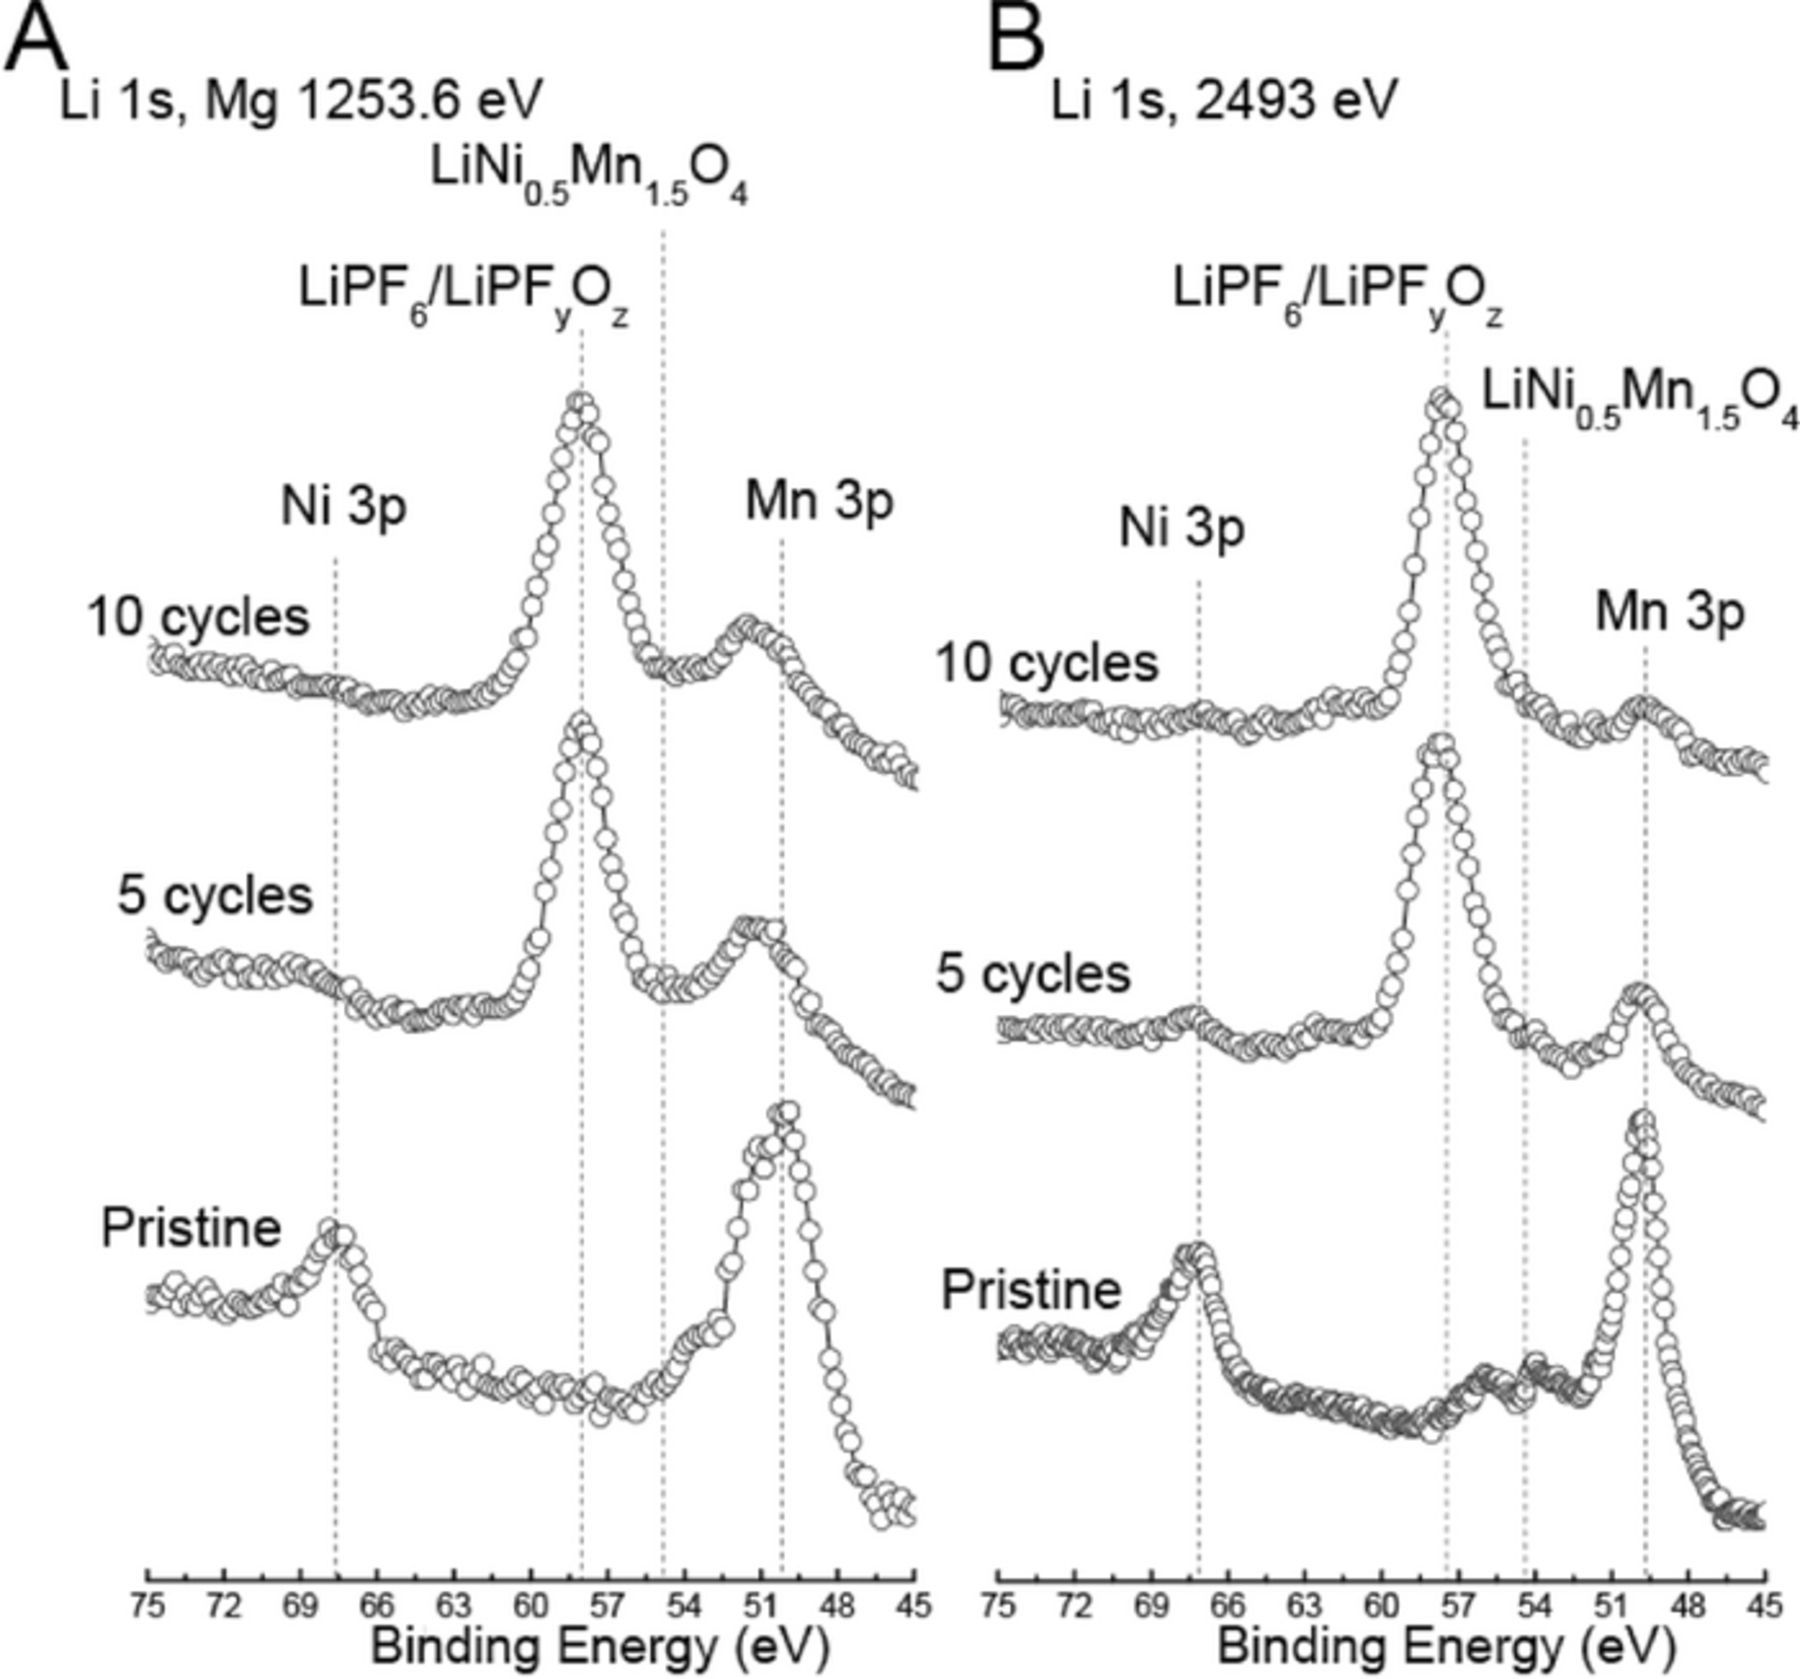
Figure 8. XPS spectra of the Mn 2p photoemission line for pristine positive electrode, and positive electrodes cycled for 5 and 10 cycles using (a) lab-based Mg X-rays, and synchrotron X-rays with excitation energies of (b) 2493 eV and (c) 3498 eV. Dashed vertical lines represent binding energy values for lattice manganese (Mn 2p3/2 and 2p1/2), manganese fluoride (MnF2), Mn7+ and the phosphorus KLL Auger peak. The x-axis is the same for all spectra, but spectra have been shifted vertically for ease of comparison.
Table II. Summary of XPS results for pristine and cycled positive electrodes including binding energy (BE) in eV and atomic % for C 1s, O 1s, F 1s and P 2p regions.
| Pristine | Cycled | ||||||||||||
|---|---|---|---|---|---|---|---|---|---|---|---|---|---|
| 1254 eV | 2493 eV | 3498 eV | 1254 eV | 2493 eV | 3498 eV | ||||||||
| Peak | Assignment | BE | Atom % | BE | Atom % | BE | Atom % | BE | Atom % | BE | Atom % | BE | Atom % |
| C 1s | C-C | 284.4 | 39.3 | 284.4 | 40.1 | 284.4 | 47.3 | 284.4 | 11.1 | 284.3 | 11.8 | 284.4 | 12.4 |
| C-O-C/CH2CF2 | 285.6 | 44.5 | 285.9 | 38.8 | 285.8 | 35.5 | 286.1 | 30.9 | 286.1 | 50.3 | 286.1 | 43.7 | |
| C=O/O-C-O | 288.1 | 3.43 | 288.2 | 4.14 | 288.2 | 3.35 | 287.8 | 40.7 | 287.6 | 26.0 | 287.6 | 31.3 | |
| CO3 | 290.1 | 15.43 | 290.2 | 11.9 | 290.3 | 12.6 | |||||||
| CH2CF2 | 290.5 | 12.8 | 290.6 | 17.0 | 290.6 | 16.8 | |||||||
| O 1s | Lattice oxygen in LiNi0.5Mn1.5O4 | 529.6 | 49.5 | 529.7 | 52.6 | 529.6 | 68.29 | 529.6 | 8.24 | 529.7 | 7.40 | ||
| Surface oxygen in LiNi0.5Mn1.5O4 | 531.5 | 35.6 | 531.6 | 30.5 | 531.5 | 23.7 | |||||||
| CO3/C=O | 532.1 | 9.15 | 532.1 | 9.42 | 532.1 | 10.4 | |||||||
| C-O | 533.2 | 14.9 | 533.4 | 16.9 | 533.4 | 8.01 | 533.7 | 56.3 | 533.6 | 29.5 | 535.5 | 29.6 | |
| LixPFyOz | 535.3 | 34.6 | 535.2 | 52.8 | 535.2 | 52.6 | |||||||
| F 1s | LiF | 685.1 | 3.76 | 684.9 | 3.87 | 684.9 | 4.21 | 685.1 | 1.91 | 685.1 | 2.31 | ||
| LixPFyOz | 686.5 | 33.1 | 686.7 | 83.8 | 686.8 | 75.8 | |||||||
| CH2CF2 | 687.6 | 81.4 | 687.8 | 96.1 | 687.8 | 95.8 | 687.7 | 52.4 | 687.7 | 6.17 | 687.7 | 11.8 | |
| CF2CF2 | 689.0 | 14.9 | 689.3 | 14.5 | 689.5 | 8.12 | 689.7 | 10.1 | |||||
| P 2p | LiPF6 | 136.0 | 68.2 | 136.0 | 30.21 | 135.9 | 42.6 | ||||||
| LixPFyOz | 137.7 | 31.8 | 138.2 | 69.8 | 138.3 | 57.5 | |||||||
C 1s region
Based on the C 1s region (Figure 2), it is evident that the surface region of the pristine positive electrode consists of the carbon black component at 284.4 eV and the PVDF components at 286 and 290.6 eV. The relative intensities of the carbon black and the PVDF remained relatively unchanged regardless of the excitation energy indicating that the carbon black and PVDF are uniformly distributed at least within the largest sampling depth of carbon photoelectrons with synchrotron X-rays at 3498 eV, which is 18 nm.
After 5 cycles, the C 1s region displayed additional contributions from surface films formed during cycling due to various positive electrode-electrolyte interactions. The additional contributions were assigned to species containing carbon singly bound to one oxygen atom (C-O-C), carbon singly bound to two oxygen atoms (O-C-O) and/or carbon doubly bound to one oxygen (C=O),23 as well as a possible contribution from carbonate (CO3). These contributions are significantly more intense when the data were collected with excitation energy of 1254 eV relative to 2493 eV and 3498 eV. However, given that the C 1s peak from carbon black is visible, it is clear that the surface film thickness is less than the sampling depth of 5.2 nm after 5 cycles.
After 10 cycles, the intensity of the surface film species relative to the intensity of carbon black increased slightly when compared to that after 5 cycles in the case of Mg X-rays. However, the intensity of surface film species relative to the intensity of carbon black increased significantly when compared to that after 5 cycles in the case of synchrotron X-rays at 2494 and 3498 eV, indicating that the surface film thickened due to the increase in cycle number from 5 to 10. The film thickness is still less than the sampling depth of C 1s with Mg X-rays (i.e., 5.2 nm) since the carbon black signal is still apparent in the Mg data even after 10 cycles. It is clear that surface films are formed during cycling, however, due to the porous nature of the composite positive electrode, some degree of a heterogeneous layered distribution of surface films and carbon black may be present.
O 1s region
As shown in Figure 3, the oxygen region for the pristine positive electrode consists of three components for all excitation energies. These components, going from low to high binding energy, correspond to lattice oxygen in LNMO, surface oxygen in the form of Li2CO3 and/or C=O, as well as oxygen which is singly bound to carbon. The structure in the oxygen 1s region is typical for all lithium transition metal oxides used in Li-ion batteries. The relative concentration of the lattice oxygen component relative to that from all other components increased with increased excitation energy. This is a clear indication that the high binding energy components are present as contaminants on the surfaces of the LNMO particles.
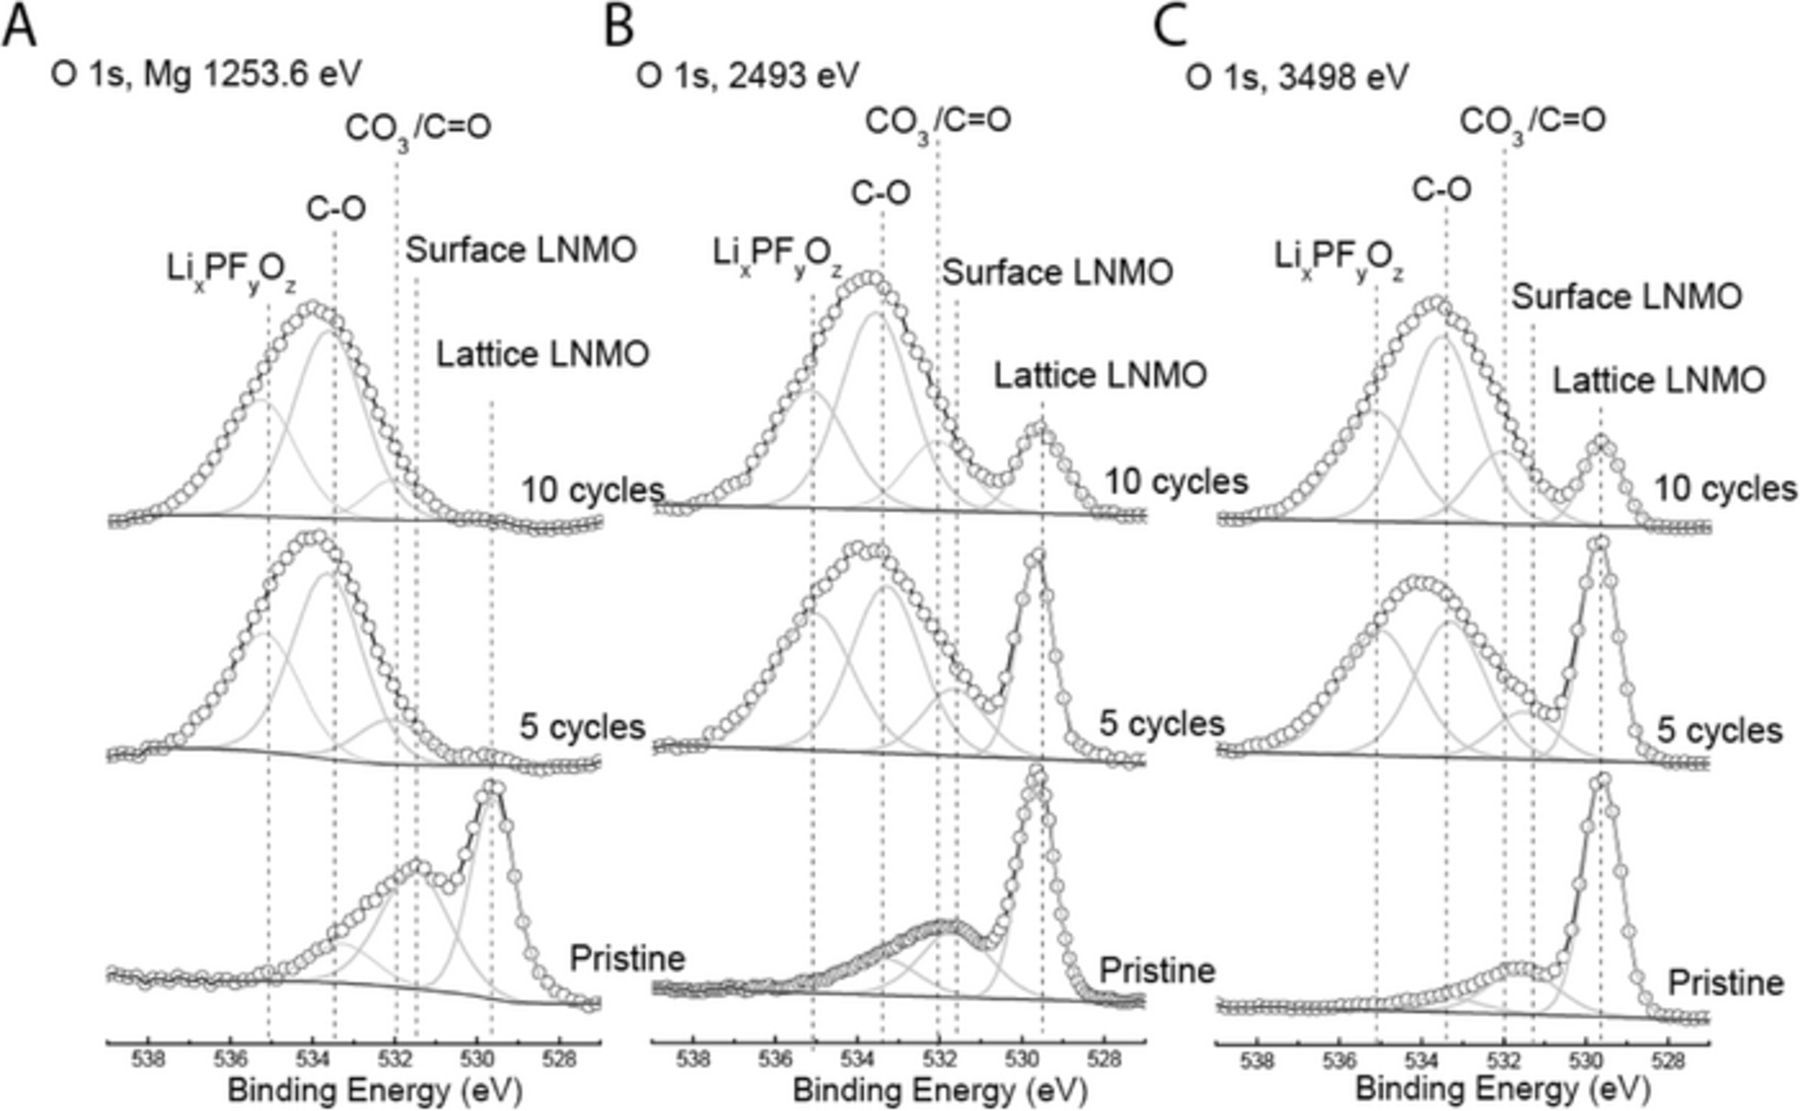
Figure 3. XPS spectra of the O 1s photoemission line for pristine positive electrode, and positive electrodes cycled for 5 and 10 cycles using (a) lab-based Mg X-rays, and synchrotron X-rays with excitation energies of (b) 2493 eV and (c) 3498 eV. Dashed vertical lines represent binding energy values for surface and lattice oxygen (LiNi0.5Mn1.5O4 lattice oxygen), oxygen present in lithium carbonate (Li2CO3), oxygen doubly bonded to carbon in a carboxylic acid arrangement (O-C=O), and oxygen in a fluorine based compound from LiPF6 degradation (LixPFyOz). The x-axis is the same for all spectra, but spectra have been shifted vertically for ease of comparison.
After 5 cycles, when the data were collected with Mg X-rays, the contribution from the LNMO particles (lattice oxygen and its surface species) disappeared while three other components appeared due to the formation of surface films due to various positive electrode-electrolyte interactions, as also was depicted based on the C 1s region. These components correspond to the formation of new Li2CO3/C=O, O-C=O/C-O-C24 and LixPFyOz which is a degradation product of the salt. Based on these results, it is clear that the surface film thickness is greater than the sampling depth with Mg X-rays, which is 4.1 nm. The lattice oxygen component, however, was prominent in the spectra, which were collected with excitation energies of 2495 and 3499 eV. Hence, the surface film thickness must be less than the sampling depth with excitation energy of 2495 eV, which is 12.3 nm. Therefore, the surface film thickness is greater than 4.1 nm but is less than 12.3 nm. Furthermore, based on the relative change in the intensity of the C-O component relative to the other components as a function of excitation energy, the C-O component is present closer to the top surface than the other components LixPFyOz, and Li2CO3/C=O and lattice LNMO.
After 10 cycles, similar trends were observed as in the case after 5 cycles. However, the intensity of the lattice oxygen contribution after 10 cycles was further reduced relative to that after 5 cycles indicating that the surface film thickness is increased with cycling, but it is still slightly less than the sampling depth of 12.3 nm with an excitation energy of 2493 eV.
F 1s and P 2p regions
As shown in Figure 4, the F 1s region for the pristine positive electrode at all excitation energies displayed a major component, which corresponds to PVDF as one would expect. A minor component with binding energy of ∼ 685 eV, which corresponds to LiF, was also observed. The formation of LiF was reported by Edström et al.,25 on fresh laminates (with no previous contact with the electrolyte), which was attributed to dehydrofluorination reaction in the binder PVDF, generating HF, which then reacts with Li from the active material or surface Li2CO3 to form LiF. Another small component with binding energy at ∼ 689 eV, which we attributed to the formation of CF2-CF2 was observed only in the data collected with Mg X-rays. This component could be the result of X-ray induced damage by non-characteristic X-rays from the non-monochromatic Mg source.
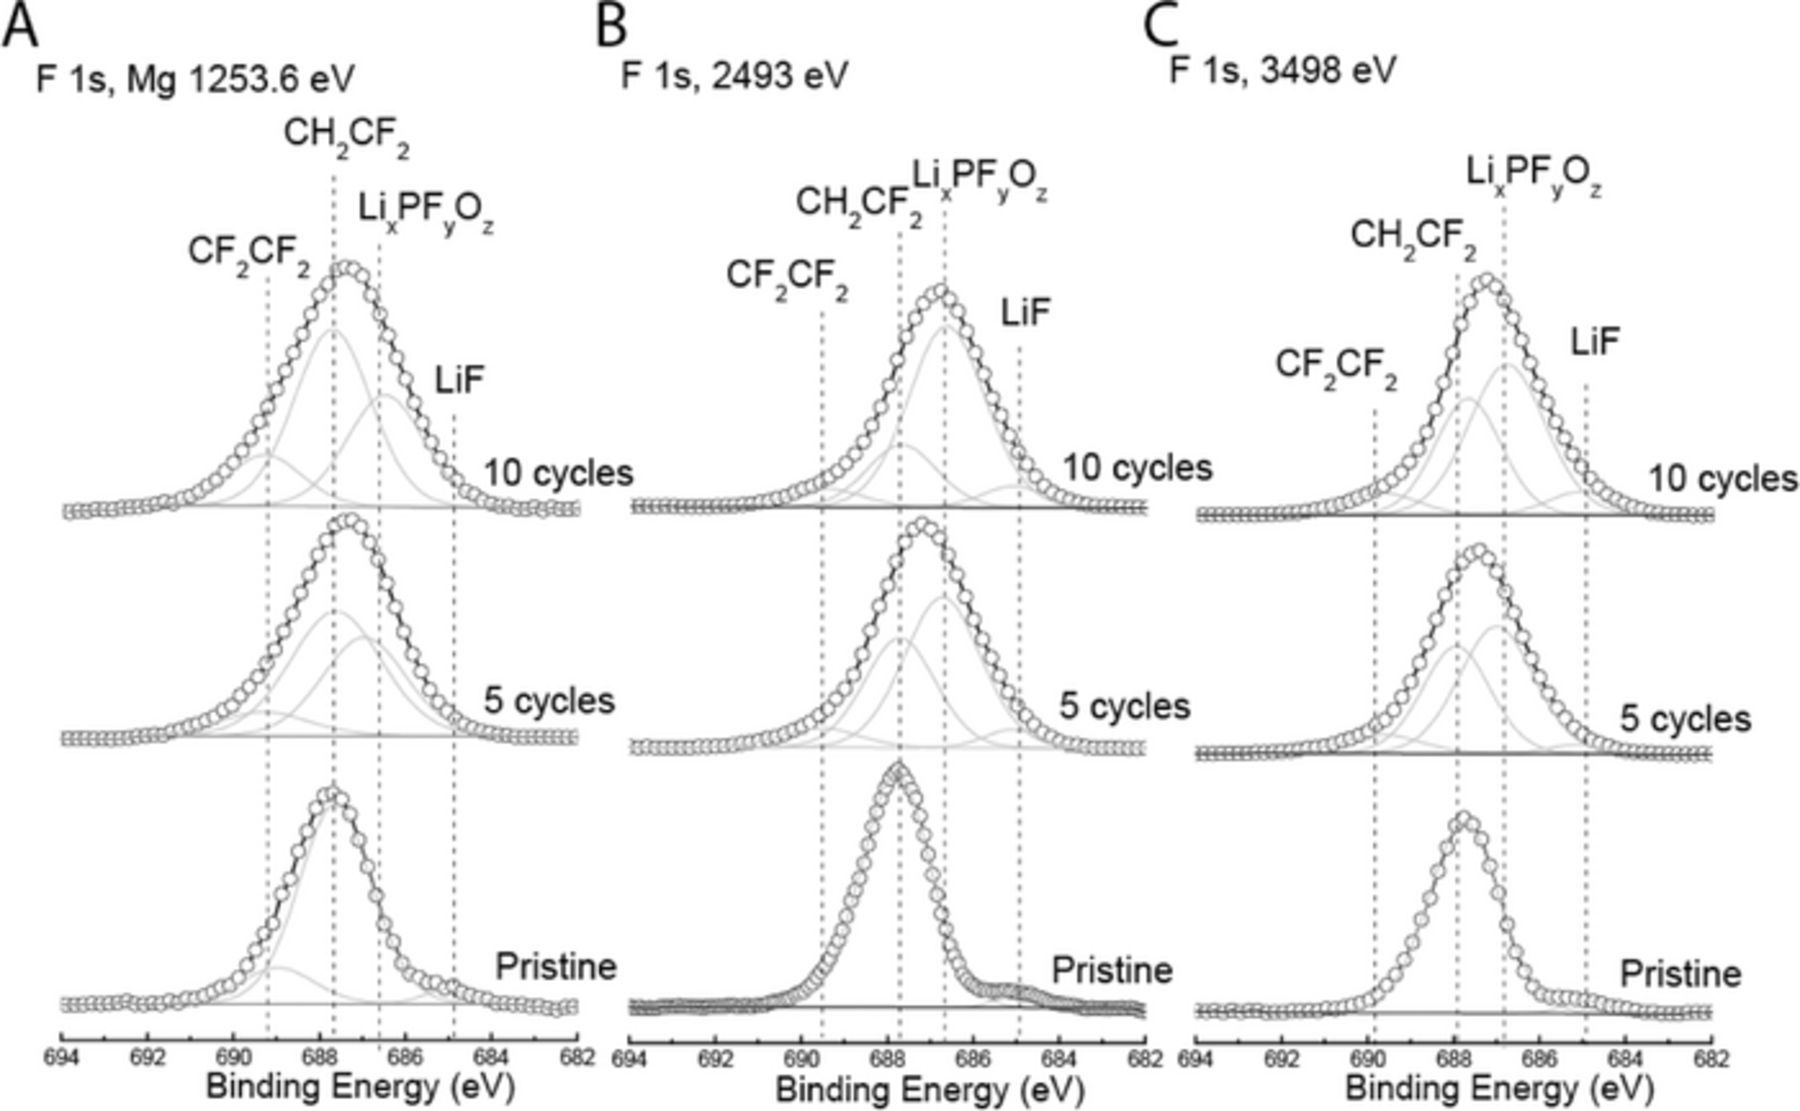
Figure 4. XPS spectra of the F 1s photoemission line for pristine positive electrode, and positive electrodes cycled for 5 and 10 cycles using (a) lab-based Mg X-rays, and synchrotron X-rays with excitation energies of (b) 2493 eV and (c) 3498 eV. Dashed vertical lines represent binding energy values for lithium fluoride (LiF), LiPF6 degradation products (LixPFyOz), and PVDF (CF2). The x-axis is the same for all spectra, but spectra have been shifted vertically for ease of comparison.
After 5 and 10 cycles, a new contribution with binding energy at ∼ 686.5 eV emerged, which can be assigned to the degradation product of the LiPF6 salt in the form of LixPFyOz.26–28 This is consistent with observations made on the basis of the O 1s region in Figure 3 and the P 2p region in Figure 5, where the cycled positive electrodes contain O and P contributions, respectively, from LixPFyOz. In addition, Figure 5 displays a P contribution, which corresponds to LiPF6. The intensity of LixPFyOz relative to that of LiPF6 with Mg X-rays significantly decreased when the excitation energy increased to 2493 and 3498 eV, indicating that the LixPFyOz component resides closer to the surface than the LiPF6 component.
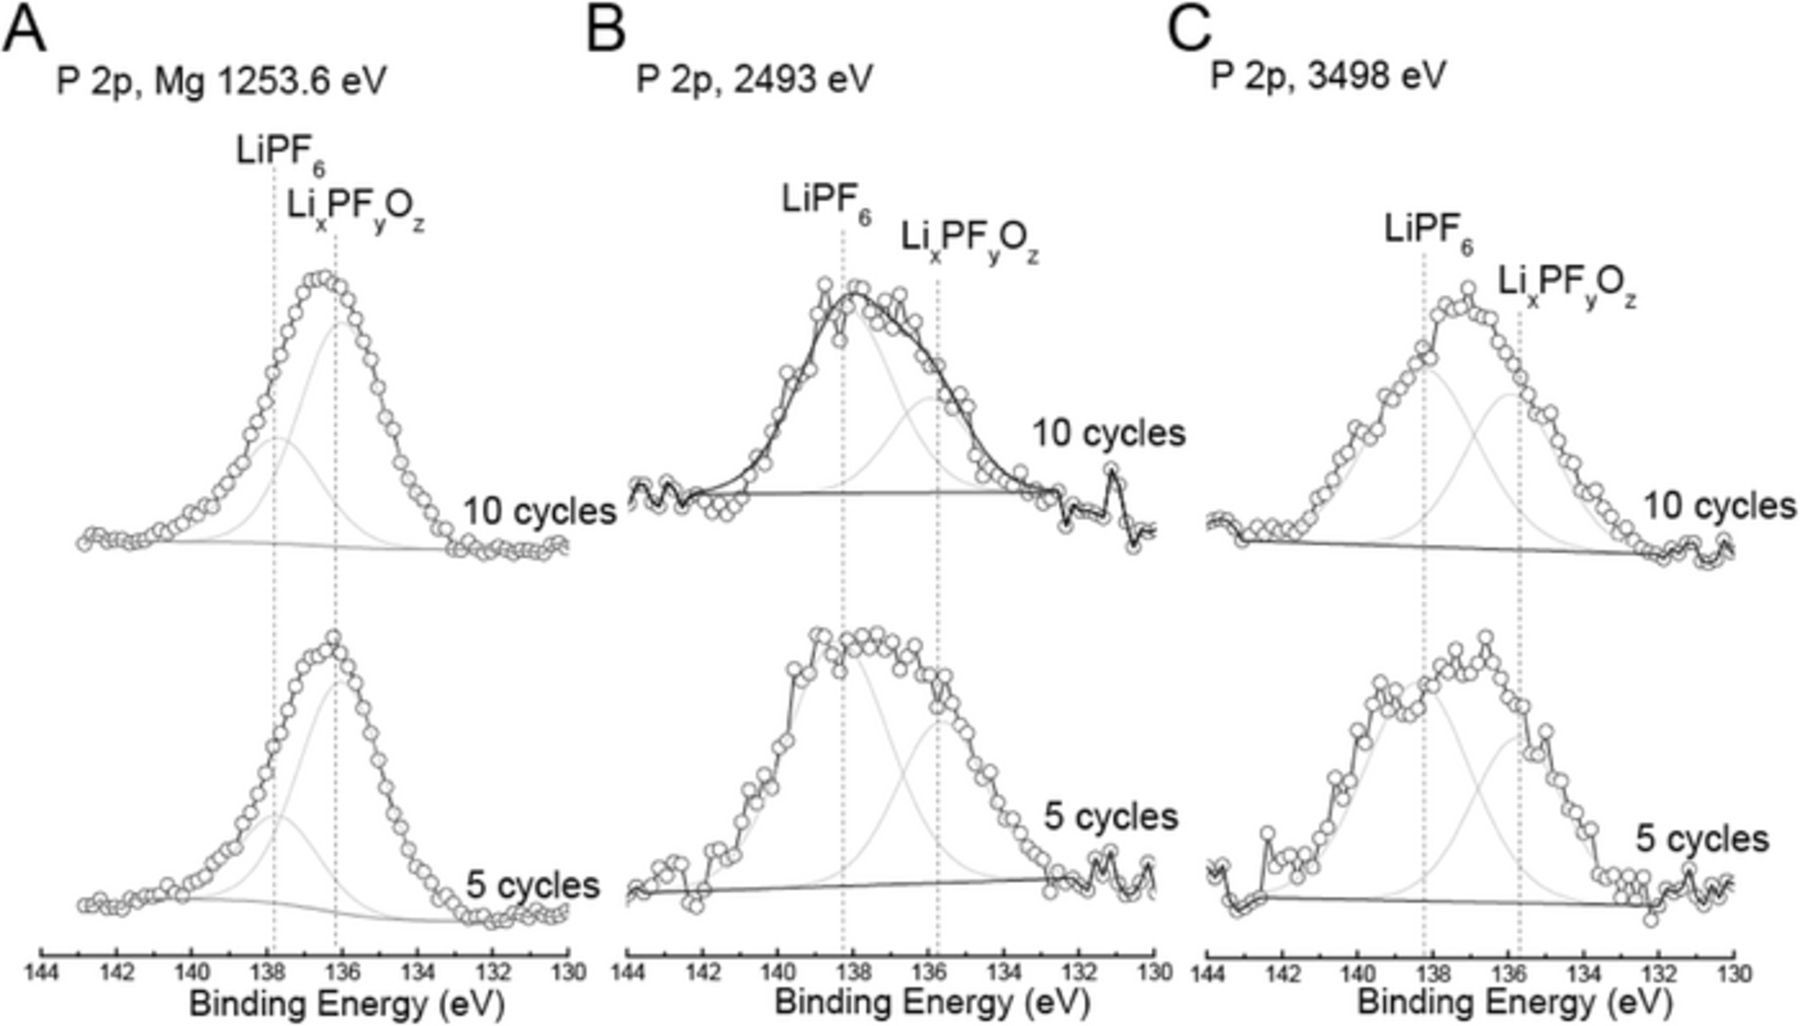
Figure 5. XPS spectra of the P 2p photoemission line for pristine positive electrode, and positive electrodes cycled for 5 and 10 cycles using (a) lab-based Mg X-rays, and synchrotron X-rays with excitation energies of (b) 2493 eV and (c) 3498 eV. Dashed vertical lines represent binding energy values for LiPF6 and LiPF6 degradation product LixPFyOz. The x-axis is the same for all spectra, but spectra have been shifted vertically for ease of comparison.
Ni 2p region
As shown in Figure 6, the Ni 2p spectra of the pristine LNMO positive electrode are similar to that of Ni in LiNi0.5Mn0.5O2, in both cases with binding energy near 854.8 eV and Ni is present as Ni2+.29,30 After 5 and 10 cycles, based on the data collected with Mg X-rays, the Ni peak shifted to about 857.9 eV, which is similar to that of our NiF2 reference binding energy. The sampling depth in this case is 3.6 nm (Table I). Since, we already established that the thickness of the organic overlayer from electrolyte decomposition is greater than 4.1 nm based on the O 1s region, it is clear that the NiF2 overlayer is thinner in comparison. This is consistent with Ni 2p spectra probed with synchrotron radiation, which are dominated by the contribution from Ni2+ in LNMO (Figures 6b–6c). With synchrotron Ni 2p XPS, the sampling depths are 10.8 and 15.6 nm at excitation energies of 2493 and 3498 eV, respectively. Therefore, migration of Ni from the pristine positive electrode into the surface film overlayer occurred during cycling, and NiF2 is present in a very thin layer close to the positive electrode surface as a result of interaction with the electrolyte. It is also possible that Ni dissolution of Ni into the electrolyte16 and its redeposition back on the positive electrode surface may have occurred.
Mn 2p region
As shown in Figure 7, the Mn 2p3/2 binding energy for the pristine positive electrode is near ∼642 eV indicating that Mn is present as Mn4+ as we have shown, previously, in the case for LiNi0.5Mn0.5O2.25,29,31 After 5 and 10 cycles, the Mn 2p3/2 binding energy shifted to about 645.8 eV with Mg X-rays. Such high binding energy was not observed for any of our references such as MnO, Mn2O3, MnO2, MnF2, or MnF3. The observed binding energy for the cycled positive electrodes, however, is close to that reported for KMnO4 at 645.6 eV,32 indicating that Mn is present as Mn7+ possibly in the form of LiMnO4. With synchrotron X-rays, the Mn 2p3/2 region for the cycled positive electrodes is dominated with a contribution from LNMO. Given that the sampling depths of Mn 2p3/2 photoelectrons for the various excitation energies (1253, 2493 and 3498 eV) are 3.6, 11.8 and 16.5 nm, respectively, it is clear that the Mn7+ component is present only in the surface film overlayer, similar to NiF2 in the Ni 2p spectra. Below the surface film overlayer, Mn retained its original chemical state and structure. We note that the Mn 2p spectra collected from cycled positive electrodes with excitation energy of 2493 eV have a contribution from the X-ray induced P KLL Auger line, due to the presence of LiPF6 and LixPFyOz species, as previously noted.
Ni 3p, Mn 3p and Li 1s regions
The Ni 3p, Mn 3p and Li 1s spectra were collected with Mg X-rays and synchrotron X-rays at 2493 but not 3498 eV. As shown in Table I, since the sampling depths for the Ni 3p and Mn 3p photoelectrons (6.0 and 6.1 nm) are significantly greater than those of Ni 2p and Mn 2p photoelectrons (2.6 and 3.6 nm), respectively, they were used to see if they would provide further insight into the depth distribution of various chemistries. As shown in Figure 8, the intensity of the Ni 3p line with My X-rays for the cycled positive electrodes diminished completely after 5 and 10 cycles relative to that of the pristine positive electrode. However, the Ni 3pm with excitation energy of 2493 eV diminished completely after 10 but not 5 cycles, which can be related to increased film thickness with cycling. The reduced Ni 3p intensity is qualitatively consistent with that observed for the Ni 2p region in Figure 6. The Ni 3p data confirmed that the NiF2 component observed in the cycled positive electrodes is present in the surface film overlayer, in agreement with the conclusion based on the Ni 2p data.
The intensity of the Mn 3p peak for the cycled positive electrodes also was reduced relative to that of the pristine positive electrode and is qualitatively consistent with that observed based on the Mn 2p data. A slight shift in the binding energy of the Mn 3p peak was observed for the cycled positive electrodes relative to that of the pristine positive electrodes with Mg X-rays while no shift was detected with synchrotron X-rays at 2493 eV due to the greater sampling depth in this case. The greater sampling depth enhances the Mn contribution from beneath the surface film region relative to the Mn contribution from within the surface film region. Again, the Mn 3p data confirmed that the formation of a compound with Mn7+ is limited to the surface film overlayer.
In the Li 1s region (Figure 8), the Li 1s contribution from the active LNMO of the pristine electrode is present as a weak component at ∼55 eV, which is buried under the left hand side tail of the Mn 3p line at ∼50 eV. The weak Li signal relative to the Mn signal in the Mg and synchrotron XPS data is due in part to the difference in the photoionization cross sections for Li 1s and Mn 3p (0.028 for Li vs. 0.26 for Mn with Mg X-rays) and the overlap between the two components which makes it difficult to clearly differentiate the Li contribution from the Mn contribution, especially in the case of the Mg data. The better differentiation of the Li signal from the Mn signal with synchrotron X-rays is due to the higher energy resolution of the data collected with synchrotron X-rays relative to the data collected with Mg X-rays.
Upon cycling the Li 1s binding energy for the cycled positive electrodes shifted from ∼55 eV, which is the case for the pristine positive electrode, to ∼58 eV, which is close to binding energies previously reported for Li in LiPF6 such as 58.2 eV by Leroy et al.20 and 57.2 eV by Dedryvère et al.33 indicating that the source of Li is mostly LiPF6, although LixPFyOz cannot be discounted as contributing to the peak intensity. The ratio of the intensity of the Li 1s line to that of the Mn 3p line after 5 and 10 cycles remained relatively similar in the spectra collected with Mg X-rays and synchrotron X-rays at 2493 eV. The difference in Li/Mn intensity ratios with excitation energy indicates a depth distribution of species, with LiPF6/LixPFyOz, on average, being closer to the surface.
Conclusions
Taken together, the above XPS spectra suggest that LNMO cycling is accompanied by a significant amount of electrolyte decomposition. O 1s spectra indicate that a 5–10 nm-thick layer of O-C=O and LixPFyOz species forms after 5 and 10 cycles while Ni and Mn 2p suggest a thinner (<4 nm) TM fluoride layer (Figure 9). The observation of C-O and C=O-containing species is consistent with previous lab-based XPS studies by Dedryvère and Yang and co-workers, consistent with carbonate-based electrolyte being susceptible to oxidative decomposition13 and polymerization10 during cycling of LNMO-based positive electrodes. Solvent decomposition is supported by a recent differential electrochemical mass spectrometry study showing CO2 evolution during high-voltage (≥ 4.6 V vs Li+/Li) cycling of LNMO in ethylene and methyl carbonate-based electrolytes.14 The use of different excitation energies in this study however provides a unique contribution to studies of LNMO degradation, as it enables estimation of the approximate thicknesses of various decomposition layers in comparison to other species, and EEIs in other Li-ion systems. In this regard, it is particularly interesting to note that the interface formed on LNMO is considerably thicker than that formed in LiFePO4, where a positive electrode cycled 3.5 times between 2.7 and 4.2 V vs Li+/Li at C/10 had a <2 nm-thick EEI layer, as estimated from XPS measurements at different excitation energies.17 EEIs in LiNi0.5Mn0.5O234 (50 cycles at C/20 between 2.5 and 4.5 V) and Li1-xNi0.2Co0.7Mn0.1O235 positive electrodes left in contact with electrolyte have likewise been estimated to be thin, with the latter estimated to be <3 nm from X-ray absorption near edge spectroscopy measurements. Several factors could potentially contribute to a larger EEI thickness in this case, such as smaller particle size, faster cycle rate and higher oxygen non-stoichiometry. A systematic study of the influence of these factors on electrode surface chemistry and battery cyclability would be important for future work, preferably with model thin film positive electrodes, without carbon and binder.3
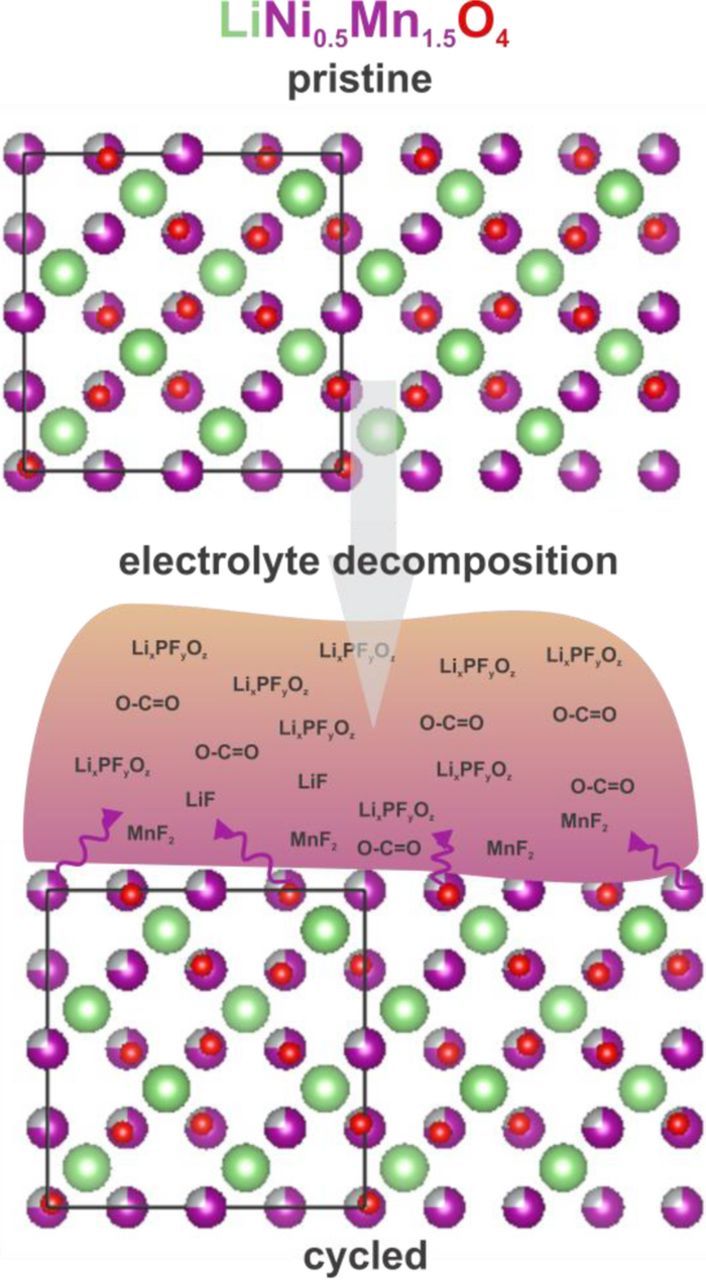
Figure 9. Schematic illustrating composition of EEI in a cycled LNMO positive electrode.
Much remains to be understood regarding the role of positive electrode dissolution during LNMO capacity fade. That a relatively thin (< 4 nm), LiF and NiF2-rich decomposition layer was formed during cycling is consistent with an XPS sputtering study reporting a ∼5 nm-thick Li-rich layer on LNMO after cycling.16 A number of studies have also established that dissolved TM can not only redeposit on the positive electrode, but also migrate to the negative electrode to plate onto and deactivate it after >100 cycles.13,16 Further studies are required to unambiguously ascertain the influence of TM dissolution on battery performance.
In summary, we have shown that XPS measurements of cycled LNMO positive electrodes at different excitation energies yields important insights into the depth distribution of various chemical species formed in the EEI. The results show that EEI is Li-rich, with a thick, 5–10 nm layer composed of LixPFyOz and organic C-O and C = O species formed as a result of decomposition of the LiPF6 electrolyte salt and carbonate electrolyte solvent. A thinner (<4 nm) layer of transition metal fluorides was formed close to the positive electrode surface, suggesting that electrolyte decomposition plays a major role in previously observed capacity fade during LNMO cycling. Combining lab-based and synchrotron XPS measurements is a powerful tool for fundamentally understanding both the surface chemistry and depth distribution of parasitic products in the EEI, and future studies will benefit from applying it in systematic studies of Li-ion battery degradation.
Acknowledgments
This work was supported in part by the MRSEC Program of the National Science Foundation under award number DMR-0819762 and the Assistant Secretary for the Energy Efficiency and Renewable Energy, Office of FreedomCAR and Vehicle Technologies of the U. S. Department of Energy under contract number DE-AC03-76SF00098 with the Lawrence Berkeley National Laboratory. The synchrotron XPS experiment was conducted on beamline X24A at the National Synchrotron Light Source of Brookhaven National Laboratory, which is supported by the U. S. Department of Energy, Office of Basic Energy Sciences, under contract number DE-AC02-98CH10886. We also thank Dr. Conan Weiland and Daniel Fischer of NIST for their assistance and guidance at the beamline, and Tadashi Kawaguchi for help with LNMO synthesis.