Abstract
Differential electrochemical mass spectrometry as well as online mass spectrometry in combination with singe cell testing has been used to study carbon corrosion of typical carbon materials discussed as support for electro-catalyst in fuel cells, e.g. carbon blacks or carbon nanotubes. Beside standard tests used to study the stability under automotive LT-PEMFC conditions, additional tests were performed to try to test the stability under the operating conditions of high temperature polymer electrolyte membrane fuel cells (HT-PEMFC). It was shown that under LT-PEMFC conditions a strong catalytic effect of platinum on the carbon corrosion rate is observable. High temperatures in HT-PEMFC do accelerate the corrosion rate. It was further found that corrosion does not only occur at high potentials but also to a minor amount at lower potentials. This low potential corrosion is in particular observed after a prior potential excursion of the electrode indicating that such excursions do not only lead to the direct corrosion of the support but also to the formation of unstable surface groups, which can be removed subsequently. Throughout all tests, CNT exhibited a higher stability than the tested carbon blacks. In single cell testing, the contribution of other carbon materials in particular the MPL was evaluated. It was found that it is present but small compared to the catalyst support itself.
Export citation and abstract BibTeX RIS

This is an open access article distributed under the terms of the Creative Commons Attribution Non-Commercial No Derivatives 4.0 License (CC BY-NC-ND, http://creativecommons.org/licenses/by-nc-nd/4.0/), which permits non-commercial reuse, distribution, and reproduction in any medium, provided the original work is not changed in any way and is properly cited. For permission for commercial reuse, please email: oa@electrochem.org.
In order to reduce the expenditure of platinum group metals in polymer electrolyte membrane fuel cells the dispersion of the catalyst on a conductive support is the current state-of the art. Only few examples do not follow this approach. Most prominent among the exemptions is the Nano-Structured Thin Film (NSTF) type of catalyst developed by 3M.1 For most applications, carbon has become, however, a sort of standard support material. To accomplish the goal to reduce costs for the fuel cells, inexpensive carbon black materials like Vulcan XC72R from Cabot are used most often. However, as carbon in presence of water is thermodynamically unstable for potentials higher than 0.207 V2 carbon corrosion can become an issue if the oxidation of the carbon is not strongly kinetically hindered e.g. via high degrees of graphitization. Consequently, carbon materials exhibiting such high degrees of graphitization like carbon nanotubes or graphene have attracted attention as alternative supports.
The focus of the research on carbon corrosion is on LT-PEMFC for automotive application. With respect to carbon corrosion the reversed current decay mechanism proposed by Reiser et al.3 is an accepted cause for this type of degradation processes. This is confirmed e.g. in the review of PEMFC degradation processes published by Yu et al.4 The process which is induced by the formation of a hydrogen oxygen front on the anode side upon hydrogen admission after longer standstill can cause potential excursions of the cathode side to potentials between 1.4 and 1.75 V.5 Accordingly, the common tests suites published by US Department of Energy (DoE) and the Fuel Cell Commercialisation Conference of Japan (FCCJ), respectively, comprise both similar accelerated carbon corrosion test protocols based on fast triangular potential cycling to 1.5 V.
Carbon corrosion is, however, not the only degradation mechanism occurring in PEMFC. Another important cause of degradation is the loss of platinum surface area by effects like platinum dissolution and Oswalt ripening. Additional test procedures have been suggested to evaluate this degradation effect separately. Based on the assumption that the effects, which shall be evaluated, are originating from the repeated oxidation and reduction of the platinum catalyst surface due to potential variations between 0.6 V vs. RHE and 1.0 V vs. RHE as consequence of load changes during driving, the suggested tests perform series of potential jumps in this potential window; e.g. the tests described by Ohma et al.6 as load cycling test. It is assumed that carbon corrosion is negligible in this potential region. However, recent investigations by Pizzutilo et al. have revealed that the effect of carbon corrosion and platinum dissolution cannot be separated in such a way.7 They reported that the consecutive execution of both types of tests at the same sample can increase catalyst degradation along both pathways. In particular, carbon corrosion is enhanced if the potential is not kept permanently above 1 V vs. RHE. Linse et al. studied the effect of platinum on the carbon corrosion.8 They found that the presence of platinum caused a catalytic increase in carbon corrosion in particular in the potential region below 1.4 V. They also reported that cycling of the electrode potential to rather low values of 0.6 V vs. RHE or even 0.15 V vs. RHE can strongly increase the catalytic effect. Thereby, the reduction of the lower potential from 0.6 V to 0.15 V had a strong effect albeit both potentials are below the platinum oxide reduction potential. Linse et al. further reported that in absence of platinum only a minor effect of the lower potential on the carbon corrosion rate was visible and only if the potential was reduced down to 0.15 V vs. RHE. Ashton and Arenz reported on detailed studies of the carbon corrosion of high surface area carbon supports with and without graphitization treatments using DEMS.9,10 They found that in particular for the non-graphitized support not the entire observed faradaic current caused the release of either CO2 or O2. They therefore postulated that also a partial oxidation of the carbon surface can occur causing either the release of CO or the formation of oxygenated carbon groups at the carbon surface. In addition to the carbon corrosion test protocols in the potential region above 1 V vs. RHE they performed test reducing the lower potential limit to values below 1 V vs. RHE down to 0.05 V vs. RHE. They observed that extending the lower voltage to such low values enhanced the complete carbon oxidation of the carbon support during the subsequent positive scan in particular if the support was in its pristine or only mild graphitized form. They concluded that for these supports surface groups are oxidized in one positive scan and then subsequently reduced to form less stable surface groups during the negative scan. These reduced surface groups are than easier removed during the next positive scan.
Experimental Set-Up and Procedures
In all cases the tested catalyst were bought from commercial sources, e.g. HiSPEC 2000 10 wt% Pt on carbon black and HiSPEC 4000 40 wt% Pt on carbon black bought from Alfa Aesar (Karlsruhe, Germany) or 18 wt% Pt on multiwall carbon nanotubes (MWCNT) from Future Carbon (Bayreuth, Germany).
Corrosion tests at catalyst level were performed in our flow through DEMS cell which was described in earlier publications e.g.11 In this cell, the tested catalyst is applied to a porous polytetrafluoroethylene (PTFE) membrane, which separates the electrochemical cell from the first stage of the differential pumping gas inlet system of the mass spectrometer. The advantage of this setup as compared to other set-ups described in literature using distinct working electrode and detection compartments is that CO2 formed at the electrode is detectable even if an alkaline electrolyte like KOH is used. This has been proven in a number of studies on the alcohol oxidation in alkaline environment.11–14
In order to be able to quantify the carbon loss the detection of CO2 in the mass spectrometer was calibrated using CO stripping reaction:
![Equation ([1])](https://content.cld.iop.org/journals/1945-7111/165/6/F3307/revision1/d0001.gif)
Here it is exploited, that the Faraday efficiency of this reaction is in very good approximation 100%. Thus, the stripping charge corresponds exactly to a certain amount of produced CO2:
![Equation ([2])](https://content.cld.iop.org/journals/1945-7111/165/6/F3307/revision1/d0002.gif)
with  being the amount of CO2 which is released in mol, QCO be the integrated charge over the CO stripping peak in coulomb and F being the Faraday constant F = 96485 C mol−1. Measuring in parallel the m/z = 44 signal and integrating over the release peak from the CO stripping allows defining a calibration constant:
![Equation ([3])](https://content.cld.iop.org/journals/1945-7111/165/6/F3307/revision1/d0003.gif)
with Q44 being the integrated MS ion current for m/z = 44.
For the studies of carbon corrosion at catalyst level under HT-PEMFC conditions an online mass spectrometer cell, which was developed for the study of alcohol oxidation under HT-PEMFC conditions,15 was employed. The working electrode in this cell is a circular gas diffusion electrode with 2 cm diameter and thus 3.14 cm2 geometrical surface area. The electrode is pressed either against a Nafion N-117 membrane or against a FumaPEM AM 55 PBI membrane, which separates the working electrode from the counter electrode compartment. The counter electrode compartment was filled either with 4 M sulfuric acid for low temperature testing or with 85% phosphoric acid for high temperature testing. In the counter electrode compartment, a platinum mesh was placed as counter electrode and a reversible hydrogen electrode (Hydroflex, Gaskatel, Kassel, Germany) as reference electrode. Gas was supplied to the working electrode via a capillary facing the center of the back side of the GDE. The exhaust was gathered at the bottom of the working electrode compartment and vented through a second capillary. A fraction of the exhaust stream is sucked into the mass spectrometer for analysis of the gas composition.
In addition to the measurement at catalyst level, additional measurements of the carbon corrosion on single cell level were performed for LT-PEMFC. For this a test rig designed for this purpose was employed. A scheme of the basic working principle is show in Fig. 1. The center of the test rig is a cell fixture for single cells with 25 cm2 geometrical electrode surface area with pneumatic setting of the cell compression and electric heating (qFC 25/100, balticFuelCells, Schwerin, Germany). The reactant gases for the cell were supplied by an assembly of mass flow controllers (el-Flow, Bronkhorst, The Netherlands). The cathode supply could be humidified by evaporating a dosed flow of water supplied by a Mini-CORI-Flow mass flow controller (Bronkhorst, The Netherlands) into the gas supply using a CEM Controlled Evaporator Mixer (Bronkhorst, The Netherlands). All MFCs and the evaporator were controlled via a central control unit, which was operated from a laptop computer. Downstream of the cell a quadrupole mass-spectrometer QMS 420 (Balzer, USA) was connected via a capillary. In the mass spectrometer the release of CO2 from the cell was monitored using the fragments m/z = 44 and m/z = 22. A particular tests run in this set-up was the FCCJ start-stop cycling test protocol described by Ohma et al.6 The test, which mainly consist of a fast cycling of the tested electrode between 1.0 V and 1.5 V vs. dynamic hydrogen electrode, simulates the air-air start degradation mechanism described by Reiser et al.3 which mainly causes carbon corrosion. In order to ascertain that that test mainly affects the carbon support of the catalyst and no other carbonaceous materials in the fuel cell electrode comparative measurements with a MEA exhibiting a Pt black electrode in combination with a usual GDL with MPL as well as with a MEA with Pt black electrode contacted with a gold mesh were performed.
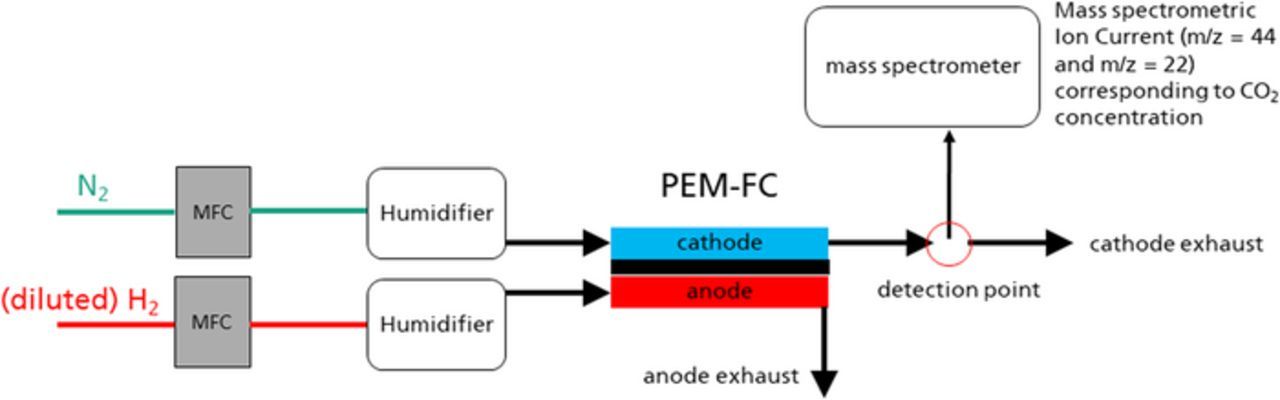
Figure 1. Basic scheme of the used set-up for online mass spectrometric measurements at single cell level.
Results
Carbon corrosion in flow-through DEMS cell
The measurements were performed as described in Ref. 6 Table 4 item start/stop cycling for half-cell RDE. Instead of a RDE the flow through DEMS cell was used, however, and instead of 0.1 M HClO4, 0.5 M H2SO4 was used as electrolyte. The stress test itself consisted as in the reference in triangular potential cycling between 1.0 V and 1.5 V vs. RHE at a scan rate of 500 mV s−1. CVs between 0.05 V and 1.2 V vs. RHE were recorder before the measurement and after each 1000 sets of potential stress cycles 1.0 V to 1.5 V vs. RHE. In Fig. 2 the evolution of this recorded CV curves for the HiSPEC 2000, HiSPEC 4000 and the 18 wt% Pt/CNT catalysts before the first stress test cycles after 8000 stress test cycles and after 15,000 stress tests cycles are shown. For all catalysts, a reduction of the platinum features, i.e. the hydrogen absorption and desorption peaks as well as the platinum oxide formation and reduction peaks is observed. This is most pronounced for 10 wt% Pt on carbon black catalyst and least pronounced for the 18 wt% Pt on CT catalyst. At the same time, the evolution of an additional oxidation peak at about 0.6 V vs RHE is observed. This peak can be assigned to the formation of carbon surface groups like quinones. The feature is again most prominent for the 10 wt% Pt on carbon black catalyst. Here the effect is, however, slightly stronger for the CNT supported catalyst than for the 40 wt% Pt on carbon black catalyst. From the recorded CV the electrochemical active surface area (ECSA) was determined using the hydrogen under potential stripping peaks. The results are shown in Fig. 3. The degradation rate is different for the three tested catalyst. The 10 wt% Pt/C starts at a very high ECSA value of 206 m2 gPt−1, which is even slightly enlarged to 222 m2 gPt−1 throughout the first 3000 stress cycles. Subsequently the ECSA rapidly decayed to a final value of 137 m2 gPt−1 so 66.5% of the initial ECSA. The observed ECSA of the 40 wt% Pt/C catalyst was much lower. It proved, however, also to be more stable exhibiting an almost linear decay from 77 m2 gPt−1 to 58 m2 gPt−1, so 75% of the initial ECSA. Finally, the 18% Pt/CNT catalyst exhibited the same ECSA of 77 m2 gPt−1 as the 40 wt% Pt/C catalyst at the beginning of the tests. For the 18 wt% Pt/CNT catalyst the ECSA was, however, slightly increased throughout the first half of the stress tests and then it was stable at a value of 83 m2 gPt−1, so 108% of the initial value.
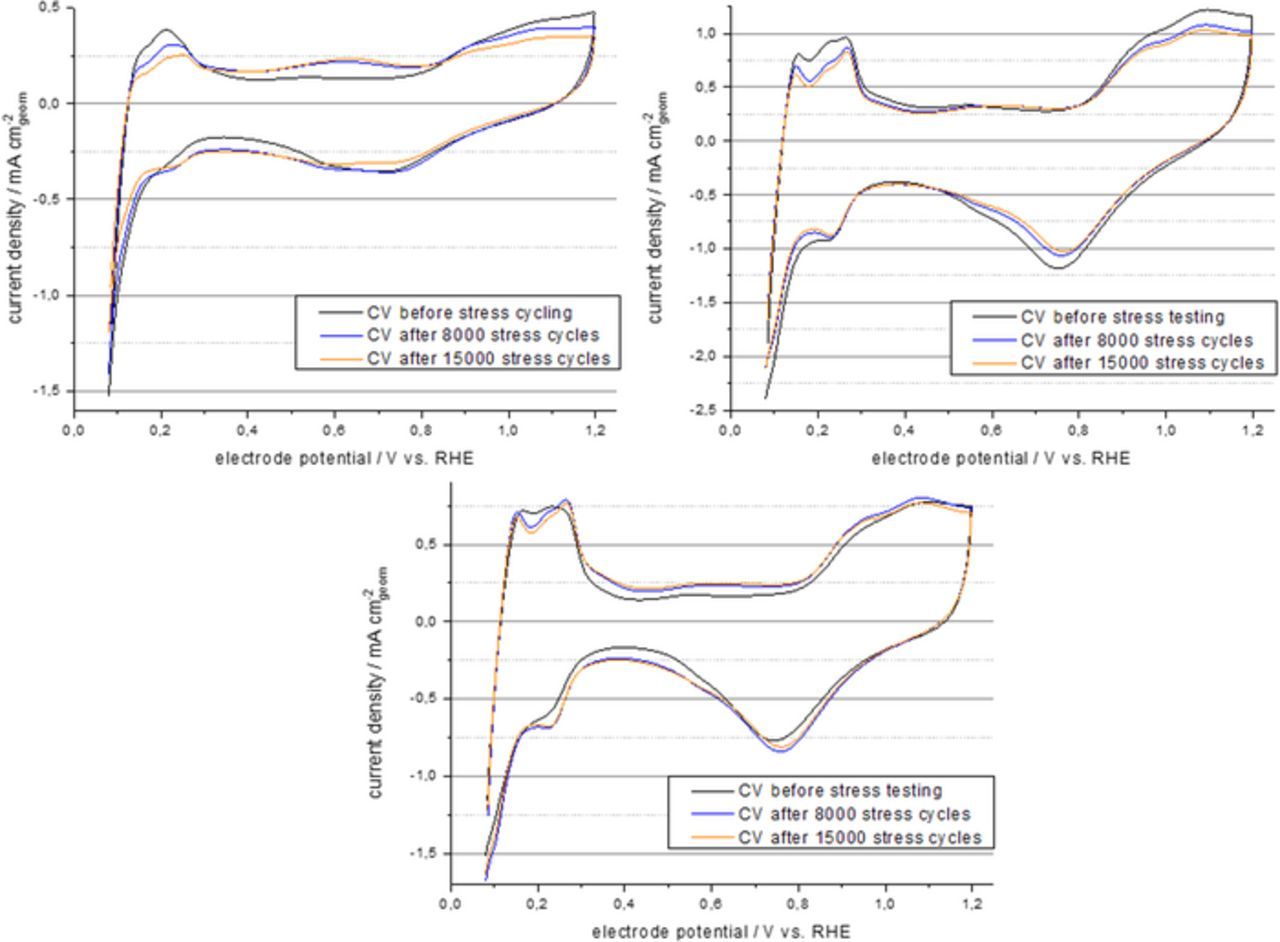
Figure 2. CV of the different tested catalyst before the ADT testing and after 8000 and 15,000 stress cycles, uper left 10 wt% Pt/C (HiSPEC 2000), upper right 40 wt% Pt/C (HiSPEC 4000), lower 18 wt% Pt/CNT.
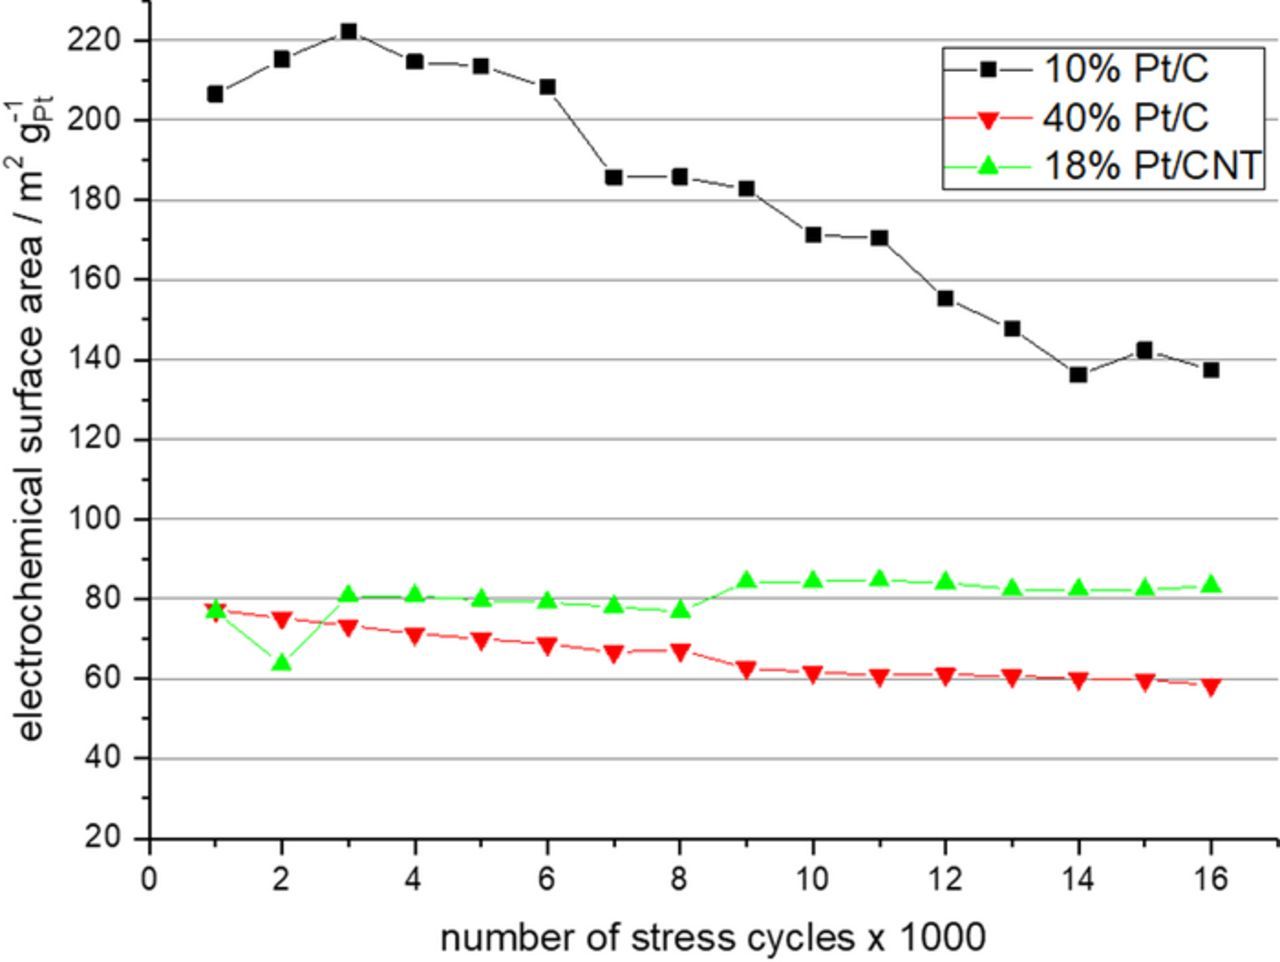
Figure 3. Evolution of the ECSA of the three tested catalyst measured after blocks of 1000 ADT cycles.
In Fig. 4 exemplarily the baseline corrected MS ion current for the fragment m/z = 44 are shown which were recorder during the first stress phase (cycles 1 through 1000) and the fifteenth stress phase (cycles 14,001 through 15,000) for the 40 wt% Pt/C catalyst. It becomes apparent, that in each stress phase a high release of CO2 occurs during the first cycles. The CO2 emission rate decreases during the stress phase. This decay occurs more rapid during later stress phase than during the first stress phases. From this results a difference of the integrated carbon mass loss during a stress phase. Carbon mass lost rates were therefore determined by integrating the mass loss over each stress phase and dividing by the stress phase duration of 2000 s.
![Equation ([4])](https://content.cld.iop.org/journals/1945-7111/165/6/F3307/revision1/d0004.gif)
Herein,  is the average carbon mass loss rate per second during a particular stress phase sp, MC = 12.011 g mol− 1is the atomic mass of carbon. KMS is the mass spectrometer calibration constant defined in Equation 3,
  is the time dependent MS ion current of fragment m/z = 44 and tsp = 2000 s the duration of the stress phase.
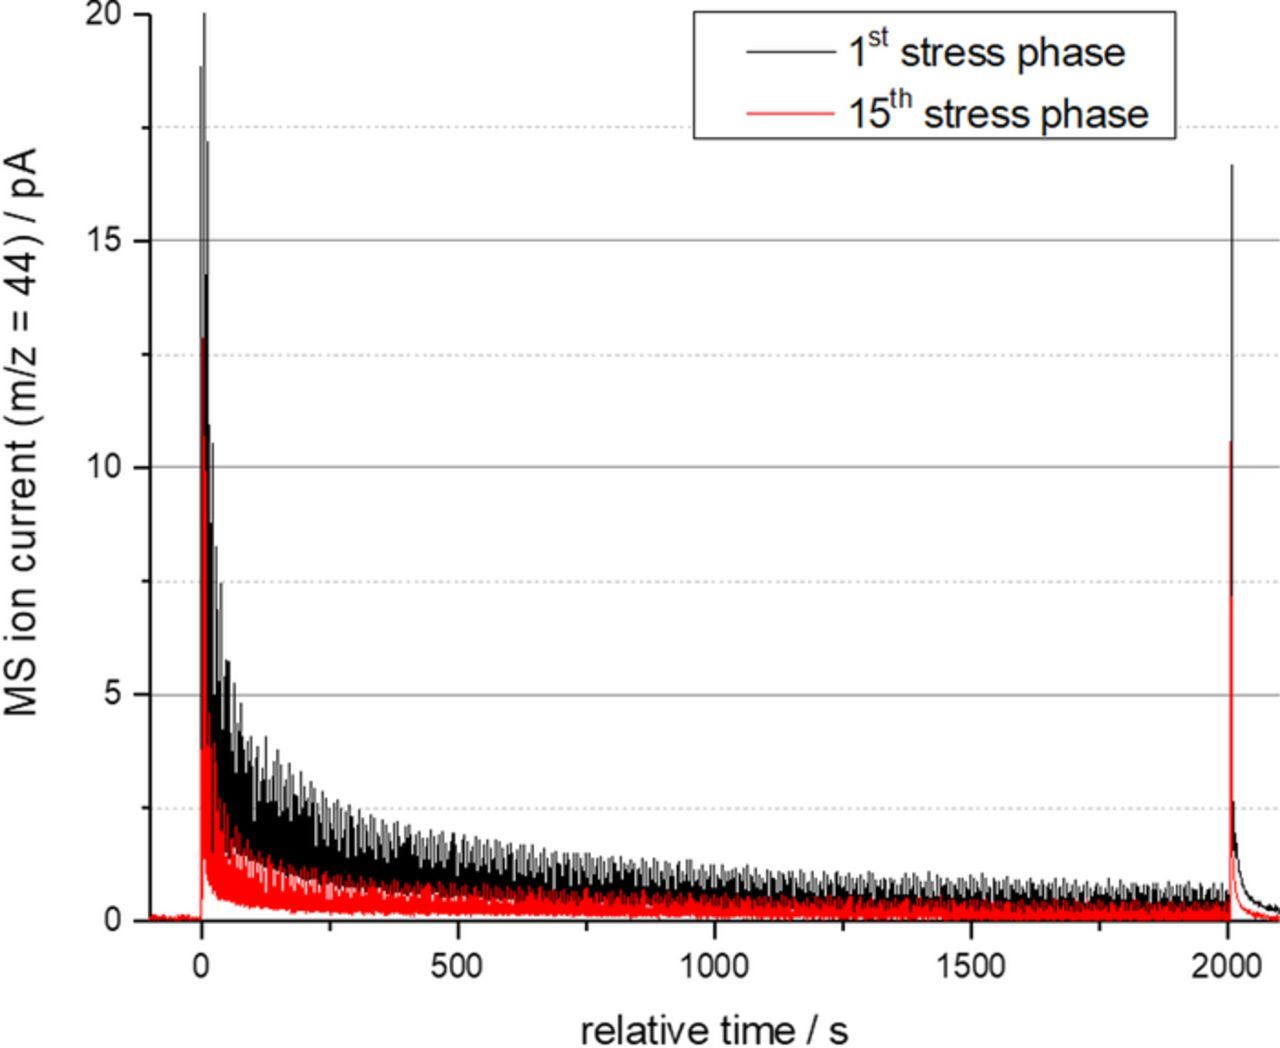
Figure 4. Base line corrected MS ion current for the CO2 fragment m/z = 44 measured for the 40 wt% Pt/C catalyst during the 1st stress phase (cycles 1 through 1000) and the fifteenth stress phase (cycles 14001 through 15000).
In Fig. 5a the carbon mass loss rates in dependence of the stress phase are shown for all three tested catalysts. The general trend is confirmed, that the carbon mass loss rate decreases during the stress test from stress phase to stress phase. As the catalyst loading and thus the platinum and carbon loading differs for the different electrodes as shown in Table I, the data need to be normalized in order to allow for a comparison. In Figs. 5b–5d, normalized version of the carbon mass loss rate curves from Fig. 5a are displayed were the mass loss rate was normalized with respect to the mass of carbon in the electrode, the electrochemical active platinum surface area and the product of both, respectively. Compared to the not normalized curves in Fig. 5a the normalized curves in Figs. 5b–5d show a much lower carbon loss rate for the CNT based catalyst once the higher catalyst loading (cf. Table I) was accounted. The normalization to the mass of carbon only (Fig. 5b) does not reveal any further information. However, if the carbon mass loss rate is normalized to the platinum active surface area the carbon mass loss rates for the two carbon black supported catalyst become almost identical (Fig. 5c). Additional normalization to the mass of carbon (Fig. 5d) slightly enhances the overlap of the carbon mass loss rate curves for the two carbon black supported catalysts at the end of the stress tests. However, the divergence in the initial phase of the stress phase is enlarged.
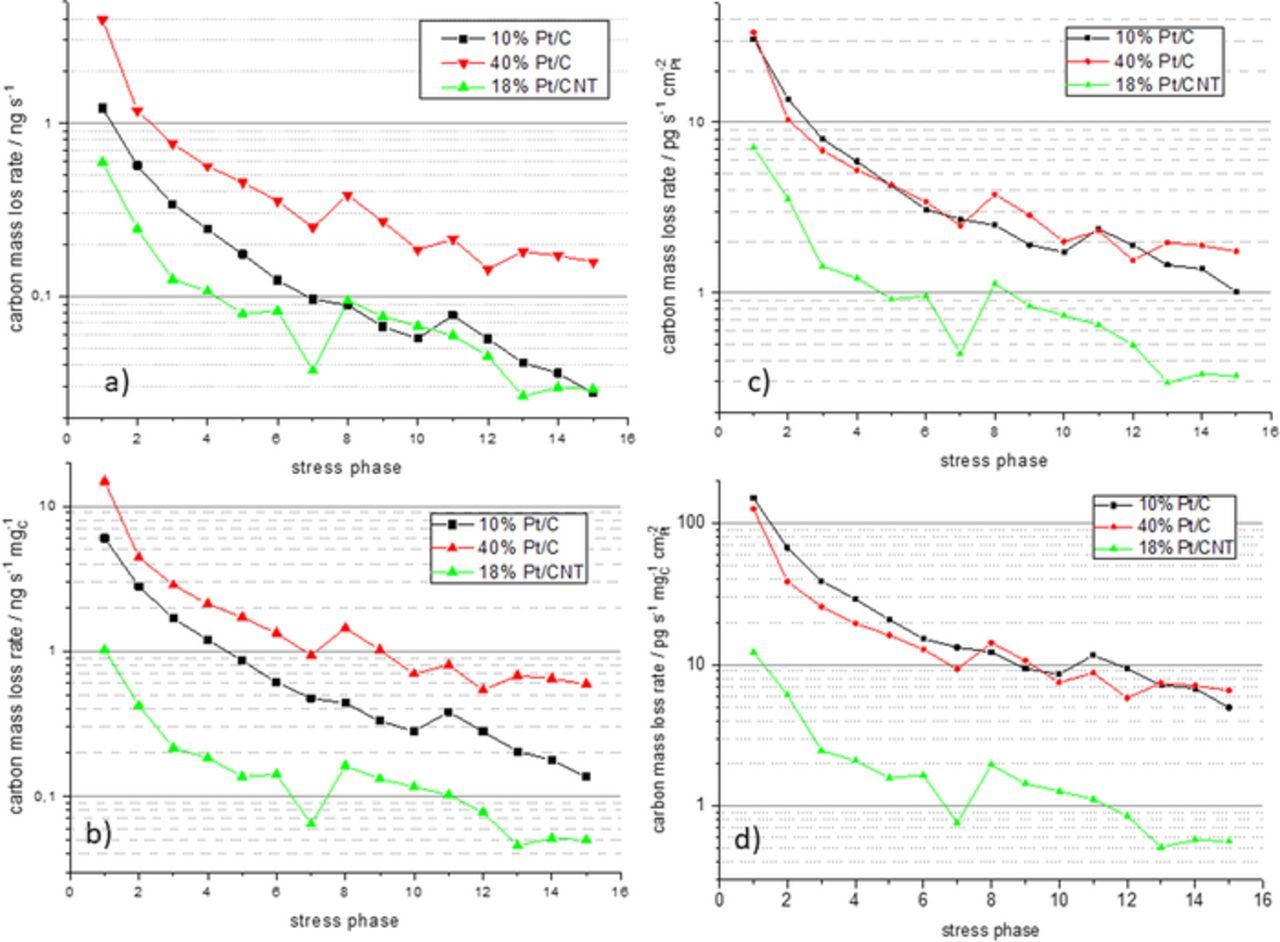
Figure 5. a) Carbon mass loss rate calculated from the m/z = 44 MS ion signal during is stress phase for the three tested catalyst; b) –d) depiction of the carbon mass loss rates in differenr normalization: b) normalized to the mass of carbon; c) normalized to the platinum active surface area, d) normalized to the product of mas of carbon and platinum surface area.
Table I. Parameters of the tested electrodes for the flow through DEMS measurement of carbon corrosion.
| Catalyst | Platinum loading/mgPt cm−2 | Carbon loading/mgC cm−2 |
|---|---|---|
| 10 wt% Pt/C | 0,0226 | 0,2031 |
| 40 wt% Pt/C | 0,1776 | 0,2661 |
| 18 wt% Pt/CNR | 0,1275 | 0,5807 |
Carbon corrosion in gas phase DEMS cell at elevated temperatures
In a next step, the carbon support corrosion was studied at actual gas diffusion electrodes in the gas phase DEMS cell. As catalyst, the HiSPEC 4000 40 wt% Pt/C catalyst was used. The measurements were conducted by stepwise increasing the potential. The values shown are the average values of the cell current and the MS ion current. Cell currents are normalized to the electrode geometric surface area whereas the CO2 MS ion current of the fragment m/z = 44 is normalized to the mass of carbon in the electrode.
First measurement were performed at 23°C and 60°C with the GDE being pressed against a Nafion N-117 membrane and the counter electrode compartment being filled with sulfuric acid. In these experiments, the upper potential was limited to 1.4 V in order to avoid significant oxygen production. The results are shown in Fig. 6 on the left hand side. At close to ambient temperature the onset of the CO2 formation is observed between 0.7 V and 0.8 V vs. RHE. At 60°C first CO2 formation is already observed at potentials as low as 0.2 V vs. RHE. The CO2 release here exhibits a peak at about 0.4 V and a shoulder at about 0.9 V vs. RHE. In total, the temperature raise caused a significant increase of carbon dioxide release by a factor of about 3 at 1.4 V vs. RHE. At the same time, the faradaic current increased by only a factor of about 2. This can indicate that the partial carbon oxidation reported by Ashton and Arenz10 is less present at higher temperatures.
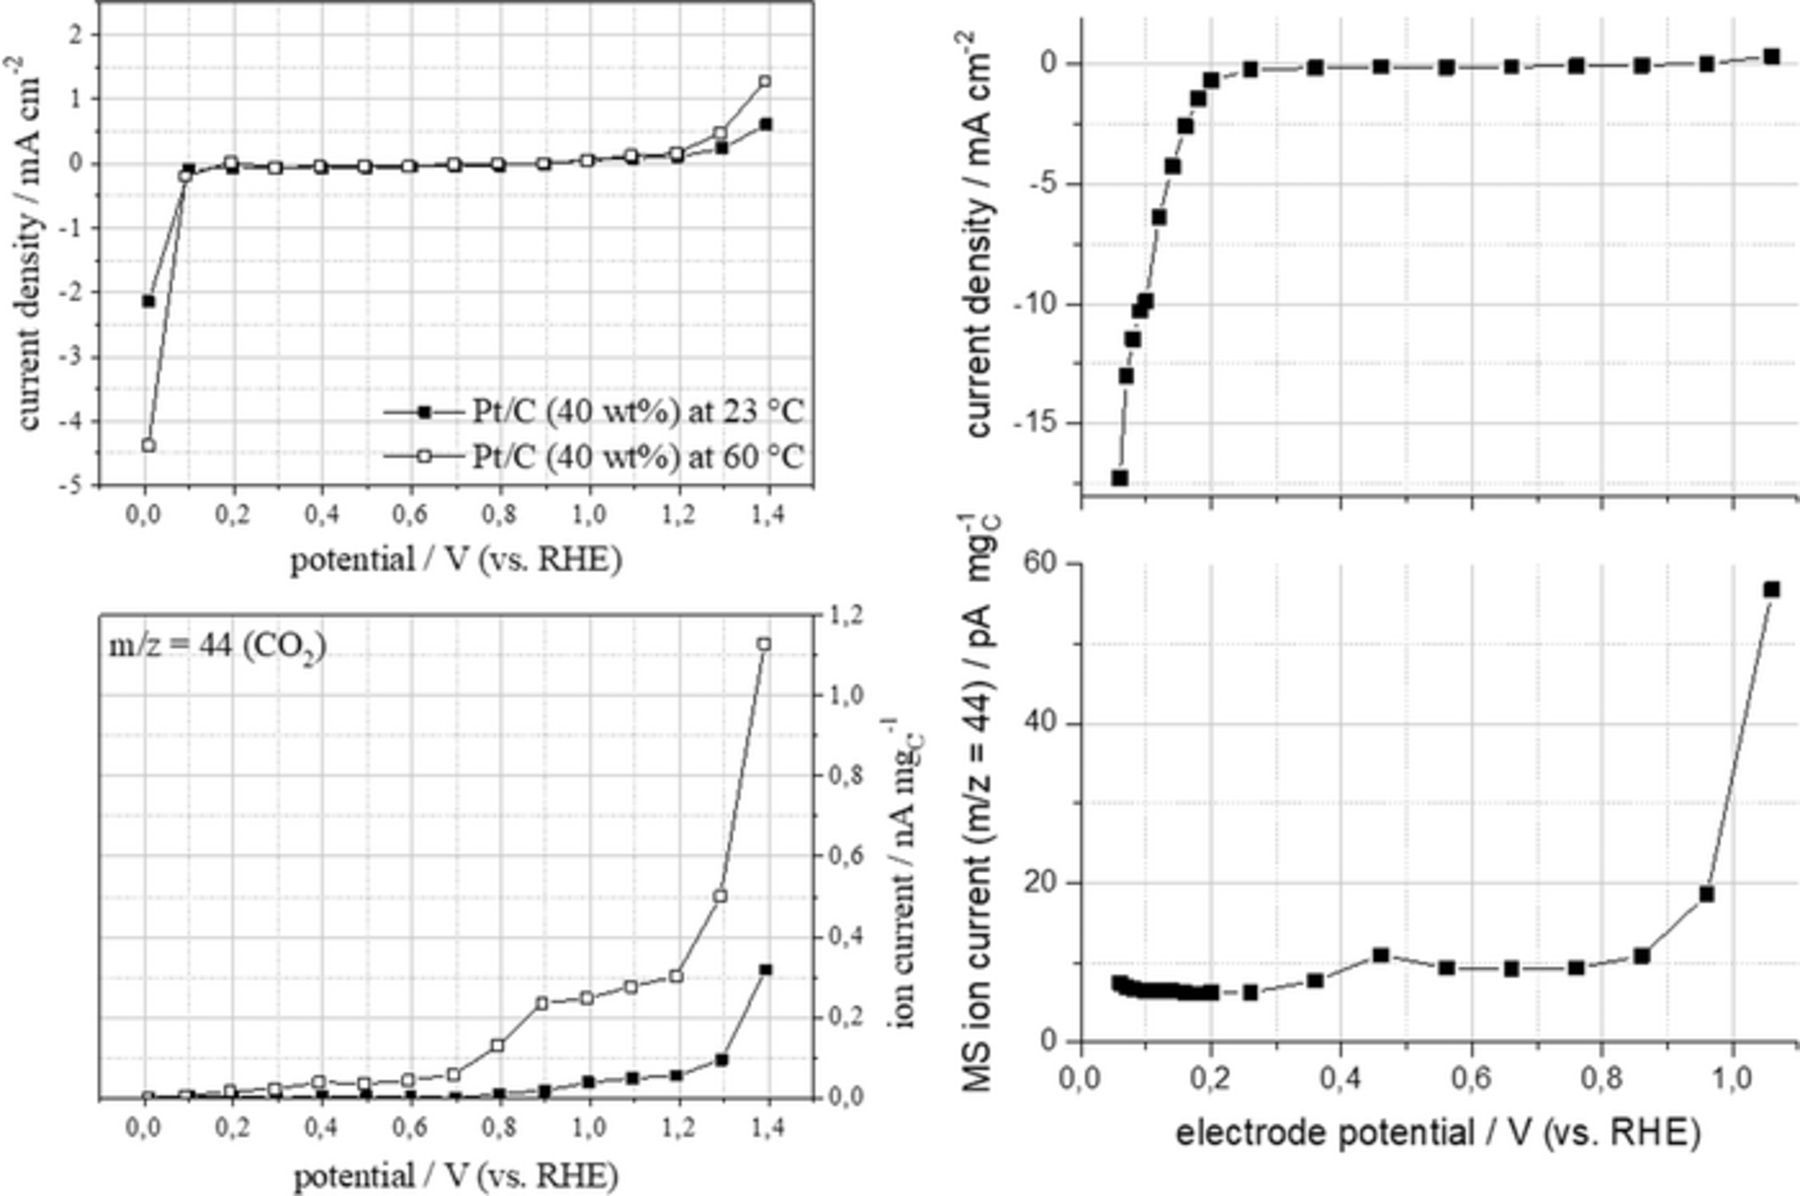
Figure 6. (left) faradaic current (upper) and m/z = 44 MS ion current (lower) observed during potentiostatic polarization measurements at a 40 wt% Pt/C electrode in the gas phase DEMS cell equipped with Nafion 117 membrane and 4 M sulfuric acid as electrolyte in the counter electrode compartment at different temperatures. (right) faradaic current (upper) and m/z = 44 MS ion current (lower) observed during potentiostatic polarization measurements at a 40 wt% pT/C electrode at 160°C in the gas phase DEMS cell equipped with FumaPEM AM 55 PBI membrane and 85% phosporic acid as electrolyte in the counter electrode compartment.
Further experiments were conducted under HT-PEMFC like conditions at 160°C with the GDE being pressed against a PBI membrane and the counter electrode compartment being filled with 85% phosphoric acid. As strong carbon corrosion was expected for potentials in excess of 1 V the potential was limited to this value. The results for the measurements under these conditions are shown in Fig. 6 right hand side. The on-set of the CO2 formation is not further shifted toward lower potentials. In contrast, the peak of the first wave of CO2 formation is shifted to slightly higher potentials of 0.45 V vs. RHE. The additional shoulder in the CO2 release curve at 0.9 V is not observed here. Over all, the MS ion current signal normalized to the mass of carbon is about an order of magnitude lower than at 60°C under LT-PEMFC conditions.
Carbon corrosion testing at single cell level
The tests at single cell level were conducted as follows. After mounting the MEA in the cell fixture, the cell was connected in the fuel cell mode with hydrogen being fed to the anode and synthetic air being fed to the cathode. The MEA was than broken-in according to the MEA producer instructions. Subsequently an iV curve was recorder to document the beginning of test performance. Afterwards the cell fixture was reconnected in half-cell mode supplying nitrogen to the cathode which became the working electrode. The anode side, which was used as counter and reference electrode during the half-cell testing, was fed with a mixture of 5 vol% hydrogen in nitrogen. The reduced hydrogen content of the counter electrode feed was selected in order to minimize parasitic anodic currents at the working electrode resulting from hydrogen cross over. In consequence, the potential of the dynamic hydrogen reference electrode should be 0.04 vs. RHE. In this configuration, a cycle of different tests was performed. At the beginning of each cycle, a CV was recorded in order to allow for the determination of the (remaining) ECSA through analysis of the hydrogen under potential stripping. Additionally the evolution of the double layer current was investigated as indication of changes in surface roughness. Subsequently, potentiostatic measurement for potentials between 350 mV and 900 mV vs. DHE were conducted. The measurement of each potential comprised a potential hold at 150 mV vs DHE till a stable MS signal has evolved which was used for baseline correction; a short potential pulse of 900 mV vs. RHE in order to clean the catalyst surface; a potential hold for 600 s at the target potential. During this 600 s the CO2 evolution is monitored, however only the last 30 s were considered when determining the average carbon mass loss rate; finally the potential is returned to 150 mV vs. DHE. The different potentials were probed in random order. After these tests within the regular potential range for fuel cell operation accelerated degradation test according to the FCCJ start-stop-cycle protocol where performed in some cases. The test followed the description in Ref. 6 except the number of 1.0 V to 1.5V potential cycles was slightly reduced to 900 instead of 1000. This cycle was repeated five times for each MEA
In contrast to the situation in the flow-through DEMS cell, in an actual fuel cell membrane electrode assembly the catalyst support is usually not the only carbonaceous material which is present and which can cause the release of CO2. Other major contributions might be expected from the gas diffusion layer (GDL) in particular if it features a microporous layer (MPL) as this layers are usually made from a similar type of carbon black as is used as catalyst support. In order to estimate the contribution of these additional sources to the CO2 signal observed during the cell test, a series of tests of MEA with different content of carbonaceous materials was performed. The first MEA was a regular commercial MEA by balticFuelCells having a carbon supported Pt/C cathode catalyst and a GDL with MPL. The second MEA, which was provided by the Center for Solar Energy and Hydrogen Research Baden-Württemberg (ZSW), used platinum black as cathode catalyst eliminating carbon support as source of CO2. MEAs of this kind were tested either with a regular GDL with MPL or with a gold mesh as contact. In the latter case, all sources of carbon dioxide were eliminated on the cathode side so that no observation of CO2 was expected. The CO2 release observed for this three different type of MEAs is shown in Fig. 9. As expected for the MEA without carbonaceous materials in the working electrode no CO2 release is observed. The CO2 release for the MEA with platinum black electrode and usual GDL is much lower than for the MEA that also used carbon supported catalyst. This is in particular the case for the high potential region, where a strong increase of carbon dioxide release from the supported catalyst is observed whereas the CO2 release from the MEA with platinum black electrode and regular GDL was almost potential independent. The small CO2 peak which was observed at catalyst level for 63°C at 400 mV vs. RHE (cf. Fig. 6) and for 160°C at 450 mV vs. RHE (cf. Fig. 7) is also recognisable as shoulder at 450 mV vs. DHE in the CO2 release curve of the regular MEA.
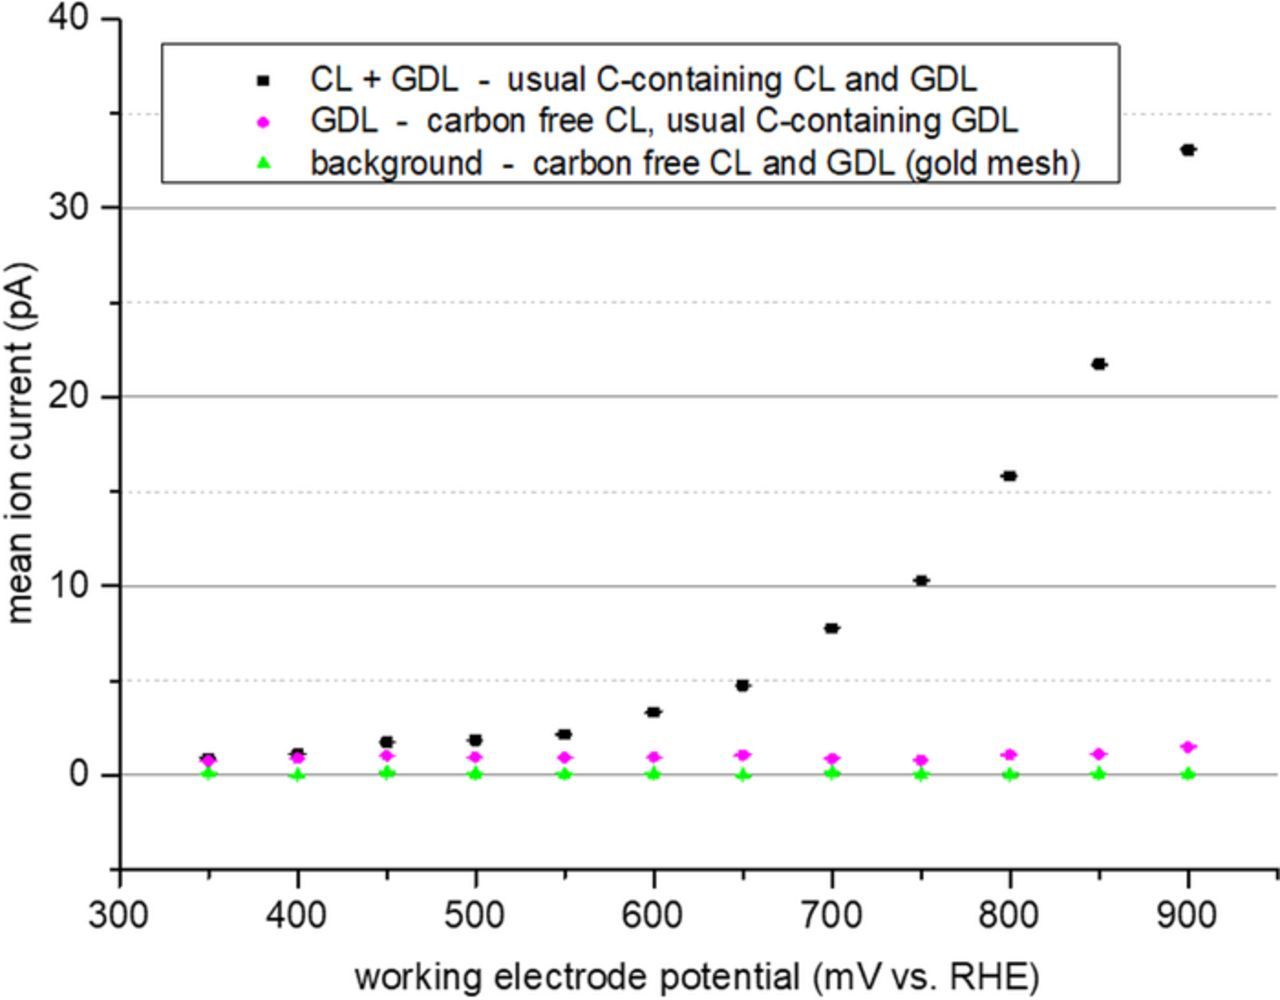
Figure 7. Average m/z 44 ion current for potentiostatic measurements at MEA with different cathode catalyst layers and GDLs.
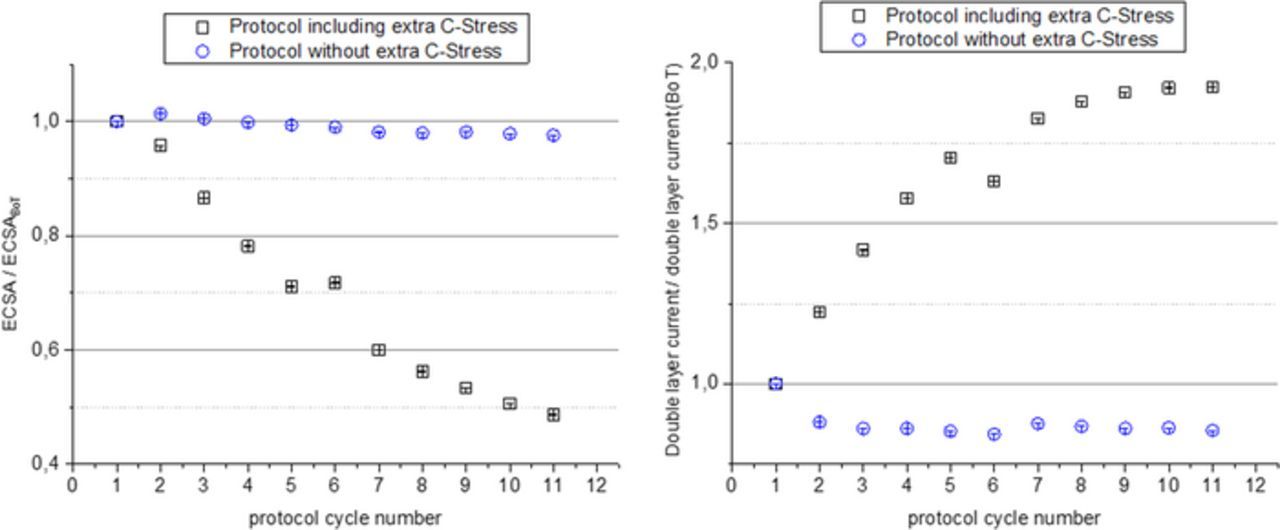
Figure 9. Evolution of the MEA CV properties relative to the BoT values throughout the test cycles with (black symbols) and without (blue symbols) star-stop-cycling ADT (left) ECSA, (right) double layer current.
In a next step, the effect of humidity and temperature on the carbon corrosion rate was studied during regular testing excluding carbon corrosion ADT procedures. The results are shown in Fig. 8. As can be seen in Fig. 8 left the relative humidity has not a significant effect on the carbon mass loss rates. The higher average carbon mass loss rates observed for high potentials with a relative humidity of 70% are going along with an increased error margin so that within the error regime values are comparable to those for other humidity levels. In contrast, temperature has a strong influence on the carbon mass loss rate as can be seen in Fig. 8 right. At 900 mV the carbon mass loss rate is about doubled if the temperature is raised from 75°C to 90°C.
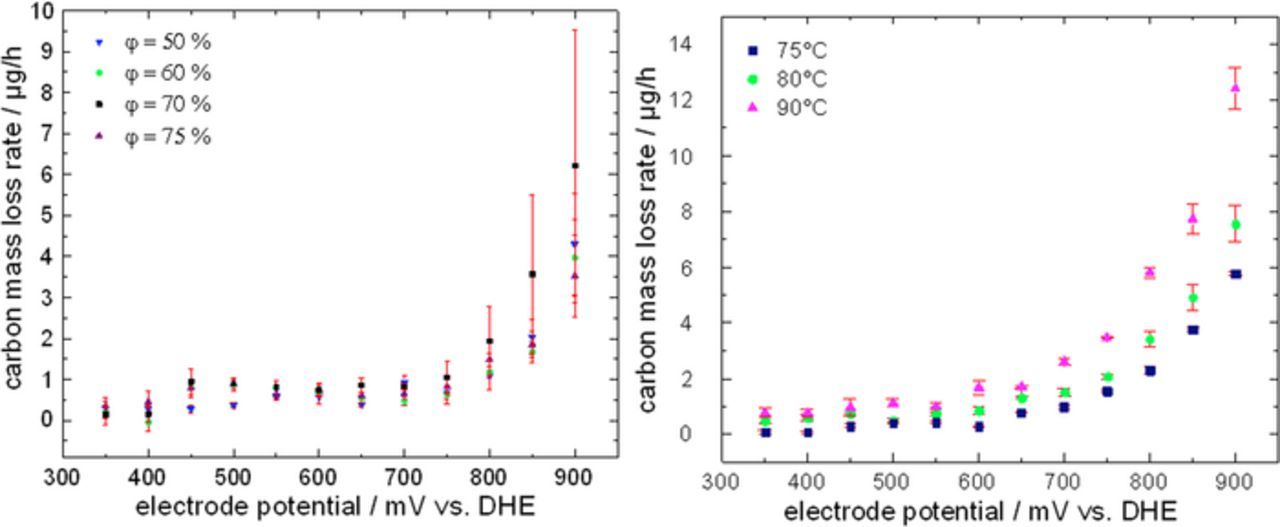
Figure 8. Potential dependent carbon mass loss rates under potentiostatic conditions (left) as function of relative humidity, (right) as function of cell temperature.
In further tests, the effect of the ADT procedure on the MEA was evaluated and compared to the degradation observed without particular ADT testing. In Fig. 9 the evolution of the electrochemical surface area and the double layer current relative to the respective beginning of test values (BoT) are shown for cycles excluding (blue symbols) and including the carbon corrosion ADT. Without ADT the ECSA is almost unchanged during the tests whereas the double layer current is slightly reduced indicating a slight loss of surface area of the support. If the tests include the carbon corrosion ADT the ECSA at the end of the test is reduced to less than 50% of the beginning of tests values. At the same time, the double layer current is almost doubled indicating a strong coarsening of the support through carbon corrosion. The strong contribution of carbon corrosion is confirmed by the observation of a strong CO2 release during the ADT cycling as shown in Fig. 10.
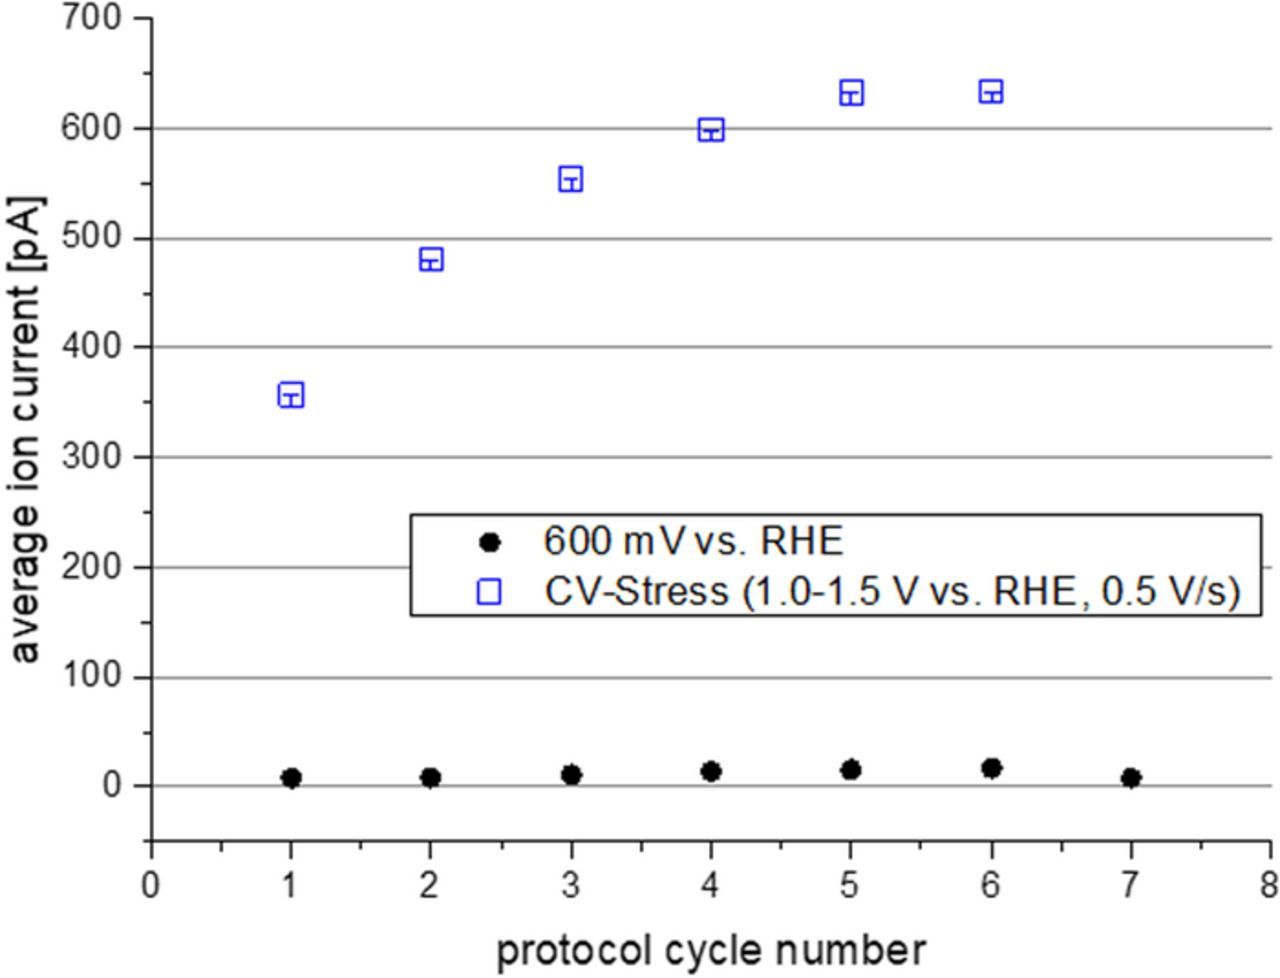
Figure 10. Average m/z MS ion current throughout the test cycles measured in the CA phase at 600 mV with prior ADT (blue symbols) without ADT (black symbols).
Again, it was tested if replacing carbon black as support can reduce the effect of carbon corrosion. Therefore, a MEA was prepared using 18 wt% CNT catalyst on the cathode side. During the test protocol part before the ADT the carbon mass loss rates of the MEA with CNT supported catalyst was comparable to those of the MEA with carbon black supported catalyst (cf. Fig. 11). During the ADT the observed carbon release rate as indicated by the m/z = 44 ion current of the mass spectrometer is much higher for the carbon black supported catalyst than for the CNT supported catalyst as can be seen in Fig. 12. Furthermore, it was found that after the ADT the carbon mass loss rate during subsequent testing in the potential region 350 mV to 900 mV vs. DHE is still increased. This is the case for both supports. The effect is, however, much stronger for the carbon black support catalyst (cf. Fig. 13). Fig. 13 shows the potential dependence of the carbon mass loss rate after the ADT for both tested catalysts. The apparently erratic behaviour, which is seen in particular for the carbon black supported catalyst, is in fact a time dependence as the potentials were tested in random sequence as mentioned before. The number in Fig. 13 indicate the timely order of the measurement. For the carbon black supports, large carbon mass loss rates are observed either at high potentials or shortly after the exposure of the catalyst to high potentials. This was verified by evaluating the evolution of the carbon mass loss rate throughout five consecutive test runs through the potentials between 350 mV and 900 mV vs. DHE, which is shown in Fig. 14. It becomes apparent that the prior ADT run has destabilized the carbon black support in a way that for a certain time carbon mass loss rates are enhanced even at comparatively low potentials.
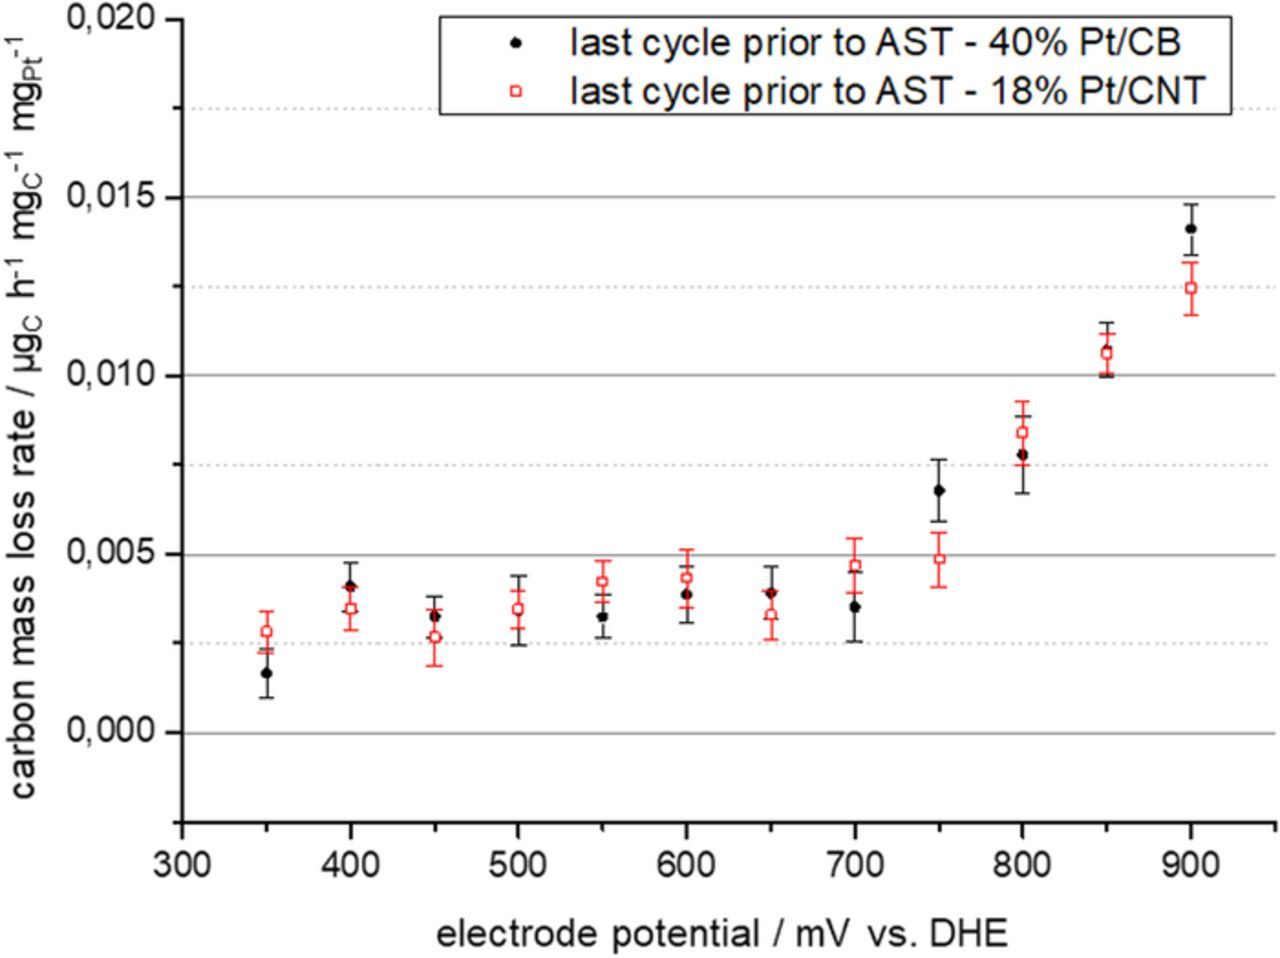
Figure 11. Carbon mass loss rates for MEA with 40 wt% Pt/C cathode layer and 18 wt% Pt/CNT cathode layer measured during the last CA repetition before the ADT testing.
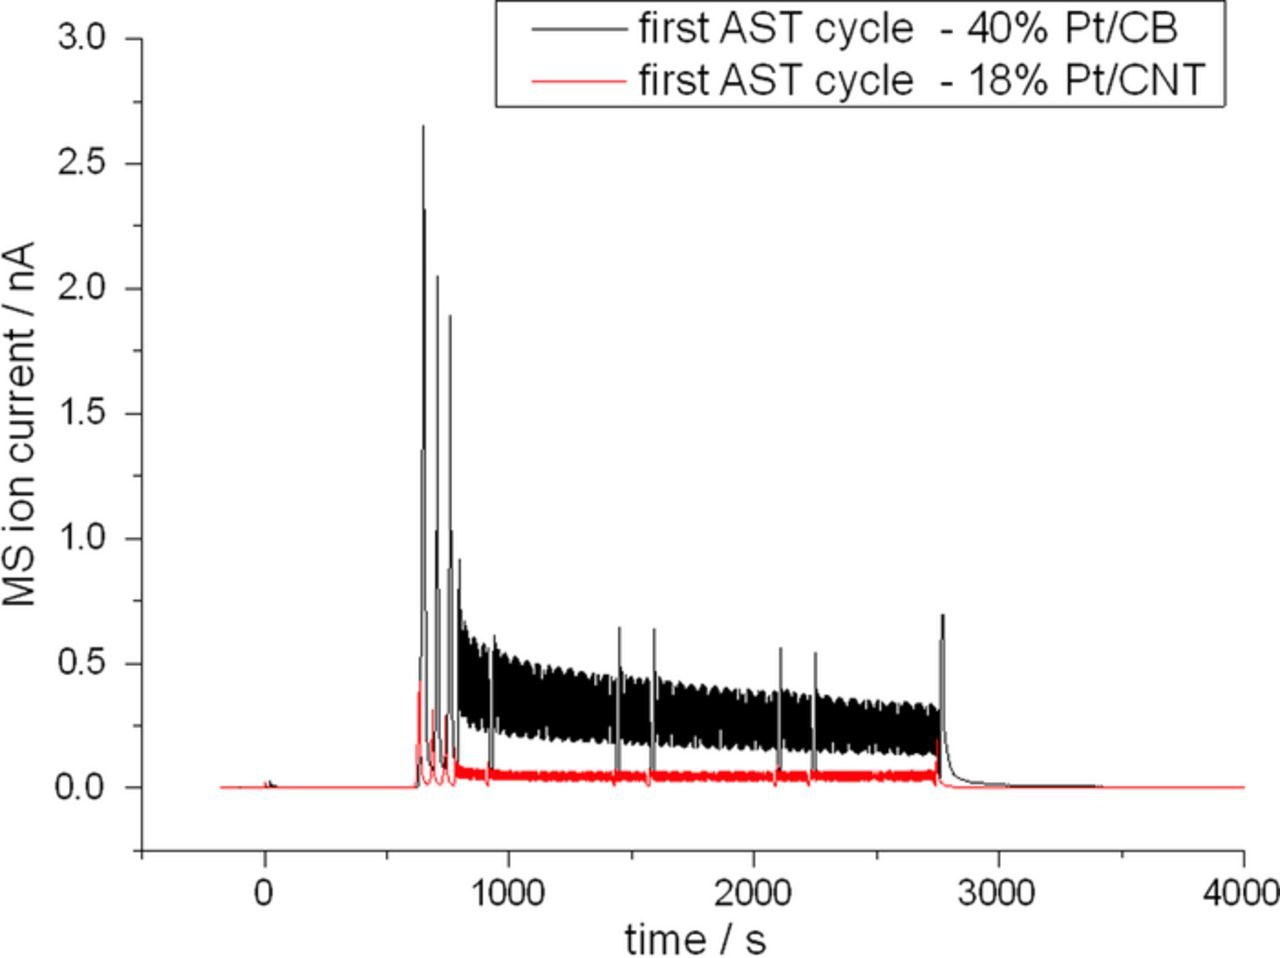
Figure 12. m/z = 44 MS ion current for MEAS with 40 wt% Pt/C and 18 wt% Pt/CNT catalyst layer measured during one stress phase of the ADT testing.
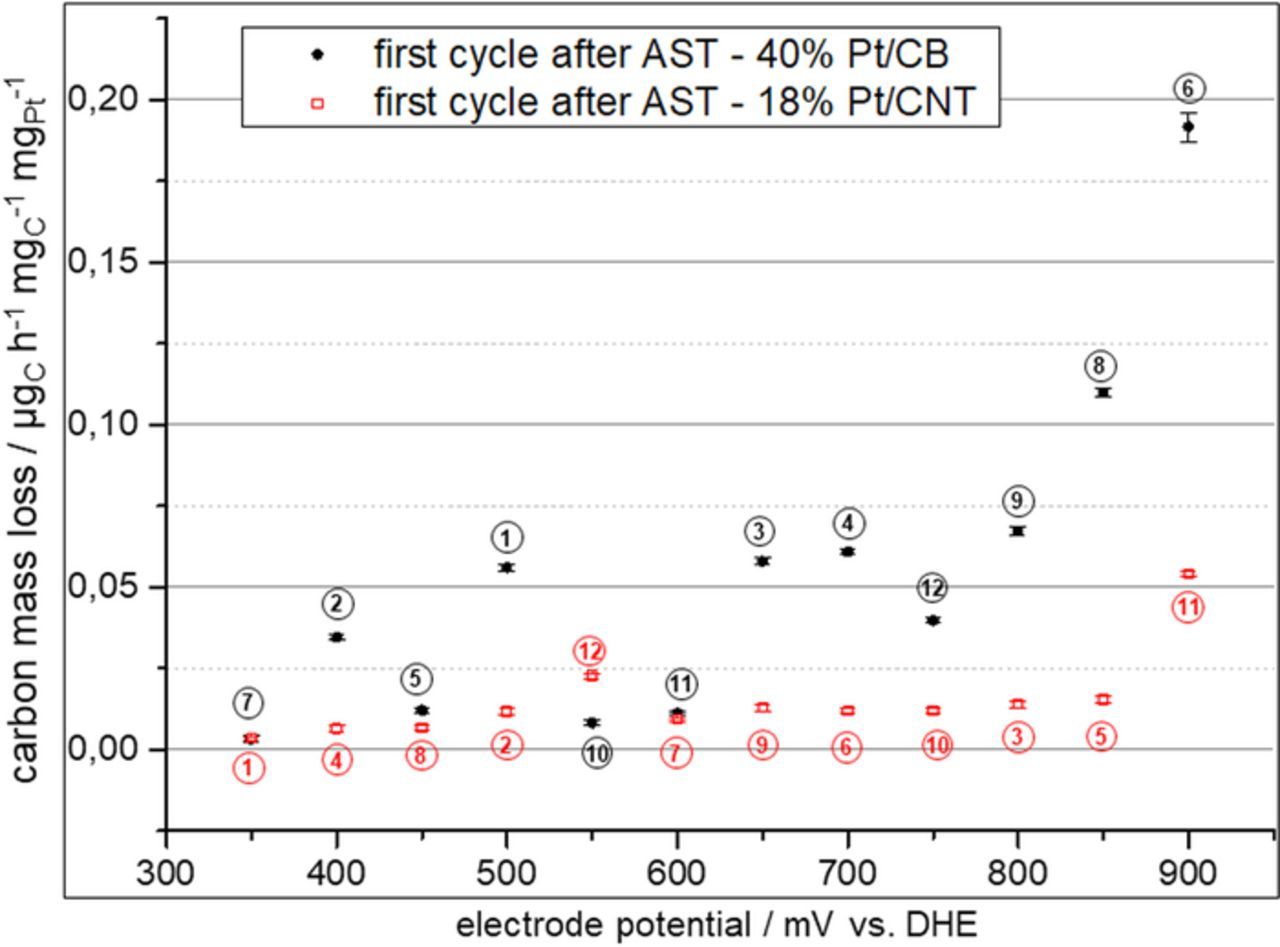
Figure 13. Carbon mass loss rates for MEA with 40 wt% Pt/C cathode layer and 18 wt% Pt/CNT cathode layer measured during the first CA test run after the ADT tests. Number indicate the sequence of the measured potentials.
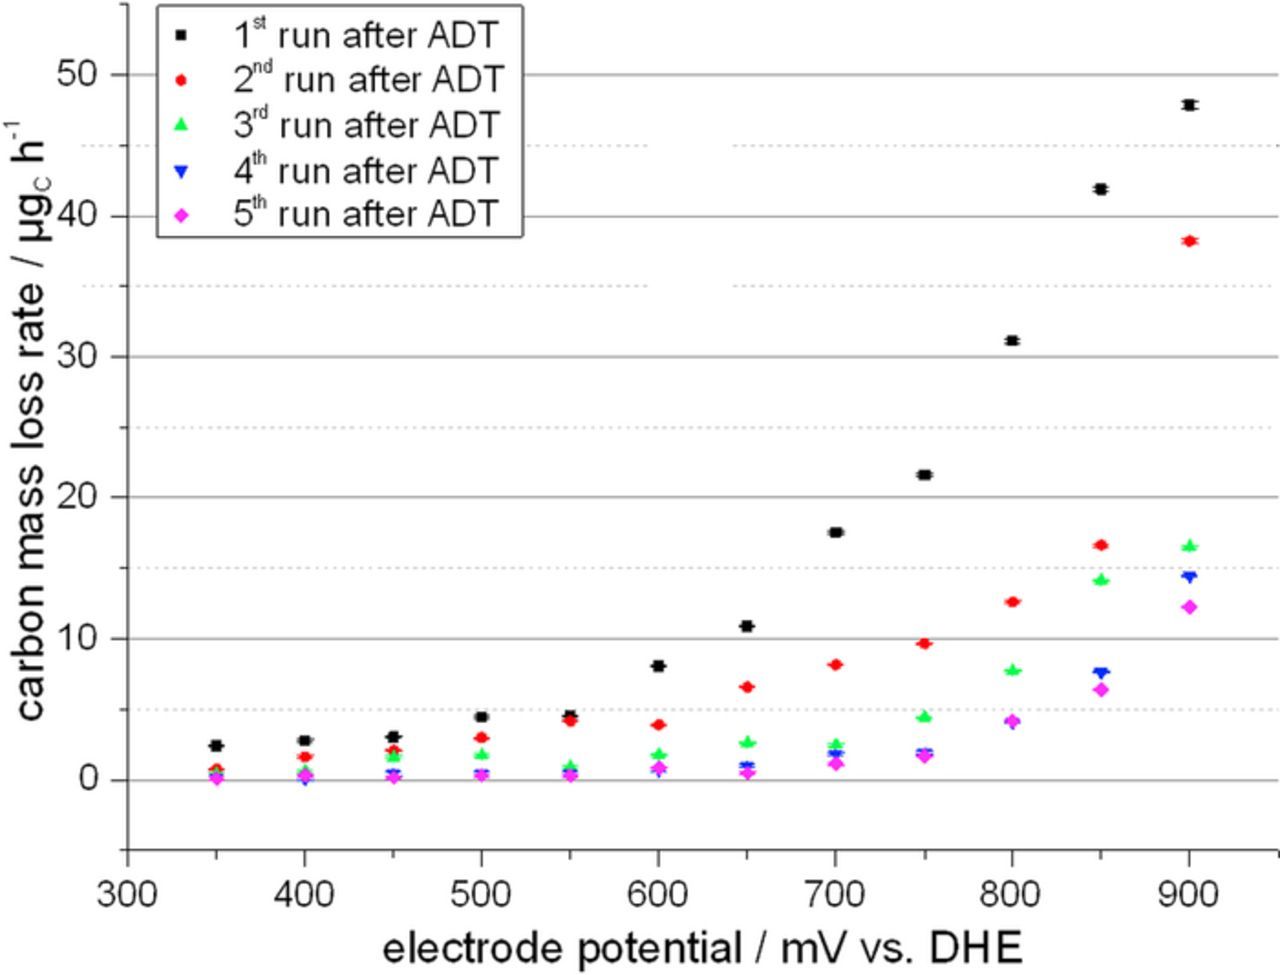
Figure 14. Carbon mass loss rate of a 40 wt% Pt/C MEA measured throughout five consecutive CA test runs after an ADT test period.
Discussion and Conclusions
The start-stop cycling ADT protocol for catalyst testing using rotating ring electrodes (RDE) proposed by the FCCJ and described by Ohma et al. in Ref. 6 was transferred to our flow through DEMS cell. Thus, not only the loss in ECSA could be monitored, but also the carbon mass loss, which occurred, could be observed and quantified. It was shown that both the platinum loading of the catalyst and the type of carbon support influence the rate of loss of ECSA. For carbon black supported catalyst the loss rate for ECSA was larger for a low catalyst loading most likely due to a higher catalyst dispersion, which is evidenced by the very high beginning of test ECSA of the 10 wt% catalyst. The 40 wt% catalyst had a much lower BoT ECSA. However, the loss in ECSA by the start-stop-cycling ADT is pronouncedly lower than for the 10 wt% catalyst. The CNT supported catalyst exhibited a similar ECSA as the 40 wt% carbon black supported catalyst at the beginning of the test. However, its ECSA was almost unaffected by the stress test. Carbon mass loss measurements revealed that the carbon mass loss decelerates throughout the stress test. The differences in the absolute mass lost rates are smaller than the differences in ECSA losses. It was found that normalization of the mass loss curves with respect to mass of carbon and platinum surface area could deliver additional insights. So mass loss curves, which are normalized with respect to the platinum surface area, showed almost identical behavior if the same type of support is used. This is a strong hint to a substantial catalytic contribution of platinum to the carbon corrosion. This hint to a catalytic contribution was found for the ADT tests which holds the potential in the range of 1.0 V to 1.5 V which is in contradiction to the findings by Linse et al.8 who mainly found direct carbon corrosion without significant platinum contribution in this potential region. Interestingly, the test by Linse et al. were conducted with the electrode in the gas phase whereas the tests in the flow through DEMS cell were conducted with a liquid electrolyte. In principle, the contact to water should favor the formation of an oxide scale on the platinum, which is assumed to render it less active. However, the structure of the scale in presence of an aqueous electrolyte might differ from that formed in the gas phase in presence of Nafion as solid electrolyte. This point might require further investigation. In principle, the loss of ECSA cannot be assigned to the carbon mass loss alone. As carbon mass loss and evolution of ECSA where the only variables measured here it would not be conclusive to try to estimate further contributions to the ECSA loss.
In contrast to the tests in the flow through DEMS cell, which simulated RDE testing, the tests in the gas phase DEMS cells are closer to actual fuel cell testing. It was shown that carbon corrosion in a Nafion/sulfuric acid based cell occurs already at rather low potentials. The corrosion rate is strongly increasing with temperature. In addition, at a higher temperature of 63°C an additional carbon corrosion peak occurred at about 400 mV. Transferring to a cell simulating HT-PEMFC with PBI membrane soaked with phosphoric acid and a test temperature of 160°C did, however, not further increase the carbon corrosion rate. The low potential corrosion peak was even slightly shifted toward higher potentials. This might indicate that the poisoning effect of phosphate on platinum also offers a slight inhibition of the carbon corrosion catalytic effect. As strong carbon corrosion was expected for potential above 1.0 V the experiments were limited to this value. Therefore no further information on the effect of higher potentials e.g. regarding the effect of oxide scale formation can be given.
The online MS tests at an actual fuel cell confirmed many of the results obtained at catalyst level. The comparison of results for MEA with Pt/C and Pt black electrode allowed excluding MPL as a significant contributor to the observed carbon corrosion. The fact that for a MEA with Pt black electrode and gold mesh contacting practically no CO2 release was observed also is a strong indication that the start-stop cycle ADT does not significantly stress the ionomer neither in the membrane nor the electrode,
A surprising result was the finding that the start-stop cycle ADT caused a destabilization of the carbon support, which lead to an increase of the carbon mass loss rates on subsequent operation even if no stress potentials were applied. This can go along with the finding by Ashton and Arenz9,10 who found that transferring their carbon electrode to low potentials after excursion to high potential caused the formation of reduced oxygenated carbon surface groups which are easier to oxidize than the carbon itself. However, the potentials for which CO2 release is observed in this work are even lower. This may, may however, be only due to stochastic reasons as the measurements in this work where performed at MEA with 25 cm2 electrodes with a significant higher loading than that used by Ashton and Arenz in their DEMS cell. Therefore, the amount of CO2 released from weak oxidation events is strongly increased and thus easier to detect. In accordance with Ashton and Arenz, the low potential CO2 release can thus most likely be ascribed to the formation of labile carbon surface groups, which is also indicated by the evolving of a quinone redox peak in the CV. Most surprising is the rather long period of time through which this condition does still exist. The effect is also observable for CNT supported catalyst though at much smaller scale. Throughout all tests CNT supported catalyst have shown a much better stability than the carbon black supported one.
In total, it was successfully shown that combining electrochemical measurements with online mass spectrometer measurements could give additional insights into the carbon support related degradation of fuel cell catalyst. An important advantage of the MS compared to other CO2 monitoring technologies like infrared absorption is that with DEMS cells a tool is available which allows for studying carbon support corrosion at an experimental level, which is equivalent to RDE testing.
Acknowledgments
The authors thank Joachim Scholta and his team at ZSW for supplying the MEA with platinum black electrode layer. The financial support of this work in parts by the following organizations is gratefully acknowledged. German Federal Ministry of Education and Research (BMBF) as part of the "Gecko project" grant number 03SF0454A. German Federal Ministry of Education and Research (BMBF) as part of the "HT-Linked" project grant number 03SF0531F. German Federal Ministry of Education and Research (BMBF) international office (IB) as part of the "Daltoca" project, grant number 01DB15015.
ORCID
C. Cremers 0000-0002-1513-5157
T. Jurzinsky 0000-0002-7528-8358