Abstract
This study presents a characterization of the degree and mechanism of corrosion inhibition of Zn by vanadate inhibitors. A combination of open circuit potential measurements, anodic and cathodic polarization, and Raman spectroscopy were used to compare corrosion inhibition of Zn exposed to or pre-treated with a dilute ∼pH 6.3 NaVO3+NaCl solution, which likely contained predominantly tetrahedrally coordinated vanadate species, relative to controls. The presence of vanadate caused a decrease in corrosion current density of up to two orders of magnitude due to overall mixed anodic and cathodic inhibition associated with the formation and/or stabilization of adherent surface films.
Export citation and abstract BibTeX RIS

This is an open access article distributed under the terms of the Creative Commons Attribution Non-Commercial No Derivatives 4.0 License (CC BY-NC-ND, http://creativecommons.org/licenses/by-nc-nd/4.0/), which permits non-commercial reuse, distribution, and reproduction in any medium, provided the original work is not changed in any way and is properly cited. For permission for commercial reuse, please email: oa@electrochem.org.
Vanadates have been shown to be corrosion inhibitors on a range of alloys including Mg,1,2 Fe,3,4 and Zn.5–7 Additionally, significant efforts over the last decade have been devoted to understanding corrosion inhibition of AA2024-T3 by vanadates.8–12 For AA2024-T3, inhibition has been reported to be pH and concentration dependent (speciation dependent) and has been strongly linked to tetrahedrally coordinated vanadates reducing cathodic oxygen reduction kinetics on Cu-containing intermetallic compounds (IMCs) through a surface adsorption mechanism.11–14 Other works have shown that vanadates also provide inhibition to Zn-rich Al alloys such as AA7075.15,16 This, in combination with evidence of vanadate inhibition on Zn-based materials,5–7 has led to speculation that vanadates likely interact with the Zn-rich phases in 7xxx series Al alloys (possibly in addition to the Cu-rich features). Zn-rich IMCs in 7xxx series Al are relatively active to the surrounding matrix17 and generally not associated with oxygen reduction (as compared to generally noble Cu-containing IMCs in Al alloys). It has been reported that the primary cathodic reaction at a Zn surface in water is hydrogen evolution through the reduction of water, followed secondarily by the reduction of dissolved molecular oxygen.18 However, a number of works have indicated that in dilute chloride electrolytes with available oxygen, the oxygen reduction reaction is the dominant cathodic reaction on Zn.19 This raises a critical question: if vanadates act as corrosion inhibitors on Zn (or interact with Zn-rich features in Al alloys) what is the mechanism of inhibition? Given that both oxygen reduction and water reduction are available cathodic reactions on Zn and that Zn-rich IMCs in Al alloys generally do not support oxygen reduction this may suggest differences in how inhibition is achieved between Zn-rich and Cu-rich surfaces.
The objective of this paper is to characterize whether and to what extent aqueous or adsorbed vanadates can act as corrosion inhibitors on Zn and to help better understand the mechanism of inhibition on Zn-based alloys or Al alloys that contain Zn. This understanding is important to: 1) help explain observed vanadate inhibition on Al alloys that contain large concentrations of Zn (with broader importance for identifying alternatives to chromate-based inhibitors), and 2) evaluate whether vanadates may serve as corrosion inhibitors on Zn and/or as surface pretreatments for galvanized materials in certain niche applications. The following paper presents both an electrochemical characterization of corrosion inhibition by vanadates on Zn and a characterization of surface chemistry and bonding using Raman Spectroscopy.
Experimental
Materials, electrolyte preparation, and surface pretreatment
Zn foil samples (99.9+%) were polished with successive grades of SiC paper to 1200 grit using 200 proof ethanol as lubricant for all experiments. In general, three sample conditions were explored in this study: (1) Zn in NaCl solution, (2) Zn in NaCl+NaVO3 solution, and (3) "pretreated" Zn in NaCl solution. Samples noted as "pretreated" were immersed in a NaCl+NaVO3 solution for 48 hours, followed by a rigorous DI water rinse, sonication in DI water for 10 minutes, and a final rigorous DI water rinse. Rigorous DI water rinses consisted of 30–45 seconds under a strong stream of DI water. Some samples were pretreated for a shorter period and are referred to as "short-pretreated" samples. "Short pretreated Zn" samples used for Raman analysis consisted of immersing Zn samples in the NaCl+NaVO3 solution for 150 min followed by rigorous rinsing, sonication in DI water for 10 minutes, and a final rigorous DI water rinse. Additionally, for comparative purposes and supplementary cathodic potentiodynamic polarization tests, some samples underwent a short pretreatment of 75 minutes in either 0.1 M NaCl (≥99.9%), 0.0025 M NaVO3 (≥98%), or a combination of 0.10 M NaCl + 0.0025 M NaVO3 followed by a rigorous rinse with DI water.
Except as noted immediately above, experiments were conducted in quiescent aqueous solutions of either 0.10 M NaCl or a combination of 0.10 M NaCl and 0.0025 M NaVO3. These concentrations were chosen deliberately to produce solutions that 1) likely contain tetrahedral vanadate species, 2) have similar pH values between vanadate and vanadate-free solutions, and 3) can be compared to prior evaluations.16,20 Solution pH values of both vanadate and vanadate-free solutions were between 6.2 and 6.3. All solution preparation and rinsing of samples and equipment were performed with deionized water (minimum 18.2 MΩ*cm resistivity). All samples were desiccated immediately after polishing and pretreatment, for periods ranging from a minimum of 24 hours to a maximum of 72 hours.
Electrochemical and corrosion characterizations
A potentiostat with a standard 3-electrode set-up was employed in a flat cell for all electrochemical work. An exposed working electrode area of 1.0 cm2, a saturated calomel reference electrode (SCE), and a Pt wire counter electrode were used for all electrochemical experiments (solution surface exposed to air). All reported potential values are relative to an SCE. Potentiodynamic scans were performed using a scan rate of 0.5 mV/s with an initial open circuit potential (OCP) stabilization of 5000 s. Cathodic scans were initiated at 30 mV more positive than the OCP and scanned to –1500 mV below OCP. Anodic scans were initiated at 30 mV more negative than OCP and scanned to 500 mV more positive than OCP. Corrosion potential (Ecorr) values were determined from inspection of the anodic polarization curves and corrosion current density (icorr) values were estimated by Tafel-like extrapolation of the anodic branch of each curve back to Ecorr. At a minimum these values provide a semi-quantitative comparison between different conditions to compliment the qualitative differences that are apparent between the polarization curves. A lack of linearity in the cathodic curves prevented Tafel extrapolation and accurate estimation of corrosion rates. All electrochemical and Raman data were replicated a minimum of three times.
Raman analysis and bright field microscopy
Raman spectra were acquired with 514 nm excitation on a Raman microprobe system with a 50X objective (NA = 0.75), power of ∼12 mW at sample, and an integration time of 10 s. Microscopic images were acquired with the same microscope.
Results and Discussion
Dedicated 12-hour OCP measurements were performed under the three separate conditions indicated above (Zn in NaCl, Zn in NaCl+NaVO3 and pretreated Zn in NaCl) and showed small, but reproducible, differences. All three conditions reached a stable OCP by approximately 5000 s and average OCP values for the three conditions after 5000 s of exposure are shown in Table I. OCP measurements for times from 1.4 h to 12 h showed Zn in NaCl generally to have the most positive OCP value, while Zn in NaCl+NaVO3 was observed to have the most negative OCP value. The pretreated Zn in NaCl was observed to have an intermediate OCP value, albeit very close to that of Zn in NaCl. The OCP measurements were most consistent for the pretreated samples over investigated times and also quite stable during the first 5000 s during which the other two conditions showed considerable fluctuations. Based on these measurements, the presence of or exposure to aqueous NaVO3 was observed to influence OCP values compared to the NaCl control. The negative shift in OCP is reminiscent of negative shifts in OCP values reported when AA2024 is exposed to vanadate solutions,12 but different than that reported on AA7075.16
Table I. Summary of relevant values extracted from anodic and cathodic polarization curves obtained from: (1) Zn in NaCl solution, (2) Zn in NaCl+NaVO3 solution, and (3) "pretreated" Zn in NaCl solution. All values represent the average of at least three replicate measurements and are accompanied by standard deviation values (SD). The OCP values are the average of OCP after 5000 s of exposure to test solutions taken immediately before both the anodic and cathodic tests. Ecorr, icorr, and i at –1000 mVSCE were obtained from the anodic polarization tests, while i at –1125 mVSCE values were obtained from cathodic polarization tests.
| Test Condition | OCP (mVSCE) | SD | Ecorr (mVSCE) | SD | icorr (A/cm2) | SD | i at-1000 mVSCE (A/cm2) | SD | i at-1125 mVSCE (A/cm2) | SD |
|---|---|---|---|---|---|---|---|---|---|---|
| NaCl | –1056 | 17 | –1049 | 11 | 2.5E-05 | 4.7E-06 | 1.2E-04 | 5.2E-05 | -1.7E-05 | 1.1E-06 |
| NaCl + V | –1068 | 12 | –1061 | 12 | 3.9E-07 | 6.5E-08 | 8.4E-06 | 3.2E-06 | -4.6E-06 | 4.3E-06 |
| Pre-treat V + NaCl | –1037 | 12 | –1036 | 14 | 2.8E-07 | 1.1E-07 | 4.7E-06 | 3.3E-06 | -4.4E-06 | 4.4E-06 |
Anodic and cathodic polarization scans were performed under several conditions. A summary of the most relevant results from the anodic and cathodic scans is provided in Table I. Initially, scans were performed on Zn in NaCl, Zn in NaCl+NaVO3 and short pretreated Zn in NaCl. The purpose of pretreatment in NaVO3+NaCl before testing in NaCl was twofold. First, due to the long holding time required for stabilization before actual polarization, the untreated sample scanned in NaCl+NaVO3 was assumed to have an altered surface and, therefore, the scan was not simply that of a Zn surface in the NaCl+NaVO3 solution, but instead a Zn surface with some type of vanadium-containing film; by pretreating a sample in the NaCl+NaVO3 solution for an amount of time similar to the pre-polarization holding time, a surface could be created for testing that would provide a fair comparison accounting for the time of surface evolution during OCP stabilization. Second, it has been found that vanadate provided corrosion inhibition on AA2024 samples while the samples were immersed in aqueous NaVO3, but that the inhibition effect disappeared when the same samples were removed, rinsed and placed in a corrosive environment9,11,13 and it was, therefore, desirable to determine if inhibition was present in the absence of a ready supply of vanadate from an aqueous solution. Interestingly, the short pretreated samples displayed corrosion inhibition greater than that of Zn scanned in NaCl+NaVO3 and, therefore, a longer pretreatment (48 hours) was investigated and proved to be even more beneficial. Anodic and cathodic polarization curves of samples subjected to a longer pretreatment are shown in Figures 1 and 2, respectively. Although there were some slight variations, all of the results shown in Figures 1 and 2 are fair representations of the triplicate results. Both the anodic and cathodic polarization curves display significant corrosion inhibition associated with the presence of vanadate, either in solution and/or on the surface due to pretreatment. Both decreased anodic and cathodic reaction kinetics were observed for samples exposed to vanadates (Table I) which supports mixed inhibition. Although overall mixed inhibition was observed, a small average negative shift in average Ecorr in the NaCl+NaVO3 solution and a small positive shift in average Ecorr for the pretreated specimens combined with decreases in average icorr may indicate a slight tendency toward cathodic and anodic inhibition, respectively.
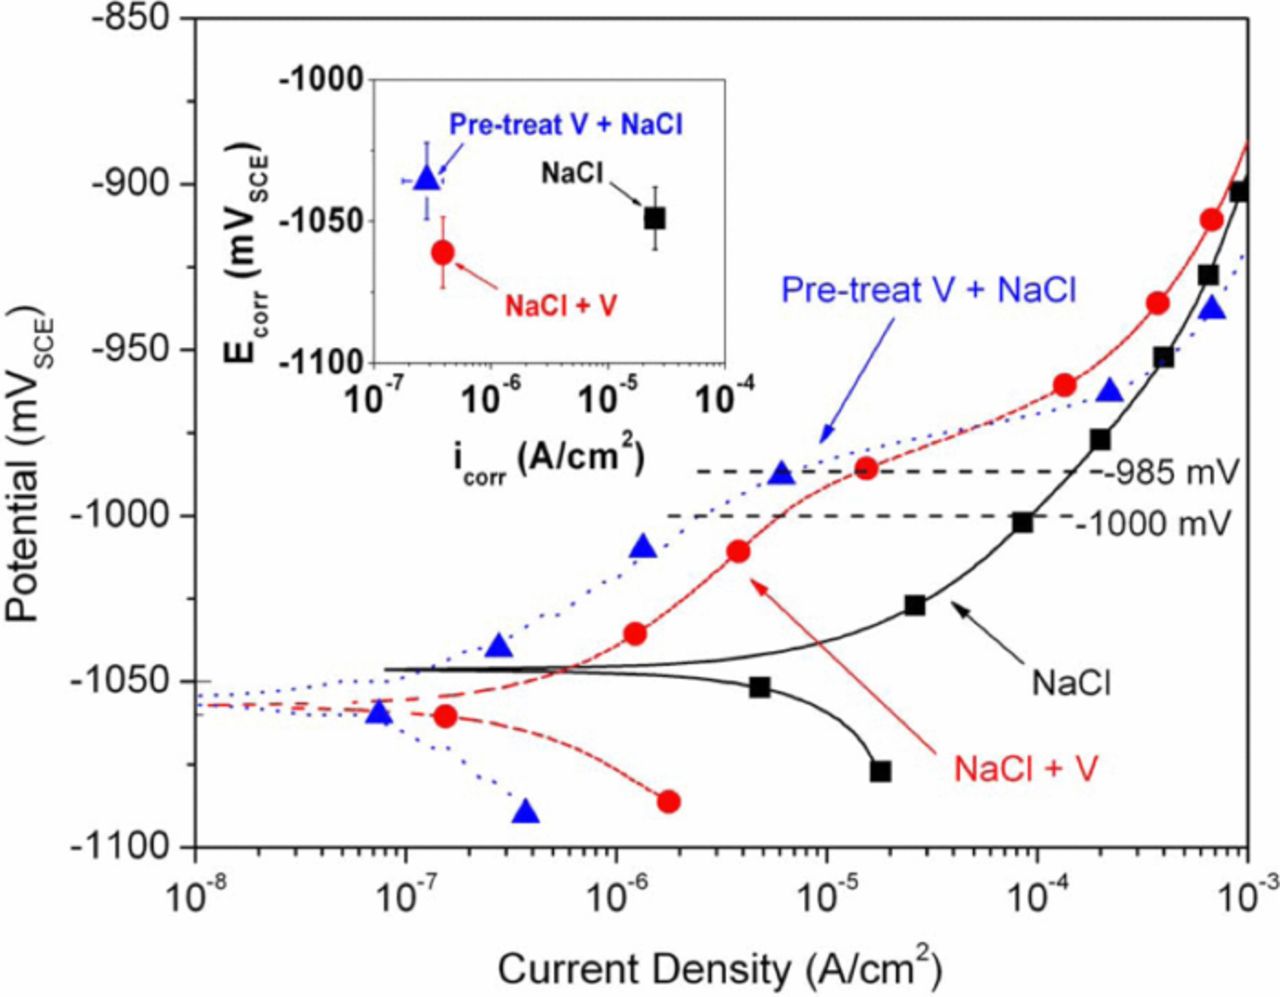
Figure 1. Anodic polarization curves for Zn in NaCl solution, Zn in NaCl+NaVO3 solution, and NaCl+NaVO3 pretreated Zn in NaCl solution. Average icorr and Ecorr values are shown in the inset.
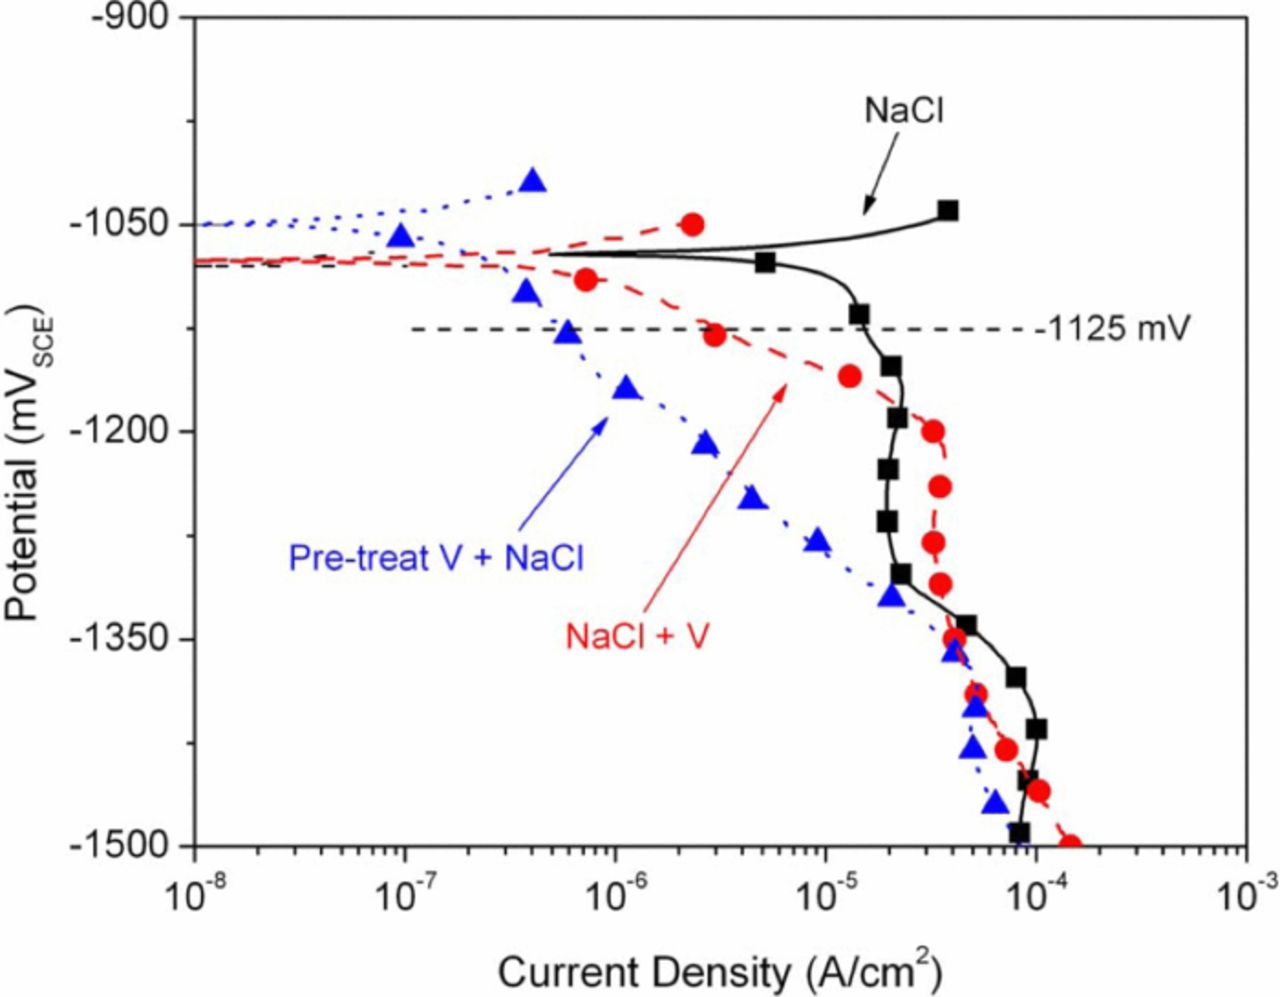
Figure 2. Cathodic polarization curves for Zn in NaCl solution, Zn in NaCl+NaVO3 solution, and NaCl+NaVO3 pretreated Zn in NaCl solution.
Anodic inhibition is shown by a comparison of relative current densities (for a given potential) between different test conditions at potentials positive to Ecorr (Figure 1 and Table I). It is known that Zn does not form a stable oxide/hydroxide film in neutral to slightly basic solutions of chloride concentrations similar to that used for testing in this work.21,22 In general, behavior observed from the control NaCl anodic polarization curves shown in Figure 1 was similar to previously reported results for Zn in KCl electrolytes.23 However, in this study there was a subtle difference between curves obtained from surfaces exposed to vanadate compared to the NaCl control. Namely, in the presence of vanadate, current density for a given potential between Ecorr and approximately –985 mVSCE was suppressed relative to the control. This effect persisted until potentials of approximately –985 mVSCE at which point the current density for vanadate-exposed samples begins to increase rapidly with further anodic polarization until eventually reaching similar current densities as observed from the control sample. It is not clear from the polarization experiments if the observed difference in curves has its origin in the formation or stabilization of a surface film after exposure to vanadates, but if this effect (decreased anodic kinetics) displayed on a Zn surface translates to Zn-rich IMCs in aluminum alloys it may have consequences for understanding decreased corrosion rates as observed on Zn-rich aluminum alloys in vanadate solutions.16
Due to the presence of and subsequent reduction of aqueous vanadate species, the cathodic polarization scans in Figure 2 require a more careful interpretation than the anodic scans. In addition to the reduction of vanadate and dissolved O2, the OCP of Zn in the electrolytes under investigation puts the potential of the surface into the range of H2 evolution due to water reduction. Also, the reduction of various zinc oxides and hydroxides19 has been reported within the range of potentials used for cathodic polarization in this work. The slight negative shift in average Ecorr observed from the cathodic curves on Zn in NaCl+NaVO3 combined with decreased average icorr value relative to controls in NaCl imply cathodic inhibition at OCP. The relative increase in current density observed on Zn in NaCl+NaVO3 in the range from approximately –115 to –130 mVSCE can be most likely attributed to the reduction of aqueous NaVO3. The reduction of tetrahedral vanadate under the basic conditions expected at the electrode surface are complex and still not fully understood, however, it is fair to say that reduction of the tetrahedral species should occur in the cathodic potential range used for these experiments.24,25 It is notable that in all cases the cathodic curves obtained on Zn in NaCl (after a 5000 s OCP stabilization) contained two distinct peaks, a small peak at ∼–1.2 VSCE and a dominant peak at ∼–1.4 VSCE, indicating the presence of two different surface species. Although identification of these species is complex, these presumably arise from the reduction of two distinct Zn2+ surface species.26–28 Identical scans in which the only change was the removal of the 5000 s hold displayed only the peak at ∼–1.4 VSCE. Therefore, it is assumed that the peak at ∼–1.2 VSCE arose from a Zn2+ surface species generated during the holding period. Most notable in the cathodic data is the order of magnitude decrease in current density across a range of potentials observed on the Zn sample that had been pretreated in NaCl+NaVO3, rigorously rinsed and subsequently polarized in the NaCl solution.
Figure 3 shows a similar, though not as substantial, decrease in cathodic current density on the Zn samples pretreated for 75 min in the NaCl+NaVO3 solution followed by polarization testing in the NaCl solution (versus a pretreatment of 48 h as shown in Figure 2). Furthermore, cathodic polarization of samples pretreated in NaCl only and tested in the NaCl solution (Figure 3) displayed no decrease in cathodic current versus non-pretreated Zn tested in the NaCl solution. Samples pretreated in an aqueous vanadate-only solution and then scanned in NaCl solution displayed virtually identical results to samples pretreated in the combined NaCl+NaVO3 solution (Figure 3). These results combined with the above results for the pretreatment in NaCl only, support inhibition due to the presence of vanadate or a vanadate induced film versus the possibility of some type of inhibiting corrosion product film formed over time due to chloride exposure. The cathodic reaction kinetics of Zn in NaCl appear to be dominated by diffusion limited oxygen reduction, in agreement with Yadav et al.;19 for samples exposed to vanadate the rates of oxygen reduction appear to be significantly decreased. However, at potentials more negative than approximately –1.5 VSCE (not shown), when water reduction becomes more prominent, samples exposed to vanadates were observed to sustain higher current densities than the NaCl controls.
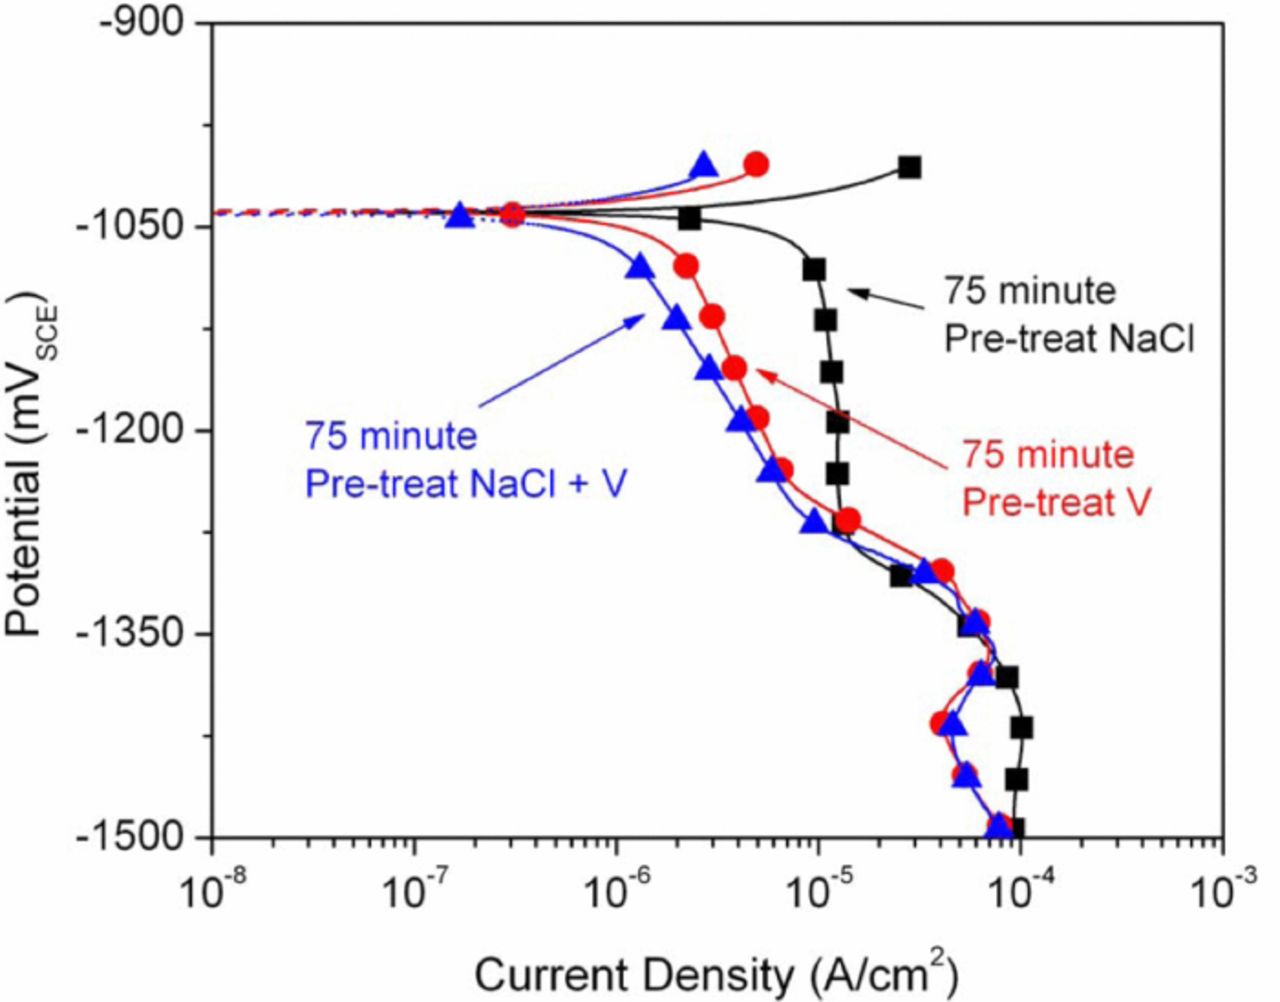
Figure 3. Cathodic polarization curves performed in NaCl for Zn pretreated for 75 min in NaCl, NaVO3, and NaCl+NaVO3.
To gain preliminary insight into the mechanism by which vanadate inhibits corrosion on Zn, exposure experiments were combined with Raman surface analysis under three conditions: (1) Zn immersed in NaCl solution for 48 hours, (2) Zn immersed in NaCl+NaVO3 solution for 48 hours, and (3) "short pretreated Zn" immersed in NaCl solution for 48 hours (Figure 4). In all three cases, after 48 hours of immersion, samples were rigorously rinsed in DI water, sonicated in DI water for 10 minutes, rinsed again in DI water, air dried and desiccated. Visual inspection of the samples immediately after removal from immersion (before rinsing) showed a cloudy film under all conditions. This cloudy film was exceptionally unstable and readily slid off the surface of the Zn immersed in NaCl when the samples were removed from the immersion container. In fact, as noted below, acquisition of a spectrum of this unstable film was achievable only through very delicate handling of additional identical experiments. However, the surface film persisted on Zn immersed in NaCl+NaVO3 and "short pretreated Zn" immersed in NaCl. In both of these latter cases, the film remained through rinsing, sonication and a final rinse. In addition to the cloudy film, the Zn immersed in NaCl+NaVO3 also displayed small red precipitate-like spots, which also persisted through cleaning steps. Figure 4 shows that the three conditions resulted in three distinct surfaces (after rinsing), both visually and spectroscopically. Zn exposed to NaCl (Fig. 4a) displayed Raman peaks at 436 and 554 cm−1, indicating the presence of both crystalline and amorphous ZnO, respectively.29,30 Amorphous ZnO was present to a much lesser degree on both samples that had been exposed to vanadate (Figs. 4c, 4d).
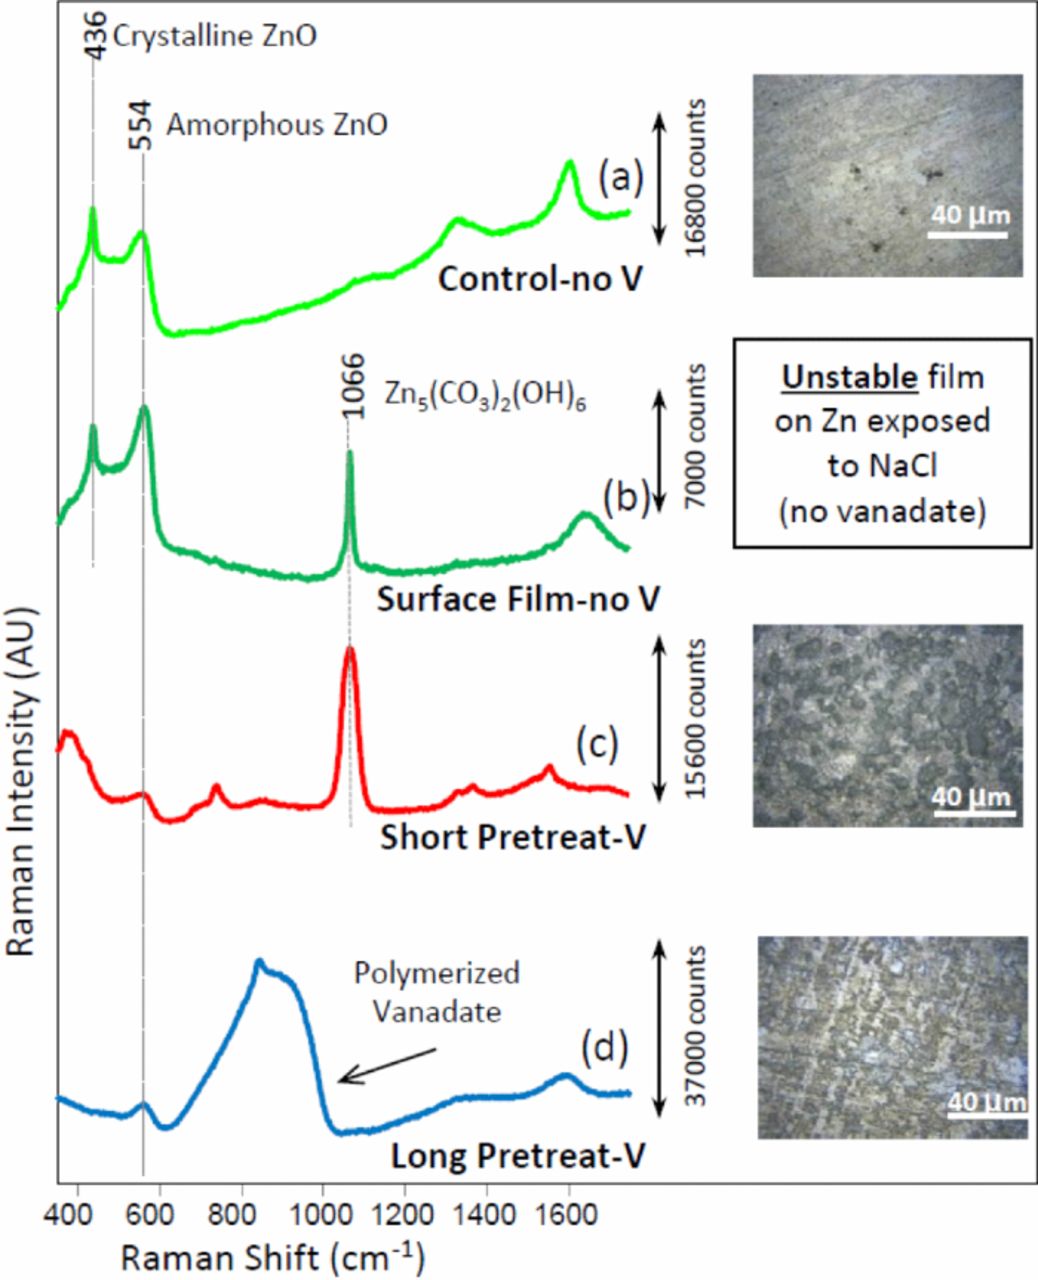
Figure 4. Raman spectra and brightfield microscopic images of samples after 48 hours of exposure: (a) Zn in 0.1 M NaCl, (b) the loose film formed on Zn in 0.1 M NaCl, (c) "Short pretreated" Zn in 0.1 M NaCl, and (d) Zn in 0.1 M NaCl + 2.25 mM NaVO3. (a, c, and d were rigorously rinsed and dried before spectra acquisition).
Of note on the short pretreated Zn sample immersed in NaCl, is the strong peak present at 1066 cm−1 combined with the peak at 740 cm−1, indicating the presence of Zn5(CO3)2(OH)6, hydro-zincite.30–32 As discussed above, all three conditions produced a cloudy film on the Zn surfaces. Although the cloudy film on Zn immersed in the NaCl solution was exceptionally unstable, additional immersion experiments with Zn in the NaCl solution were performed in which Raman analysis of the unstable film produced the spectrum shown in Figure 4b. Spectra of the unstable film were acquired by gently removing the NaCl immersion solution from the Zn sample with a pipette, leaving the unstable film in place. The strong, sharp peak located at 1066 cm−1 (Figure 4b) shows that this unstable film also contained hydrozincite. The stability of the hydrozincite layer on the vanadate short-pretreated Zn (Figure 4c) versus the layer's instability in the absence of vanadate provides possible insight into the mechanism of corrosion inhibition provided by vanadate, as the formation of hydrozincite is known to provide corrosion inhibition on Zn under atmospheric exposure.18,26,33,34 The differences in the spectra of the short pretreated and immersed in NaCl sample versus the sample that was simply immersed in the NaCl+NaVO3 are also of note. The strong, wide band between 650 and 1030 cm−1, present in Figure 4d but absent in Figure 4c, indicates the presence of polymerized vanadate35–37 on the sample immersed in NaCl+NaVO3. Polymerized vanadate and other vanadate species have previously been associated with cathodic inhibition on copper-rich intermetallic particles in Al alloys.13,16 Lastly, it is not possible to determine whether hydrozincite was present on the long pretreated sample (Fig. 4d). The peak at 1066 cm−1 is clearly not present, but could be absent (1) due to the absence of hydrozincite, (2) because the polymerized vanadate film was thick enough to obscure observation of underlying hydrozincite, or (3) because the spectra of the pretreated surfaces all created a strong background baseline, the peak could be obscured by that background. Unfortunately, attempts to identify the red precipitate-like spots present on the Zn surface exposed for 48 hours in the NaCl+NaVO3 solution were unsuccessful.
Summary
- (1)Vanadates were observed to inhibit corrosion of Zn. Exposure to vanadate was observed to shift the OCP of Zn to more negative potentials after times on the order of hours. Polarization experiments indicated an overall mixed anodic and cathodic inhibition with vanadates slowing corrosion rates of Zn by a combination of decreased anodic dissolution and decreased oxygen reduction rates. Inhibition resulted in up to an average two-order magnitude decrease in corrosion current density.
- (2)Solution exposure of Zn in dilute vanadate solutions likely results in the formation of a polymerized vanadate film, while short pretreatment of Zn surfaces with vanadates appears to stabilize the natural Zn5(CO3)2(OH)6 formed when Zn comes in contact with NaCl electrolytes. The formation of a polymerized vanadate film and / or stabilization of a Zn5(CO3)2(OH)6 film is likely a critical factor in slowing both cathodic reduction kinetics as well as decreasing the anodic dissolution of Zn in 0.1 M NaCl.
- (3)Both the polymerized vanadate and the stabilized Zn5(CO3)2(OH)6 surface films showed evidence of slowing anodic dissolution kinetics through relative decreases in current density. This effect persisted from potentials slightly more positive than Ecorr to potentials approximately 100 mV more positive than Ecorr. Additionally, the films appear to play a role in decreased oxygen reduction rates as observed on surfaces exposed to vanadates.
Acknowledgments
The authors thank Dr. Sebastian Thomas (Monash University) for technical discussions. Purchase of the Raman microprobe was supported by the National Science Foundation under grant No. 0639163. Financial support by the Ohio State University Libraries for portions of this work is gratefully acknowledged.