Abstract
The aim of this study is to provide a better understanding of performance degrading mechanisms occurring when a proton exchange membrane water electrolyzer (PEM-WE) is coupled with renewable energies, where times of operation and idle periods alternate. An accelerated stress test (AST) is proposed, mimicking a fluctuating power supply by operating the electrolyzer cell between high (3 A cm−2geo) and low current densities (0.1 A cm−2geo), alternating with idle periods during which no current is supplied and the cell rests at open circuit voltage (OCV). Polarization curves, periodically recorded during the OCV-AST, reveal an initial increase in activity (≈50 mV after 10 cycles) followed by a significant decrease in performance during prolonged OCV cycling due to an increasing high frequency resistance (HFR) (≈1.6-fold after 718 cycles). These performance changes can clearly be related to the OCV periods, since they are not observed in a reference experiment where the OCV period is replaced by a potential hold at 1.3 V. The origin of the phenomena, which are responsible for the initial performance gain as well as the subsequent decay are analyzed via detailed electrochemical and physical characterization of the MEAs, and an operating strategy to prevent performance degradation is proposed.
Export citation and abstract BibTeX RIS

This is an open access article distributed under the terms of the Creative Commons Attribution 4.0 License (CC BY, http://creativecommons.org/licenses/by/4.0/), which permits unrestricted reuse of the work in any medium, provided the original work is properly cited.
In light of the fact that the energy demand is ever-increasing and that renewable energy sources, inherently intermittent in energy output, are becoming more and more important, an efficient way of storing energy is of crucial importance. One prominent example for an energy carrier meeting these requirements is gaseous hydrogen, produced in a polymer electrolyte membrane water electrolyzer (PEM-WE) via electrochemical water splitting.1,2 The reliability of a PEM-WE has already been reported for ≈60,000 h of operation, showing only a marginal loss in performance.3–4 In an ideal scenario, PEM-WE systems would be coupled with renewable energy sources in order to fully utilize their output by converting temporary excess energy into H2.5 This dynamic mode of operation involves frequent load changes and idle periods during which no current is supplied.2,6–8 While it is well known that alkaline water electrolyzers must be operated with a so-called protective current in stand-by/idle conditions (i.e., when no power is provided by renewable energy sources) in order to avoid a substantial performance degradation,4,7,9–10 very little is known about the gravity of this effect in PEM-WEs, even though it will be an important consideration for coupling PEM-WEs with renewable energy sources.6,11 In this paper, we will try to further investigate this phenomenon, but first will briefly review the most common failure mechanisms of PEM-WEs.
A commonly observed failure of PEM-WEs has been related to the chemical degradation of the perfluorosulfonic acid (PFSA) based polymer electrolyte membrane, often observed as thinning of the membrane or as localized pinholes in the membrane. The concomitant increase in gas permeation ultimately leads to an unacceptably large, safety-critical H2 concentration in the O2 anode compartment, as the H2 oxidation activity of iridium based anode catalysts is very poor (contrary to the O2 reduction activity in the H2 anode). This is described in an early study by Stucki et al., who showed that the failure of a dynamically operated 100 kW PEM-WE plant after only ≈15,000 h was mostly related to thinning of the PFSA membrane, caused by chemical degradation.12 Here, however, it should be noted that the chemical durability of today's PFSA membranes is dramatically better owing to stabilization of the polymer endgroups,13 so that membrane thinning is likely less of an issue when using state-of-the-art PFSA membranes.14 Another membrane related degradation effect is the contamination of the ionomeric membrane with cations,11,15–16 typically introduced by improperly treated feed-water which is the major cause for PEM-WE failures in the field,16–17 Sun et al. showed the operation of a 9-cell PEM-WE stack for 7800 h at constant current, and recorded a gradual decrease in performance that they attributed to cationic contamination, since the initial performance was mostly recovered by boiling the degraded MEA (membrane-electrode-assembly) in sulfuric acid.18
Apart from degradation of the membrane in the membrane-electrode-assembly via chemical degradation and cationic contamination, gradual passivation of the titanium porous transport layer (PTL) at the high potentials experienced by the anode electrode of an electrolyzer increases the internal ohmic resistance and, hence, leads to a decrease of performance. This was demonstrated by Rakousky et al. after operation at 2 A cm−2geo for 1000 h, where the high-frequency resistance (HFR) increased by 26 mΩ cm²geo (≈20%) due to passivation of the Ti-PTL.19 In addition, the authors observed a reduction of the anodic exchange current density, which they attribute to a contamination with titanium from either the anode catalyst itself (iridium oxide coated onto a titanium oxide support) or the anodic Ti-PTL.
With regards to the effect of dynamic PEM-WE operation, Rakousky et al. investigated the influence of different load profiles over 1000 h, namely constant current of 1 or 2 A cm−2geo, cycling between 1 and 2 A cm−2geo, or cycling between open-circuit voltage (OCV) and 2 A cm−2 geo.20 At a constant current of 2 A cm−2geo the authors observed an untypically high degradation rate (≈200 μV h−1) compared to that at a constant current of 1 A cm−2geo (<1 μV h−1). When cycling between 1 and 2 A cm−2geo or between OCV and 2 A cm−2geo, the degradation rate was substantially lower than that at a constant current of 2 A cm−2geo, which the authors claim to be due to a not clearly defined reversible degradation effect.20 Interestingly, comparing the degradation rates when cycling between OCV and 2 A cm−2geo at different interval times (10 min vs. 6 h per step), the degradation rate increased with the number of OCV periods over the 1000 h of test (≈16 μV h−1 for ≈80 OCV periods vs. ≈50 μV h−1 for ≈3000 OCV periods over 1000 h). While the authors suggested that this might be due to cathode catalyst degradation, our data presented below would suggest that it is related to the degradation of the anode catalyst.
To date, a detailed understanding of performance degrading phenomena associated with discontinuous operation, particularly with intermittent OCV periods, has not been established. In this work, we propose a dynamic accelerated stress test (AST) procedure, mimicking the variable power supply of renewable energy sources, where operation at low and high current densities (0.1 and 3 A cm−2geo, respectively) alternate with idle periods, during which no current is supplied and the electrolyzer cell rests at the open circuit voltage. This test will be complemented by an experiment during which the cell voltage is not varying freely during the OCV periods but instead is potentiostated at 1.3 V, where the current density is on the order of 1 mA cm−2geo (i.e, significantly smaller than the 100 mA cm−2geo). We will show that cycling into OCV leads to a significant performance loss, particularly at high current densities, compared to 1.3 V holds. The origin of this phenomenon will be examined via detailed electrochemical and physical characterization of the MEA before, during, and after the respective cycling test.
Experimental
Membrane electrode assembly (MEA) preparation and cell assembly
MEAs with an active area of 5 cm² were prepared via the decal transfer method, where platinum supported on Vulcan XC72 carbon (45.8 wt.-% Pt/C, TEC10V50E from Tanaka, Japan) served as catalyst for the hydrogen evolution reaction (HER) at the cathode electrode and IrO2 supported on TiO2 (IrO2/TiO2 with 75 wt.-% iridium, Elyst Ir75 0480 from Umicore, Germany) as catalyst for the oxygen evolution reaction (OER) at the anode electrode. De-ionized (DI) water (18 MΩ cm), 2-Propanol (purity ≥99.9% from Sigma Aldrich), and Nafion ionomer solution (20 wt.-% ionomer, D2021 from IonPower, USA) were used as solvents for the catalyst ink. The suspension was mixed for 24 h using a roller mill, where ZrO2 grinding balls (5 mm diameter) were added to achieve a homogenous suspension. The ink was coated onto a thin decal transfer substrate (PTFE, 50 μm thick, from Angst+Pfister, Germany) using the Mayer rod technique. Subsequently, 5 cm² decals were punched from the coating after drying and then hot-pressed onto a Nafion 212 membrane (50 μm thick, from Quintech, Germany) at 155°C for 3 minutes at a pressure of 2.5 MPa. By weighing the decals before and after hot-pressing, the actual weight of the electrodes was determined. Throughout the study, the loading was kept constant at 0.2 ± 0.1 mgPt cm−²geo for the hydrogen cathode and 1.75 ± 0.15 mgIr cm−²geo for the oxygen anode.
At the anode, sintered titanium (from Mott Corporation, USA) with a porosity of ≈50%, a thickness of 280 ± 10 μm and a pore size of 10–50 μm (determined by SEM) was used as a porous transport layer (PTL), whereas a carbon fiber paper (TGP-H 120T from Toray, no MPL, 20 wt.-% PTFE) with a thickness of 370 ± 10 μm and pore sizes of 20–50 μm21 was used on the cathode. The MEA and PTLs were placed between the flow-fields of the electrolyzer cell and sealed with virgin PTFE gaskets. By choosing the right thickness of the gaskets, a compression of the carbon PTL by 25% was set, corresponding to a compressive contact pressure of ≈1.7 MPa at the MEA. Specific details about the cell hardware are reported elsewhere.22
Physical characterization
After the electrochemical characterization and testing, a small piece of each MEA was embedded into room-temperature curing epoxy for scanning electron microscopy (SEM). Using SiC paper, the sample surface was polished in two steps (grade P320 and P1200) and afterwards polished using a 9 μm diamond polishing agent (from Buehler, USA). The cross-sectional lamellae of the pristine and operated samples were prepared by focused ion beam milling (FIB, Zeiss NVision 40). Due to the porosity of the catalyst layer and the sensitive nature of the polymeric membrane, the area thinned for TEM analysis was kept to a minimum to keep the lamellae intact. The scanning transmission electron microscopy (STEM) was performed with a spherical aberration corrected TEM (ThermoScientific Titan Themis 60-300) equipped with a high brightness gun source operated at 200 kV. The current was kept low to avoid possible electron beam induced damage which would cause collapse of the polymeric film. High-angle annular dark field-STEM (HAADF-STEM) images of the interface between the IrO2/TiO2 anode catalyst layer and the Nafion membrane were acquired by collecting incoherently scattered electrons. Energy dispersive spectroscopy (STEM-EDS) elemental maps of iridium and oxygen were obtained by collecting characteristic X-ray signals via four silicon drift detectors located in close proximity to the sample at the TEM column.
Contact resistance measurement
Contact resistance measurements were carried out with the test setup described by Bernt et al.22 PTLs, along with an insulating Kapton foil (25 μm) to ensure that the resistance is only measured along the PTL were sandwiched between two titanium flow-fields which, in turn, were sandwiched between and two copper plates. A pressure of ≈1.7 MPa was applied to this stack in order to simulate the contact pressure in the cell. By applying different currents via the copper plates and measuring the associated voltage drops across the flow-fields, the electronic resistance (essentially equating to the contact resistance) was quantified.
Electronic resistance measurement of the anode electrode
Electronic conductivities of the IrO2/TiO2 anode catalyst layers in the size of 5 cm²geo were determined by 4-point-probe in-plane conductivity measurements (Lucas/Signatone, pin distance 1 mm) on the electrode coated onto the membrane by applying different potentials between 0.1–0.5 V and recording the corresponding current.
Electrochemical characterization
All electrochemical measurements of the MEAs were performed on an automated test station from Greenlight Innovation, using a potentiostat equipped with a current booster (BioLogic VSP 300). The anode was supplied with 5 mLH2O min−1 deionized (DI) water, which was pre-heated to 80°C. During the measurements, the cell temperature was kept constant at 80°C, and the product gas exiting from the anode side was diluted with nitrogen (200 nccm) to avoid the formation of an explosive gas mixture due to hydrogen permeation through the membrane into the anode compartment. During warm-up, the cathode is flushed with N2 for 300 s while 5 mLH2O min−1 are constantly supplied to the anode side. After reaching the desired cell temperature of 80°C, the cell was conditioned at 1 A cm−2geo for 30 min. Subsequently, polarization curves were taken at ambient pressure (1 bara) and 10 bara, stepwise increasing the current density from 0.01 to 4 A cm−2geo and holding at each current for 5 min to ensure a stable cell voltage reading. Finally, the last 10 s of the cell voltage at each current density were averaged. Considering the first two polarization curves as part of the conditioning, they were not included in the analysis. For the load-cycling procedure, the flow of H2O through the anode compartment and the cell temperature were kept constant also during the open-circuit voltage (OCV) or the 1.3 V-hold periods.
Additionally, AC impedance measurements were performed at the end of each current density step in a range from 100 kHz to 1 Hz, adjusting the amplitude of the current perturbation such that it was always <20% of the applied current, except for the smallest current density of 10 mA cm−2geo where it was 40%. The high-frequency resistance (HFR) was determined from the high-frequency intercept with the real axis in a Nyquist plot. At the beginning-of-test (BoT) as well as during the test and at the end-of-test (EoT), cyclic voltammograms (CVs) of the anode electrode were recorded. For this, the test procedure was stopped either after the open-circuit voltage or the 1.3 V-hold period, and the cathode counter electrode was flushed with dry H2 at 50 nccm at ambient pressure to ensure a stable reference potential, while the anode electrode was continuously fed with 5 mLH2O min−1 deionized water. The CVs were recorded in a potential range of 0.05 V–1.3 V at 50 mV s−1 at 80°C; showing the steady-state CVs (2nd one recorded).
Results and Discussion
Degradation test protocols
In this section, we propose a test protocol to mimic transient operation of a PEM-WE. First a high (3 A cm−2geo) and then a low (0.1 A cm−2geo) current density are drawn from the cell, followed by a current interrupt during which the cell is left to rest at the OCV, simulating shut-off periods of a PEM-WE operated with intermittent renewable energy (denoted as "OCV-AST"). The duration of each interval was ≈10 min, and one cycle refers to the two current steps and the OCV period (black solid line in Figure 1a). In a second experiment, referred to as "reference test", the OCV period at the end of each cycle was replaced by a potential hold at 1.3 V (blue dotted line in Figure 1a). During the entire operation (i.e., including the shut-off periods), the temperature was held at 80°C and 5 mL min−1 DI water was continuously fed into the anode compartment of the cell. During the OCV or 1.3 V-hold phase, the cathode pressure decreased by ≈1 bara (i.e., from 10 bara to ≈9 bara) due to H2 permeating through the membrane into the anode compartment (the H2 partial pressure normalized permeation rate through a ≈175 μm thick Nafion 117 membrane in a PEM-WE at 80°C between 10 and 30 bara cathode pressure was found to be ≈0.24 mA cm−2geo bara(H2)−1,23 which if scaled to a ≈50 μm thick Nafion 212 membrane equates to ≈0.85 mA cm−2geo bara(H2)−1 or ≈5.9⋅10−3 cms(H2)3 cm−2 bara(H2)−1 min−1 (with cms3 referenced to 1.103 bara and 25°C)).

Figure 1. Test protocol for the accelerated stress test (AST) to mimic an intermittent power supply of a PEM-WE with periods of low and high current density followed by OCV ("OCV-AST", black solid lines) and of a reference test avoiding OCV ("reference test", blue dotted lines) by holding the potential at 1.3 V instead of OCV. a) Current profiles during the first cycle of the OCV-test; b) associated potential profiles recorded at 80°C with pcathode = 10 bara and panode = 1 bara, while feeding 5 mL H2O min−1 into the anode compartment. MEA specification: 5 cm2 active-area with ≈1.75 mgIr cm−²geo anode and ≈0.2 mgPt cm−²geo cathode loading using a Nafion 212 (≈50 μm thick) membrane.
Voltage and current response during the OCV-AST and the reference test
Figure 1b shows the cell voltage recorded during the different operation intervals in Figure 1a. During operation at constant current, the cell voltage remains essentially constant. Upon current interruption in the OCV-AST (black line), the potential drops immediately to ≈1.2 V, i.e., to the approximate thermodynamic cell voltage for water electrolysis at 80°C. This is followed by a gradual decrease of the potential to ≈0.8 V, caused by the gradual enrichment of H2 in the anode compartment by permeation from the cathode compartment that is held at 10 bara (i.e., at a H2 partial pressure of 9.5 bara), resulting in a H2 permeation flux of ≈5.6⋅10−2 cms(H2)3 cm−2 min−1 (from the above quoted permeation rate). In this H2-rich gas-phase at 80°C, the surface of the crystalline IrO2 on the TiO2 support undergoes a gradual partial reduction to a surface which is catalytically active for the hydrogen oxidation reaction (HOR).24 Once its HOR activity is high enough (apparently at ≈0.8 V), the equilibrium potential for the HOR at ≈0 V is being established very quickly (in less than 0.5 min), resulting in a drop of the cell voltage of the electrolyzer to ≈0 V vs. the reversible hydrogen electrode (RHE) potential (note that the platinum catalyzed cathode is still under a high H2 pressure, so that the ≈0 V cell voltage are clearly due to a drop of the anode potential to ≈0 V vs. RHE). When holding the cell voltage at 1.3 V instead in case of the reference test, the reduction of the IrO2 catalyst will be prevented (as will be proven later), however at the cost of applying a small bias current, as will be discussed in the last section of this work.
The evolution of the cell voltage as a function of the number of current/OCV cycles of the OCV-AST is shown in Figure 2. The cell voltage at both current densities initially decreases by ≈50 mV (inset of Figure 2) and above 10 cycles gradually increases, particularly at high current density. Since the HFR-corrected cell voltage also decreases during the first 10 cycles (cf. hollow blue and black symbols in Figure 2), the initially decreasing cell voltage must be due to an increase of the OER activity of the anode catalyst (note that the cathode overpotential would be <10 mV even if the loading of the Pt cathode catalyst would be reduced by an order of magnitude from the value of 0.2 mgPt cm−²geo used in this work).25 As was shown previously24 and as will be further discussed below, this is indeed due to an increase in the OER activity of the IrO2 based anode catalyst after extended exposure to H2 during the OCV periods. The increase in cell voltage starting after 10 cycles is largely caused by an increase in the HFR, reflected by the fact that the HFR-corrected cell voltage at 3 A cm−2geo rises much less significantly than the cell voltage. The nevertheless noticeable increase of the HFR-corrected cell voltage upon extended cycling suggests the growth of a more complex mass transport resistance.
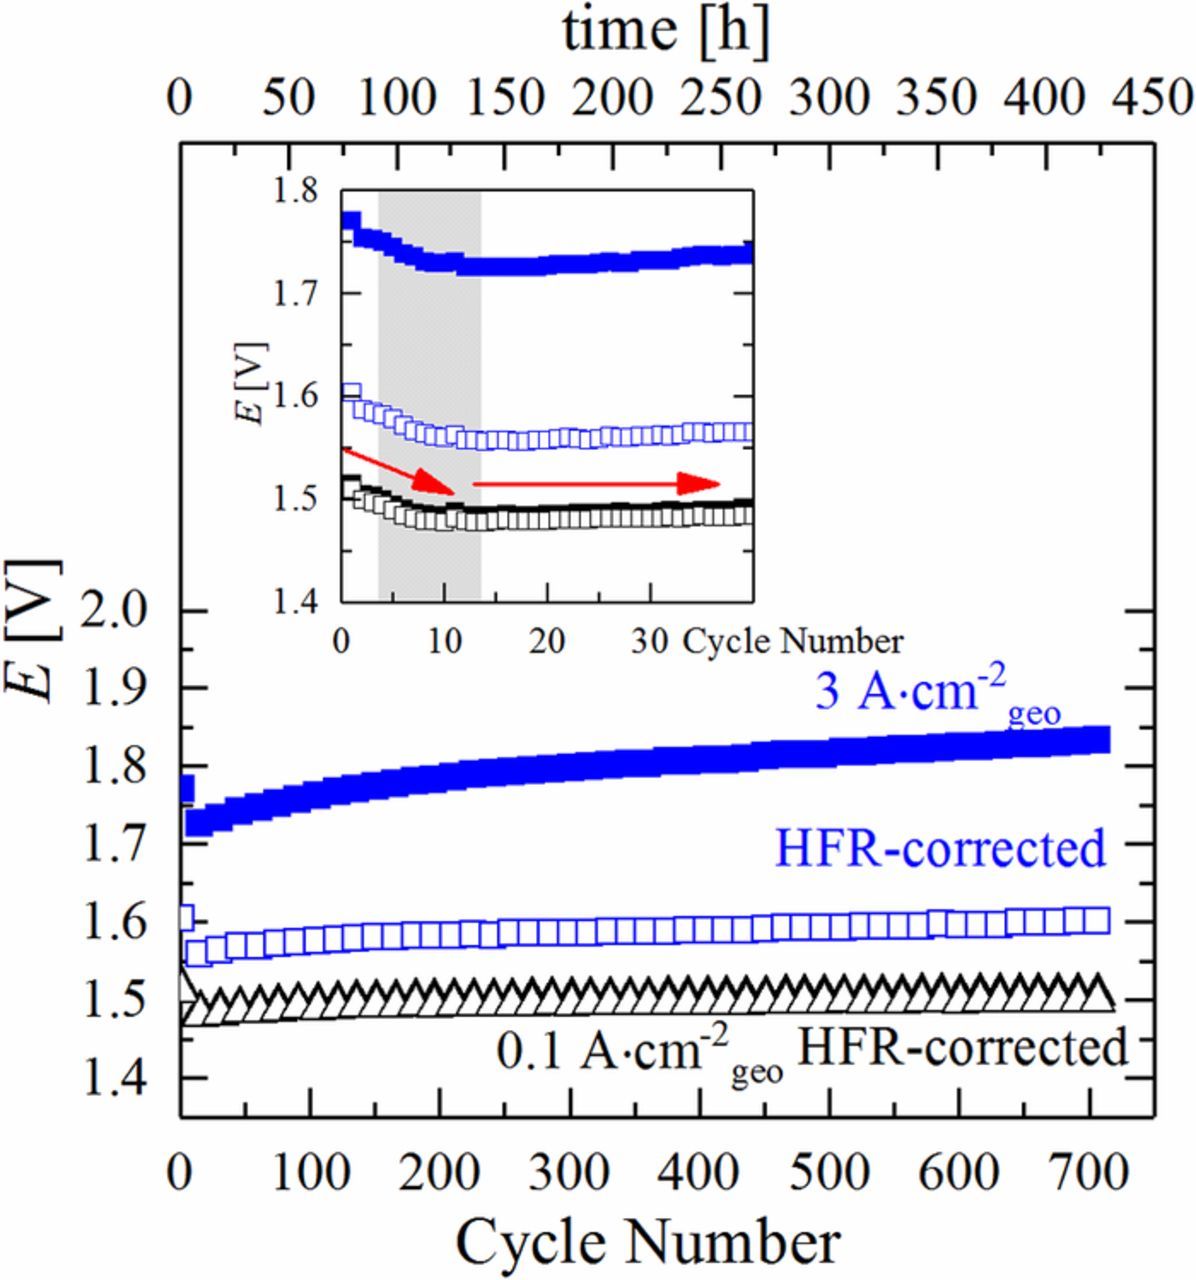
Figure 2. Evolution of the cell voltage and the HFR-corrected cell voltage at 0.1 A cm−2geo and 3 A cm−2geo during the OCV-AST at 80°C, cycling the cell according to the protocol shown in Figure 1 (black solid line) with pcathode = 10 bara and panode = 1 bara, while feeding 5 mL H2O min−1 into the anode compartment (same MEA specifications as in Figure 1). For better legibility, only every 15th point was plotted; the inset is a zoomed view of the initial 40 cycles including all data points.
In the reference test, the potentiostatic control at 1.3 V during the shut-down period results in a constant cell as well as HFR-corrected potential at both currents over the entire cycling test (Figure 3). Interestingly, the substantial performance improvement observed over the first 10 cycles cannot be observed here, particularly not for the HFR-corrected data, as can be seen in the inset of Figure 3 (<10 mV vs. ≈50 mV in Figure 2). This suggests that the (partial) reduction of the anode catalyst does not occur at ≥1.3 V. The comparison of both experiments proves that the performance degradation during the first experiment (Figure 2) is directly related to the OCV period at the end of each cycle, during which H2 accumulates in the anode compartment and lowers the potential of the anode catalyst to ≈0 V vs. RHE (Figure 1b, blue dotted line). It further proves that the degradation observed during the OCV-AST (Figure 2) is not caused by experimental artefacts (e.g., ionic contamination of the feed-water). Apparently, avoiding temporary potential excursions of the anode catalyst to below 1.3 V during intermittent shut-down mitigates parasitic processes that lead to an increasing cell voltage, which, to a large extent but not completely, can be attributed to an increase in HFR. The current/power required to hold the potential at 1.3 V during shut-down periods will be discussed in the last section of this work.

Figure 3. Evolution of the cell voltage and the HFR-free cell voltage at 0.1 A cm−2geo and 3 A cm−2geo during the reference test at 80°C with OCV periods replaced by 1.3 V-holds, cycling the cell according to the protocol shown in Figure 1 (blue dotted line) with pcathode = 10 bara and panode = 1 bara, while feeding 5 mLH2O min−1 into the anode compartment (same MEA specifications as in Figure 1). For better legibility, only every 10th point was plotted; the inset is a zoomed view of the initial 40 cycles including all data points.
In order to gain further insights into the observed performance decay during the OCV-AST, we examine polarization curves recorded at various stages of the OCV-AST and the reference test. Figure 4 shows ambient pressure polarization curves and the corresponding HFR values recorded over the course of the OCV-AST, namely at the beginning-of-test (BoT, green squares) and after 10 (blue circles), 200 (orange triangles), and 718 cycles (end-of-test or EoT; red diamonds). It is remarkable that the performance increases by ≈45 mV over the entire current density range after ten cycles (blue circles) compared to BoT (green squares), which can only be rationalized by an improved OER activity of the anode catalyst. However, upon further cycling, the ambient pressure cell voltage at each current density increases continuously, consistent with the results presented above under differential pressure conditions (pcathode/panode = 10/1 bara, see Figure 2). This increase in cell voltage is accompanied by a substantial increase of the HFR (Figure 4b) by a factor of ≈1.3 after 200 cycles (≈71 mΩ cm²geo) and by a factor of ≈1.6 after 718 cycles (≈88 mΩ cm²geo) compared to its BoT value (≈56 mΩ cm²geo). Since the HFR represents the sum of the membrane ionic resistance and the electronic contact resistances at the PTL/electrode and PTL/flow field interface, one (or all) of these terms must be responsible for the performance degradation. A large fraction of the performance decrease between 10 cycles (blue circles) and EoT (read diamonds) can be ascribed to this dramatically increasing HFR, as indicated by the much smaller increase of the HFR-corrected voltage (open symbols in Figure 4a). However, the HFR increase alone cannot explain all of the performance losses over extended cycling, as the HFR-corrected voltage at each current density still increases between 10 cycles and EoT.

Figure 4. Ambient pressure PEM-WE performance data at 80°C recorded during the OCV-AST shown in Figure 2 a) Ecell vs. i performance (filled symbols) and HFR-free performance data (hollow symbols) with a cathode water-feed of 5 mLH2O min−1; b) corresponding HFR values. The polarization curve and the HFR after 200 OCV-AST cycles for an independent repeated experiment are marked by the yellow lines.
This analysis of the OCV-AST will be compared next to that of the reference test where OCV periods are replaced by 1.3 V-hold periods (Figure 5). Quite astoundingly, the cell voltage up to 4 A cm−2geo even slightly improves over 500 cycles (Figure 5a), which is related to the slightly decreasing HFR (Figure 5b), from ≈ 54 mΩ cm²geo initially (green squares) to ≈ 50 mΩ cm²geo after 500 cycles (red diamonds). The perfectly unchanged HFR-corrected cell voltage over 500 cycles signifies that the OER catalyst activity must remain unaltered. Considering the observations and conclusions from the polarization curves along with the development of the cell voltage over extended cycling, it is evident that the initial performance improvement observed after 10 cycles in the OCV-AST is not observed in the reference experiment, so that it must be linked directly to a change of the OER catalyst during the OCV periods. Quite clearly, the rather substantial performance degradation during OCV can be effectively prevented if the cell potential remains always at or above 1.3 V.
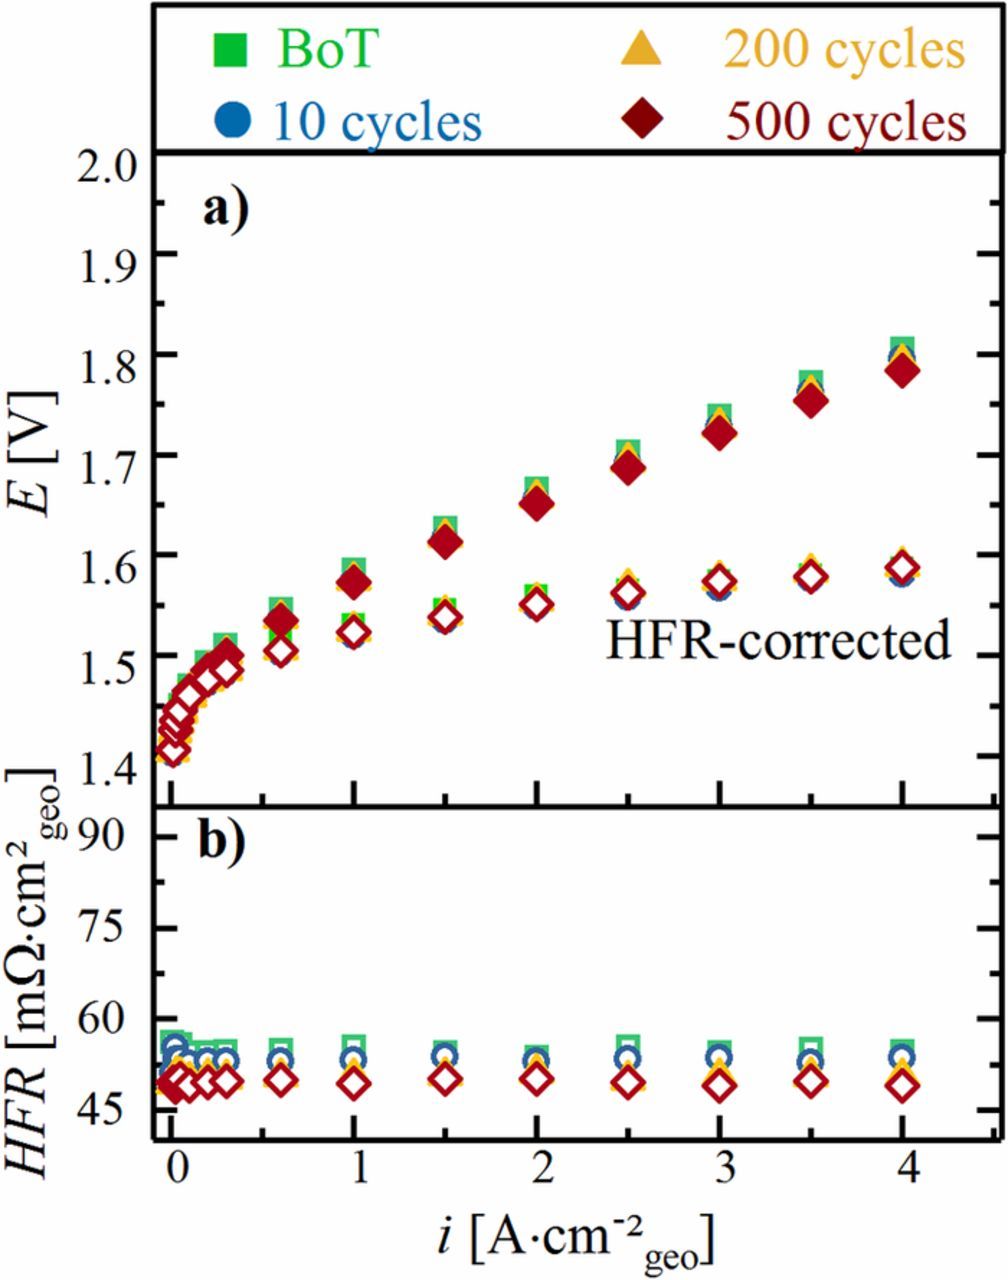
Figure 5. Ambient pressure PEM-WE performance data at 80°C recorded during the reference test shown in Figure 3. a) Ecell vs. i performance (filled symbols) and HFR-free performance data (hollow symbols) with a cathode water-feed of 5 mLH2O min−1; b) corresponding HFR values.
Analysis of the effect of OCV periods on the OER catalyst
This section will provide a detailed insight into the performance increase observed during the first ten cycles of the OCV-AST by taking a closer look at the OER kinetics. The Tafel slope, determined from the linear region (i.e., between 0.01 A cm−2geo and 0.1 A cm−2geo) of the ambient pressure HFR-corrected polarization curves recorded over the course of the OCV-AST (Figure 6a), decreases from 60 mV dec−1 to 47 mV dec−1 after the initial 10 cycles, clearly evidencing a change in the OER kinetics. Over further cycling, the Tafel slope increases slightly by ≈3 mV dec−1 (50 mV dec−1 after 200 cycles) and then stays constant until EoT (50 mV dec−1 after 718 cycles). As one would expect, the initial Tafel slope obtained in the reference test is essentially identical with the initial value of the OCV-AST experiment (59 vs. 60 mV dec−1). However, contrary to the OCV-AST, it remained essentially constant, with a value of ≈56 mV dec−1 (Figure 6b). This suggests that neither the iridium oxide surface nor the OER reaction mechanism seem to be affected during the reference experiment, while the substantial decrease of the Tafel slope in the first 10 cycles of the OCV-AST clearly suggests a change in the iridium oxide surface chemistry, induced by the OCV periods. In previous studies, we had observed a similar decrease of the Tafel slope upon in-situ reduction of the same IrO2 catalyst under H2 at 80°C for 15 h, accompanied by a ≈40 mV increase in OER activity and by the appearance of hydrogen underpotential deposition (H-UPD) features in the CV of the H2-exposed iridium oxide catalyst.24 This was rationalized by the fact that thermally prepared, highly crystalline IrO2 exhibits very different CV features than that of hydrous iridium oxide or metallic iridium.26 Therefore, since the voltammetric response of the iridium oxide catalyst can provide valuable insights into the surface chemistry of the anode catalyst, we recorded the CVs of the anode catalyst before and during the OCV-AST and the reference test.

Figure 6. Tafel plots of EHFR-free vs. i at ambient pressure and 80°C, obtained over the course of the cycling tests: a) for the OCV-AST (data from Figure 4); b) for the reference test where the OCV period was replaced by a potential hold at 1.3 V (data from Figure 5). Tafel slopes were determined between 0.01 A cm−2geo and 0.1 A cm−2geo (gray shaded region), and the values are given in the legend heading each of the two Tafel plots.
The BoT CV of the TiO2 supported IrO2 anode catalyst shows only capacitive currents but no well-defined features (region (1) & (2), green line Figure 7), which is characteristic of thermally treated, crystalline IrO2, and suggests that the surface of the iridium oxide corresponds to that of crystalline IrO2 rather than amorphous iridium oxide.26,27 However, the CV changes significantly after the first 10 OCV periods of the OCV-AST (blue line): i) the capacitive currents are ≈2 times higher than at the beginning of test; ii) distinct H-UPD features can be observed at low potentials, characteristic of metallic iridium26,28,29 (see region (1) in Figure 7); and, iii) the redox features observed in region (2) can be attributed to the transition between Ir(III)/Ir(IV).26 The same change in CV features was reported for the same catalyst upon its exposure to pure H2 at 80 C for 15 h.24 Thus, this suggests a gradual reduction of the crystalline IrO2 catalyst surface into a hydrous iridium oxide during the OCV-AST (i.e., during repeated polarization of the anode catalyst to ≈0 V vs. RHE), consistent with the latter's higher OER activity,24,30–32 as demonstrated in Figure 6a. Quite clearly, since thermally prepared, crystalline IrO2 is not stable below ≤0.8 V,24,33 its surface is reduced to metallic iridium, which will be oxidized upon extended cycling to high potentials during the OCV-AST (i.e, up to an anode potential of ≈1.6 V vs. RHE, as indicated by the HFR-corrected voltage at 3 A cm−2geo in Figure 2), forming hydrous iridium oxide.34 The fact that these hydrous iridium oxide features are still present in the CVs recorded after 200 and 718 cycles (Figure 7, yellow and red lines) indicates an irreversible change of the iridium hydration state at the anode electrode surface with respect to that at the beginning of test, because it appears impossible to electrochemically form crystalline IrO2. Instead, the surface remains a hydrous iridium oxide (no significant changes from 200 to 718 cycles). However, the well-defined H-UPD features present after the 10th cycle disappear over the course of extended cycling, showing that the initially formed metallic iridium is indeed converted into hydrous iridium oxide.34 Since the electronic conductivity of hydrous iridium oxide is reported to be lower than that of crystalline IrO2,30 and since the long-time stability of hydrous iridium oxide in a PEM-WE is reported to be inferior to that of crystalline IrO2,31 the transformation of the initially crystalline IrO2 into hydrous iridium oxide may be the cause for the large degradation over the course of the OCV-AST (Figure 2) and thus would have important consequences for the operational requirements for a PEM-WE.

Figure 7. Cyclic voltammograms (CVs) recorded after different numbers of cycles of the OCV-AST (see Figure 2), recorded at 50 mV/s, 80°C, ambient pressure, and 5 mLH2O min−1 (anode)/ 50 nccm H2 (cathode).
If our hypothesis was true that the performance degradation observed for the OCV-AST is due to a change of the surface chemistry of the iridium based anode catalyst, we would expect that the surface chemistry of the iridium catalyst after the reference test remains unchanged compared to its initial state, as no performance degradation is observed in this case (Figure 3). Indeed, the CVs recorded over the course of the reference test (Figure 8a) only exhibit marginal differences between the BoT (green line) and the EoT after 500 cycles (red line). This minor increase of the overall capacity, mostly occurring over the first 10 cycles, is either due to a small extent of surface roughening of the IrO2 catalyst or perhaps more likely to a removal of (surface) impurities, as could be inferred from the slight decrease in HFR over cycling (Figure 5b). Nevertheless, the H-UPD as well as the characteristic hydrous iridium oxide features are absent in the reference test, so that their presence in the OCV-AST is clearly related to the repetitive polarization of the anode to ≈0 V vs. RHE during the OCV periods. Although the potential is cycled close to 0 V vs. RHE during the CV measurements, the time spent at low potentials is insufficient to form metallic iridium and hence, hydrous iridium oxide, which is why no change is expected. Summarizing our observations and analysis so far, the repetitive cycling of the anode catalyst during the OCV-AST between ≈0 V vs. RHE at OCV and ≈1.6 V vs. RHE at high current density leads to a transformation of the initially crystalline IrO2 into hydrous iridium oxide, concomitant with a substantial decrease in performance and a large increase of the HFR (Figure 4). On the other hand, if the cell potential is controlled to ≥1.3 V during idle periods, the initial crystalline IrO2 is retained over extended cycling, and neither a performance degradation nor an increase of the HFR is found (Figure 5).

Figure 8. a) Cyclic voltammograms (CVs) recorded during the reference test, where the OCV periods are replaced by 1.3 V hold periods. b) Comparison between CVs recorded after 10 cycles for the OCV-AST (black line) and after 10 cycles of the reference test with 1.3 V-holds (blue line); the dotted lines represent the CVs recorded at BoT. CVs were recorded at 50 mV/s, 80°C, ambient pressure, and 5 mLH2O min−1 (anode)/ 50 nccm H2 (cathode).
Origin of the cell performance decrease during the OCV-AST
In this section, we will discuss possible reasons for the observed decrease in cell performance over the course of the OCV-AST, largely due to an increase of the HFR (Figure 4), contrary to the essentially constant performance and HFR when the OCV periods are replaced by potential holds at 1.3 V (Figure 5). Consequently, the increase of the HFR must be related to processes which take place during OCV periods when the anode potential was shown to decrease to ≈0 V vs. RHE or which are related to the recurring transition between high potentials (operation) and low potentials (OCV period). In general, an increase of the HFR can could be ascribed to different processes occurring in the cell (see Figure 9), which will be discussed individually in the following.

Figure 9. Scheme of a single cell, illustrating possible reasons for the observed HFR increase during the OCV-AST: 1) cationic contamination of the membrane; 2) dissolution of iridium from the anode catalyst and its redeposition in the membrane; 3) formation of an electronically insulating oxide film on the Ti-PTL surface; 4) additional resistance due to the low electronic conductivity of hydrous iridium oxide.
At low potentials, not only can IrO2 be reduced, but also parts of the cell can be corroded (e.g., flow-fields, PTL). If either of these processes were to result in the formation of metal cations (e.g., from metal impurities in titanium or cationic titanium species), these cations would be ion-exchanged into the membrane/ionomer phase and displace protons, which would not only lead to a reduction of the membrane/ionomer conductivity and to an increase of the HFR,35 but it would also introduce additional mass transport resistance losses, particularly at high current densities, as described for cation-contaminated membranes in PEM fuel cells (① in Figure 9). The performance decrease and HFR increase over the course of the OCV-AST could in principle be also produced by the introduction of ionic contaminants into the feed water. However, in our test system, the deionized (DI) feed water was supplied through an ion-exchanger, and the resistivity measured between the ion-exchanger and the cell inlet was always >15 MΩhmom during the measurements. Moreover, the DI-water was not recycled during operation and therefore we can definitely exclude the presence of ionic contaminants. Moreover, ionic contamination of the feed water would be independent of the cell operating conditions and, hence, would have to be observed in both the OCV-AST and the reference test. If cationic contamination of the membrane from cell components were present, the HFR should be recovered upon ion-exchanging the aged MEA in 1 M H2SO4 at 80°C for 2 h.18 However, since the HFR after reassembling the cell with the acid treated MEA was still high (≈100 mΩ cm²geo) and almost identical to the one measured after the end of test (≈90 mΩ cm²geo), as shown in Figure 10, cationic contaminations can be ruled out as a reason for the observed performance loss. Dis- and reassembling of the MEA and PTL (which is considered incompressible) always bears the risk of a different alignment as well as the mechanical deformation of the catalyst or membrane and could be an explanation for the small discrepancy observed. However, both phenomena would most likely not be significant enough to mask the decrease in HFR due to the removal of ionic contaminations. Additionally, an experiment including a reference electrode placed in between two membranes which were subsequently laminated and processed into an MEA (unpublished data36) shows that the increase of the HFR during the OCV-AST can clearly be related to an increasing HFR on the anode side of the MEA. Cationic contamination, on the other hand, would lead to a lower ionic conductivity of the entire membrane and, hence, would result in an HFR increase measured between the reference electrode and the anode as well as between the reference electrode and the cathode. Thus, cationic contamination can clearly be eliminated as a possible cause of the performance decrease over the course of the OCV-AST.

Figure 10. High frequency resistance of a fresh MEA at BoT, of a cycled MEA (500 OCV-AST cycles analogous to Figure 2), and of the cycled MEA cycled after 2 h in 1 M H2SO4 at 80°C. The HFR was measured at OCV in the (re-assembled) electrolyzer cell at 80 C and ambient pressure, with a flow of 5 mLH2O min−1 at the anode.
Besides cationic contaminations, dissolution and re-precipitation of iridium within the membrane due to reaction with crossover hydrogen might cause an increase in HFR (② in Figure 9), if precipitated iridium were to form a barrier toward proton transport in the membrane. Geiger et al. reported that cycling iridium and thermally grown IrO2 films between 0.04 and 1.4 V vs. RHE in H2SO4 at 25°C leads to the dissolution of iridium (quantified in a flow cell connected to an inductively coupled plasma mass spectrometer), whereby the dissolution rates for crystalline IrO2 were shown to be up to ≈100-fold lower than those of iridium and hydrous iridium oxide.26,37,38 This would predict that the repetitive transition of the HFR-corrected cell voltage (i.e., of the anode potential) between ≈0 V and ≈1.6 V during the OCV-AST should lead to the dissolution of iridium, which would either precipitate in the membrane and/or leave the cell with the water effluent. A similar effect involving the dissolution and the precipitation of the catalyst within the membrane due to reaction with crossover hydrogen was reported in the literature for platinum.39–41 Grigoriev et al. used Pt as an OER catalyst at the anode of a PEM-WE, where they found it to dissolve and re-precipitate in the membrane during a long-term test (albeit at unrealistically high potentials exceeding 3 V vs. RHE).40 On the other hand, in the case of fuel cells, voltage-cycling of the Pt-based cathode catalyst41 or extended holds at OCV39 lead to the precipitation of Pt in the membrane, appearing as a so-called "Pt-band". The latter study also showed that the position of the Pt-band depends on the H2/O2 partial pressure ratio,39 from which one would predict that the deposition of dissolved iridium in a PEM-WE operated at the differential pressure conditions used in our OCV-AST (pH2 = 9.5 bara, pO2 = 0.5 bara) would have to occur very close to the anode/membrane interface.39 To find out whether iridium is indeed being deposited within the membrane over the course of the OCV-AST, site specific TEM analysis were performed, where the membrane area close to the anode/membrane interface was closely inspected. HAADF-STEM images of the degraded MEA after EoT (718 OCV-AST cycles, Figures 11b and 11c) show a distribution of nanoparticles with particle size ≤10 nm (Figure 11d) for at least 1 μm away from the interface, whereas a new MEA (Figure 11a) remains particle-free.

Figure 11. HAADF-STEM images of the interface between anode catalyst layer and membrane of (a) a new MEA and (b) an MEA after 718 cycles of the OCV-AST. (c) HAADF-STEM image of the interface of the MEA after 718 cycles of the OCV-AST (red dashed rectangular region in b). (d) HAADF-STEM image of a single particle precipitated at anode/membrane interface as well as the associated STEM-EDS elemental maps of (d) iridium and (e) oxygen.
The STEM-EDS iridium map of a precipitated particle (Figure 11e) revealed that the particles are iridium-based with no obvious oxygen contribution as shown in the homogenous distribution of the oxygen EDS map (Figure 11f). Therefore, the precipitates are primarily composed of metallic iridium. Even though the amount of precipitated iridium is too small to cause the observed increase in HFR, the dissolution and re-precipitation results in a loss of active material in the anode electrode over time, which ultimately would lead to a lower OER activity due to a reduced electrochemically active surface area (ECSA). We believe that this effect is insignificant during the duration of the here shown experiment due the high catalyst loadings used in this study, but would lead to a more significant performance decay for low Ir-loadings and longer test periods, which is the focus of our current studies.
Alternatively, the HFR could increase due to the formation of an electronically insulating surface film on the Ti-PTL (③ in Figure 9), leading to a higher contact resistance at the anode/PTL and/or the PTL/flow field interface. This was reported previously by Rakousky et al.19 and can be easily verified by ex-situ measurements of the contact resistance between one PTL/flow-field interface for new or aged PTLs (cf. details in Experimental section).22 Contact resistances measured ex-situ should be considered with caution, since temperature, contact pressure, and the exact nature of the interface (PTL/catalyst vs. PTL/flow field) during the measurement are different compared to in-situ measurements. Nevertheless, they can be used to qualitatively judge the contribution of an additional contact resistance. For a simplified presentation, the contact resistances measured at EoT are normalized to the contact resistances measured at BoT.
The PTL/flow-field contact resistance for a PTL after 718 OCV-AST cycles measured ex-situ at ≈1.7 MPa (equivalent to the compression in the cell) is twice as high (black triangle in Figure 12) compared to BoT, while it even decreases slightly (−10%) after 500 cycles of the reference test with the 1.3 V-hold (black square in Figure 12). The observed decrease in contact resistance along with the HFR in case of the reference test, might be correlated to an improving alignment at the PTL/electrode interface during operation. In contrast to that, the observed increase in HFR along with the measured increase in contact resistance during the OCV-AST might be related to the passivation of the Ti-PTL. This was further investigated by repeating the OCV-AST with a Ti-PTL sputtered with a thin layer of gold, which is in the order of several micrometer (measured by SEM), on both sides, hoping that it would improve the contact resistance and serve as a protective coating.42 Indeed, the contact resistance of the Au-sputtered PTL remained essentially constant after 135 OCV-AST cycles (black circle in Figure 12) and a slightly improved HFR at EoT could be observed. This is in good agreement with the constant performance recorded during the OCV-AST when using a Au-sputtered PTL (data not shown) and thus, the recorded increase in HFR during the OCV-AST is correlated to the passivation of the Ti-PTL. However, the increase of the contact resistance over the OCV-AST (≈6 mΩ cm²geo) is much lower than the increase in HFR (see Figure 4) and would only account for a loss of ≈20 mV compared to the 117 mV cell voltage increase at 3 A cm−2geo (see Figure 2). In addition to the increasing contact resistance for a passivated Ti-PTL, the transition from the initially crystalline IrO2 to an amorphous, hydrous iridium oxide, which is known to exhibit lower conductivity,30 can contribute to an increase in HFR. In this case, the observed HFR increase can be due to either an increase of the electronic through-plane resistance of the anode electrode and/or an increase of the contact resistance at the anode/PTL interface due to a lowering of the bulk conductivity of the anode catalyst as it transforms from a crystalline IrO2 to hydrous iridium oxide. Here it must be considered that the electronic through-plane resistance of an electrode does not add directly to the HFR due to coupling of ionic and electronic currents in the electrode, as was shown by a transmission-line analysis by Landesfeind et al.43 For example, if the ionic and the electronic resistances in an electrode are equally large, only 50% of the electronic resistance are reflected in the HFR. For the anode used here, RH+,an ranges between 14–30 mΩ cm²geo, depending on the tortuosity of the electrode.22 In order to explain an increase of ≈26 mΩ cm²geo over the course of the OCV-AST (i.e, the observed HFR increase minus the increase of the contact resistance between the aged PTL and the flow-field), the electronic through-plane resistance of the anode electrode would have to be roughly twice as high (i.e., ≈50 mΩ cm²geo). For a pristine IrO2/TiO2 electrode, the electronic through-plane resistance is ≈0.04 mΩ cm²geo and for an MEA after 200 OCV-AST cycles it was determined to be ≈0.08 mΩ cm²geo. This clearly cannot explain the increase in HFR after 200 OCV-AST cycles of ≈15 mΩ cm²geo. Thus, the only viable explanation for the HFR increase during the OCV-AST is that the lower conductivity of hydrous iridium oxide in combination with a passivated Ti-PTL leads to an increase of the interfacial contact resistance between the PTL and the anode catalyst layer (a resistance that would not be detectable with the contact resistance measurements shown in Figure 12). Due to the low contact area between the electrode and the coarse PTL structure (10–50 μm pores) and the poor electronic conductivity of the passivated PTL surface (see Figure 12), even a comparably small change in the electronic conductivity of the catalyst could cause a significant increase of the contact resistance. Thus, the most likely reason for the increase of the HFR and the increase of the HFR-corrected cell voltage over the course of the OCV-AST (Figure 4) is the development of a contact resistance between hydrous iridium oxide and the titanium PTL.

Figure 12. Percentage variation of the in-cell HFR (red; measured at 0.01 A cm−2geo 80°C, ambient pressure, with 5 mLH2O min−1) and the ex-situ determined contact resistances between the titanium PTL and two Ti flow-fields (black; measured at 1.7 MPa compression) for various PTLs with respect to their BoT values. Left: after 500 cycles of the reference test with the 1.3 V-hold using an uncoated PTL ("ref. test"); middle: after 718 OCV-AST cycles with an uncoated PTL ("OCV-AST"); right: after 135 OCV-AST cycles with a gold-sputtered PTL ("OCV-AST (Au-sputtered)").
In summary, the repetitive transition between ≈1.6 V at 3 A cm−2geo and ≈0 V vs. RHE at extended OCV periods during the OCV-AST leads to the transformation of crystalline IrO2 into a hydrous iridium oxide surface. These large voltage cycles cause the dissolution of iridium and its precipitation into the membrane near the anode/membrane interface, but the overall activity loss due to this mechanism is negligible for anodes with a high iridium loading. The vast majority of the performance loss is due to an increase of the HFR, whereby the above analysis shows that the most likely reason for its increase is a parasitic contact resistance developing between hydrous iridium oxide (formed during the OCV-AST) and the passivated titanium PTL.
Current density and energy requirement for a 1.3 V-hold during idle periods
In this section, an operating strategy to avoid OCV periods and the resulting degradation phenomena will be discussed in terms of a practical application of PEM electrolyzer systems. In the reference test shown in this study, a potential hold at 1.3 V was applied to avoid a potential drop during idle periods. The current density measured during these potential hold periods was typically very low with a value of ≈1 mA cm−2geo or below toward the end of the experiment. This translates into a power density of ≈1.3 mW cm−2geo required to hold the cell potential at 1.3 V, which is only 0.025% of the maximum power density of ≈5.25 W cm−2geo obtained at a current density of 3 A cm−2geo and a corresponding cell voltage of ≈1.75 V. Consequently, the amount of energy required to avoid OCV periods by a potential hold at 1.3 V would be negligible.
In a real system, however, this operating strategy might not be practical, since it would lead to an accumulation of hydrogen in the anode compartment of the electrolyzer due to hydrogen permeation through the membrane during the potential hold at 1.3 V. This accumulation of hydrogen cannot be prevented when operated at differential pressure (pcathode = 10 bara, panode = 1 bara), even when a recombination catalyst in the membrane44 or the flow field is used, since almost no oxygen, which would be required for a recombination with hydrogen to water, is produced at the very low current density of ≈1 mA cm−2geo or below. The amount of oxygen which needs to be evolved to allow a full recombination of hydrogen with oxygen can be estimated based on the permeation rate of hydrogen at the applied cathode pressure, in the present case pcathode = 10 bara. At a temperature of 80°C and in the presence of liquid water, a permeation rate of ≈0.85 mA cm−2geo bara(H2)−1 can be assumed (see also above).23 For cathode pressures of 10 bara or 30 bara, this results in current densities of 8.1 mA cm−2geo or 25.1 mA cm−2geo, respectively, which would need to be applied to produce enough oxygen to achieve a hydrogen to oxygen stoichiometry of 2:1 and, consequently, to enable a full recombination of the permeating hydrogen. Taking the corresponding cell voltage values from Figure 5, this results in power densities of ≈12 mW cm−2geo at 10 bara and ≈36 mW cm−2geo at 30 bara, respectively. This means that only 0.2% (at 10 bara) and 0.7% (at 30 bara) of the maximum power would need to be applied during idle periods to prevent hydrogen accumulation on the anode. Assuming an electrolyzer system which is directly coupled to a fluctuating power source and cannot obtain energy from the grid, the required energy could be supplied by, e.g., coupling a battery to the electrolyzer.45 In summary, this analysis shows that operating the electrolyzer at a small current density during idle periods (<<1% of maximum power required) in combination with a recombination catalyst is a promising operating strategy to avoid OCV periods and the associated performance degradation as well as safety concerns due to hydrogen permeation.
Conclusions
In this study, the impact of intermittent power supply on the performance and lifetime of a PEM water electrolyzer was investigated. An AST protocol was designed comprising periods of operation at two current densities (3 A cm−2geo and 0.1 A cm−2geo), alternating with idle periods where the cell is left at the OCV in order to simulate the discontinuous power output of renewable energy sources. An initial increase in performance was observed during the first 10 cycles (≈50 mV) while prolonged cycling led to a significant decrease in performance due to an increasing HFR (≈1.6-fold after 700 cycles).
The initial increase in performance is related to the OCV periods during which hydrogen crossover and accumulation leads to a decrease of the cell voltage close to the HOR potential (≈0 V), leading to a reduction of the surface of the thermal IrO2 anode catalyst (coated onto a TiO2 support) to metallic Ir. The subsequent oxidation of the catalyst during periods of operation leads to the transformation of the crystalline IrO2 to an amorphous iridium oxide, which was evidenced by a lower Tafel slope (consistent with an increased activity) and the evolution of the characteristic features of metallic Ir and amorphous iridium oxide in a CV. Amorphous iridium oxide is known to exhibit a higher activity compared to crystalline IrO2, explaining the initial performance increase.
However, the repetitive transition between oxidizing conditions during operation and reducing conditions during OCV periods (i.e., between hydrous iridium oxide and metallic iridium) causes an enhanced dissolution of Ir, which was revealed by STEM imaging of the anode/membrane interface showing Ir nanoparticles deposited in the membrane. Even though the amount of precipitated Ir is too small to have a significant impact on performance, continuous dissolution will result in a loss of active material and ultimately in a lower OER activity.
The increasing HFR, which is the major reason for the performance loss during the OCV-AST, can be partially explained by an increasing contact resistance arising from passivation of the Ti-PTL during OCV/load cycles (≈20 mV out of 117 mV at 3 A cm−2geo). However, an additional contribution is hypothesized to be the formation of hydrous iridium oxide, which has a lower electronic conductivity. Due to the low contact area between the electrode and the coarse PTL structure (10–50 μm pores) along with a poor electronic conductivity of the passivated PTL surface, even a relatively small reduction of the electronic conductivity of the catalyst could cause a significant increase of the interfacial contact resistance between catalyst layer and PTL, thus explaining the HFR increase.
Since a reference test where the OCV period was replaced by a potential hold at 1.3 V showed no degradation over 500 cycles, the performance loss can clearly be attributed to the OCV periods. Hence, avoiding OCV periods during operation of a PEM-WE is crucial to ensure long-term stability. Based on these findings, we suggest that applying a small current density (<<1% of maximum power required) during idle periods in combination with a recombination catalyst is required for a dynamically operated PEM water electrolyzer to avoid degradation and mitigate safety concerns related to hydrogen crossover.
Acknowledgments
This work was funded by the Bavarian Ministry of Economic Affairs and Media, Energy and Technology through the project ZAE-ST (storage technologies) and by the German Ministry of Education and Research (funding number 03SFK2V0, Kopernikus-project P2X). We thank Matthias Singer for electrode preparation.