Abstract
Maintaining the physical contact between the solid electrolyte and the electrode is important to improve the performance of all-solid-state batteries. Imperfect contact can be formed during cell fabrication and will be worsened due to cycling, resulting in degradation of the battery performance. In this paper, the effect of imperfect contact area was incorporated into a 1-D Newman battery model by assuming the current and Li concentration will be localized at the contacted area. Constant current discharging processes at different rates and contact areas were simulated for a film-type Li|LiPON|LiCoO2 all-solid-state Li-ion battery. The capacity drop was correlated with the contact area loss. It was found at lower cutoff voltage, the correlation is almost linear with a slope of 1; while at a higher cutoff voltage, the dropping rate is slower. To establish the relationship between the applied pressure and the contact area, Persson's contact mechanics theory was applied, as it uses self-affined surfaces to simplify the multi-length scale contacts in all-solid-state batteries. The contact area and pressure were computed for both film-type and bulk-type all-solid-state Li-ion batteries. The model is then used to suggest how much pressures should be applied to recover the capacity drop due to contact area loss.
Export citation and abstract BibTeX RIS

This is an open access article distributed under the terms of the Creative Commons Attribution 4.0 License (CC BY, http://creativecommons.org/licenses/by/4.0/), which permits unrestricted reuse of the work in any medium, provided the original work is properly cited.
Conventional Li-ion batteries usually include a liquid electrolyte, which facilitates Li-ions transport between cathode and anode. However, the applications of Li-ion batteries are still limited by the flammability and narrow electrochemical window of the liquid electrolytes.1–3 During the past decades, several solid electrolytes4–9 with the ionic conductivity close to the liquid electrolyte have been developed, thus enabled the development of all-solid-state batteries. The benefits of all-solid-state batteries are high energy density, non-flammability, and the large electrochemical window (if the solid electrolyte form stable interphase layers on electrode surface).10,11
However, a major bottleneck for all-solid-state Li-ion batteries lies at the high interfacial resistance due to two main factors, chemical effect and physical contact.3 The chemical effect refers to the chemical changes at the solid-electrolyte/electrode interface that cause slower transport. The chemical changes include the interphase layer formation due to solid electrolyte decomposition,11 and/or Li-ion depletion zone at the interface12 (for example, LiPON/Li2CO3). Physical contact induced impedance comes from the imperfect contact at the solid-electrolyte/electrode interface, which plays a more important role for batteries using solid-electrolytes than the conventional batteries employing liquid electrolytes. Liquid electrolytes can easily diffuse through the porous electrode and wet the electrode surface, so, any fracture and disconnection between solid particles will only cause electrical disconnection. However, for solid electrolytes, the fracture and disconnection will impede Li-ion transport, as well as electron transport. Thus, it is the focus of this study.
The imperfect contact at the solid-electrolyte/electrode interface is formed during cell fabrication and worsened due to cycling. The extent of the initial imperfect contact depends on the fabrication processes. For example, two type of batteries can be synthesized by different manufacturing processes, film-type13–15 and bulk-type16–18 batteries. The former one usually uses deposition process and forms the amorphous structure with a less rough surface, resulting in a better interface contact than the latter one, which is commonly formed by pressing particles and has much rougher interfaces. With battery cycling, the volume of electrodes changes due to repeated insertion and removal of Li atoms, causing disconnection and reduced contacts. The loss of contact area would further cause decrease of capacity. Several strategies to improve the interface contact and to reduce the interface resistance have been proposed. For example, depositing a buffer layer by pulsed laser deposition (PLD) technique or atomic layer deposition (ALD) between solid electrolyte and electrodes,19–22 preparing nanocomposites by a ball milling process23,24 to reduce the particle size and increase the surface area and utilization of supercooled liquid of glass electrolyte.25
Another common method to improve the contact area is simply applying high pressure throughout the fabrication process and electrochemical cycling. Recently, Li et al.,26 clearly demonstrated the effect of contact pressure on the capacity of an all-solid-state Li-ion battery, which is composed of an anode of In-Li, a cathode of TiS2, and a solid electrolyte of Li10GeP2S12. Based on their results, when the applied pressure, during either the fabrication process and/or the operation process, increased from 19 MPa to 228 MPa, the cycle stability was enhanced considerably. The least degradation and the best capacity retention were achieved in the case of maintaining 228 MPa for both processes. Therefore, the effect of the contact pressure was illustrated clearly.
However, a quantitative model is not yet available to connect the contact pressure and the battery performance. Existing continuum models of the all-solid-state-batteries have addressed different problems, such as the discharge and charge performance of thin-film batteries15,27,28 and three-dimensional micro-battery,29–31 Li-ion transport through the solid electrolyte to intercalation electrode,32,33 and the mechanical response of electrodes during cycling.34,35 Therefore, the goal of this paper is to construct a continuum model to correlate the electrochemical performance with the contact area and contact pressure. As the first step, contact area was introduced into a 1-dimensional (1-D) Newman model to simulate the discharge process of an all-solid-state Li-ion battery, which is composed of a metallic Li anode, LiCoO2 positive electrode, and a LiPON-like solid electrolyte. Since Li metal has low hardness and exhibits creep behavior at room temperature,36–38 it is more likely to maintain a good contact with the solid-electrolyte due to plastic deformation. This is consistent with the reported much higher exchange current density for the metallic Li electrode39 than that for LiCoO2 in all-solid-state Li-ion batteries.40,41 Therefore, the contact between solid electrolyte and LiCoO2 is the focus of this study. The model can be used to correlate the loss of contact area with the discharge capacity of an all-solid-state Li-ion battery and further estimate how much pressure should be applied to recover the lost contact area and the capacity.
The relationships between the applied pressure and the contact area between solids with rough surface have been addressed by various mechanics models. The well-known Hertz,42 Greenwood-Williamson,43 and Bush44 models are not appropriate for large contact area (>50%) because they neglect the interaction between contacted asperities. The contact between electrode and solid-electrolyte should be viewed as contact via different length scales. The multi-scale contact problem is related to the nature of electrode materials that build upon architectures of single crystals, polycrystals, primary particles, and secondary particles. Thus the contacting surface can be simplified to have self-affine property, which means the pattern of surface roughness would be repeated in different length scales. Therefore, the real contact area depends on what the length scale is focused on, meaning a perfect contacted interface at macroscopic view may not be 100% in contact at the nanometer scale. The different length scale is described by wavenumbers, and the surface power spectrum density will have an exponential relationship with the wavenumber, proving the self-affine property.45–48 Therefore, Persson's contact mechanics theory,49 which models the contact area variation from 0% to 100% as a function of applied pressure on interfaces with the multi-scale self-affine property, will be adopted for the current model.
Computational Methods
Electro-chemical model definition
A 1-D model was constructed to simulate the discharge process of an all-solid-state Li-ion battery. The model includes a Li metal negative electrode, a 1500 nm-thick LiPON like solid-electrolyte, referred as Li3PO4, and a 320-nm thick LiCoO2 positive electrode, as shown in Figure 1a.
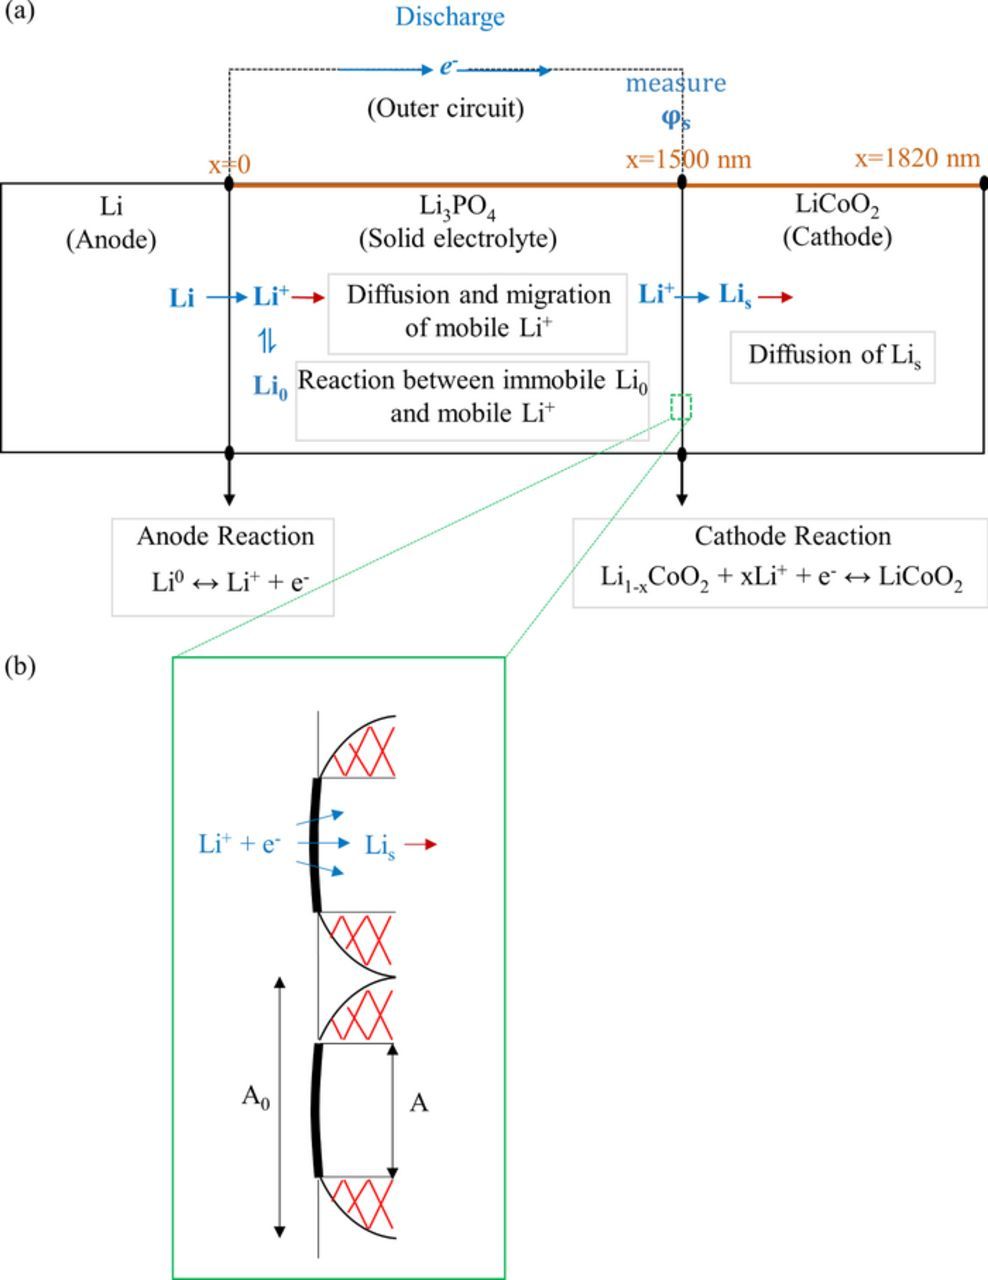
Figure 1. Representation of this 1-D model. (a) The considered concepts and (b) the contact between cathode and solid electrolyte.
At the interface of electrolyte/negative electrode (x = 0), the electrochemical charge transfer reaction is
![Equation ([1])](https://content.cld.iop.org/journals/1945-7111/164/11/E3512/revision1/d0001.gif)
The net current was described as Butler-Volmer kinetics
![Equation ([2])](https://content.cld.iop.org/journals/1945-7111/164/11/E3512/revision1/d0002.gif)
where kneg (SI unit: mol/(m2·s)) is the rate constant of the reaction 1, R is the molar gas constant, F is the Faraday constant (96485 C·mol−1), T is the temperature,  is the concentration of mobile Li, CLi, all is the total concentration of Li in the electrolyte, ∝neg is the charge transfer coefficient for reaction 1, η is the overpotential, and A0 is the contact area that is set it is 1 cm2 in this 1-D model.
The overpotential, η, is defined as
![Equation ([3])](https://content.cld.iop.org/journals/1945-7111/164/11/E3512/revision1/d0003.gif)
where the φs is the electric potential that is the same as the electrode potential, φep is the solid-electrolyte potential, and Eeq is the equilibrium potential, which is set to be 0 for the negative electrode. Since the electron conductivity is much higher than the ionic conductivity in LiCoO2, it is considered as a good electronic conductor.50 Therefore, the φs is assumed to be the same everywhere in LiCoO2.30
After Li+ being generated at the interface of electrolyte/negative electrode, only a fraction of Li+ can be mobile in the solid electrolyte, and this is limited by the diffusion carrier's concentration. In this case, only a fraction (denote as δ) of the total amount of Li+ is mobile at equilibrium is assumed,
![Equation ([4])](https://content.cld.iop.org/journals/1945-7111/164/11/E3512/revision1/d0004.gif)
where C0 is total amount of Li and  is the concentration of uncompensated negative charge.
Therefore, it is assumed that a portion of mobile Li+ would kinetically bond with the solid electrolyte and become immobile. The reactions can be expressed as
![Equation ([5])](https://content.cld.iop.org/journals/1945-7111/164/11/E3512/revision1/d0005.gif)
where Li0 is the immobile Li bonded with anions in solid-electrolyte, n− is the uncompensated negative charges, kd is the dissociation rate, and kr is the reverse reaction rate. So the overall reaction rate can be written as
![Equation ([6])](https://content.cld.iop.org/journals/1945-7111/164/11/E3512/revision1/d0006.gif)
The relationship between kd and kr can be described as
![Equation ([7])](https://content.cld.iop.org/journals/1945-7111/164/11/E3512/revision1/d0007.gif)
So the net production rate of mobile Li-ion that can pass through the solid electrolyte is obtained by
![Equation ([8])](https://content.cld.iop.org/journals/1945-7111/164/11/E3512/revision1/d0008.gif)
The transport of Li-ion in the solid electrolyte is driven by diffusion and migration, expressed by the Nernst-Planck equation and Fick's second law,
![Equation ([9])](https://content.cld.iop.org/journals/1945-7111/164/11/E3512/revision1/d0009.gif)
![Equation ([10])](https://content.cld.iop.org/journals/1945-7111/164/11/E3512/revision1/d0010.gif)
where  is the flux of Li+,
  is its diffusion coefficient, ∇φ1 is the electrical potential gradient, and r is the net production rate of mobile Li obtained in Equation 8.
At the interface of solid-electrolyte/positive electrode the charge transfer reaction can be expressed as
![Equation ([11])](https://content.cld.iop.org/journals/1945-7111/164/11/E3512/revision1/d0011.gif)
with the same Butler-Volmer expression15,30 the net current is
![Equation ([12])](https://content.cld.iop.org/journals/1945-7111/164/11/E3512/revision1/d0012.gif)
![Equation ([13])](https://content.cld.iop.org/journals/1945-7111/164/11/E3512/revision1/d0013.gif)
where  and
and  are the maximum and minimum concentration of Li in the positive electrode, respectively, and the kpos is the rate constant of the reaction. The overpotential, η, is defined as the same as Equation 3, but Eeq is the equilibrium potential of LiCoO2 and it depends on the concentration of Li.
After the charge-transfer reaction, Li would be produced and intercalate into the positive electrode (denote as Lis), and its diffusion through the positive electrode is driven by the concentration gradient, as
![Equation ([14])](https://content.cld.iop.org/journals/1945-7111/164/11/E3512/revision1/d0014.gif)
where  ,
,  , and
, and  are the diffusion coefficient, concentration, and the concentration gradient of Lis. The reaction rate,
  , inside the positive electrode is 0, except at the solid-electrolyte/positive electrode interface (x = 1500 nm), where
  (mole·s−1m−2), would be correlated with the current.
![Equation ([15])](https://content.cld.iop.org/journals/1945-7111/164/11/E3512/revision1/d0015.gif)
where Ipos is the current (A), ipos is the current density (A/m2), ν is the stoichiometric coefficient of Li, and ne is the number of participating electrons in the reaction, both values are one here.
With this 1D model, a discharging process under a constant current is simulated. This process means as the constant current passing through the two interfaces, x = 0 nm and x = 1500 nm, the same amount of Li-ion will be generated and released at these two interfaces, respectively. All the Li+ and Lis are bounded between x = 0–1500 nm, and x = 1500–1820 nm, respectively. The electroneutrality is applied in the electrolyte that gives the concentration of Li-ion equals to the negative charge. The boundary and initial conditions in this model are listed in Table I. The concentration profile of Li+ and Lis in the solid-electrolyte and the positive electrode, and the electrical potential at x = 1500 nm are solved. The boundary condition is the controlled value of current (C-rate) at the both end of the solid-electrolyte. Since for all-solid-state Li-ion batteries, the range of C-rate usually is between 0.1 C to 10 C,2,26,51 the C-rates chosen to be studied in this research are 0.1, 1, 5, 10 and 20 C. The input open-circuit voltage (OCV) of LixCoO2, where x varies in the range of 0.5 to 1, is given in Figure 3c. Initially, Li0.5CoO2 gives the starting voltage around 4.2 V. The simulation would end at the desired cutoff voltage. The parameters used and listed in Table II are based on the research of Danilov and Notten et al.,15 where they have fitted to the experimental data.
Table I. The conditions and dependent variables in this model.
| ipos = controled value | x = 0.5 (ratio of initial  to CLi,max) to CLi,max) |
When  = CLi,max (at the interface of positive electrode/electrolyte) = CLi,max (at the interface of positive electrode/electrolyte) |
CLi+ (x,t) | The electrolyte concentration of Li ions (mol/m3) |
 (x,t) (x,t) |
The concentration of Li in LiCoO2 (mol/m3) | |||
| Φs, neg = 0 | Φs, pos = 4 | Φs, pos (t) | The external electric potential of positive electrode (V) | |
| Eeq,neg = 0 (Ground) | Φep = 0 | Φep (x,t) | The electrolyte potential (V) |
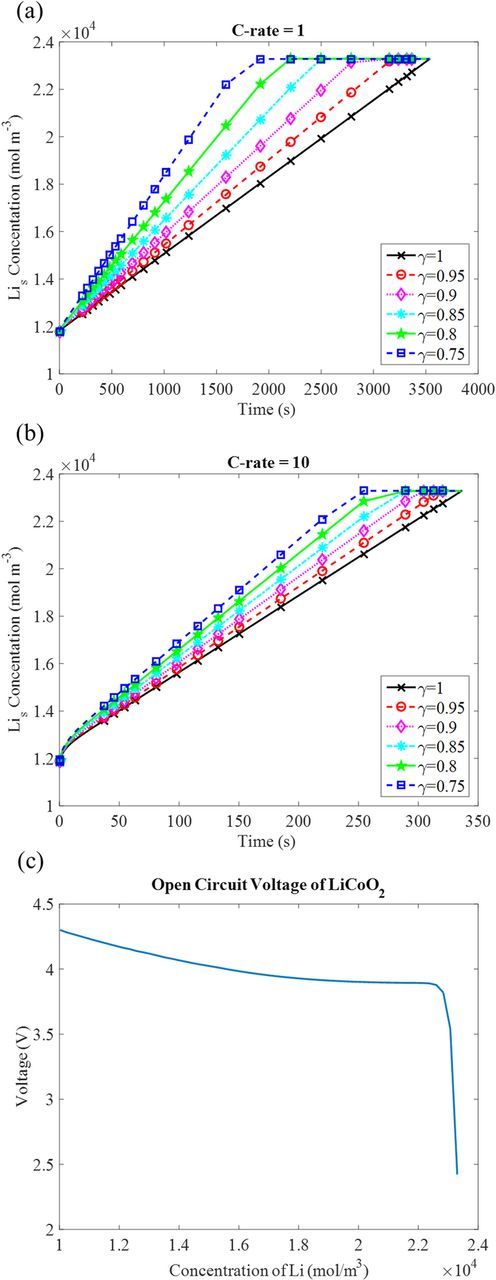
Figure 3. The effect of the contact area on the concentration of Li at electrolyte/cathode interface (x = 1500 nm) at different discharge time. (a) 1 C-rate (b) 10 C-rate. (c) The open circuit voltage of LiCoO2 at different amount of inserted Li.
Table II. The parameters used in this model, which have been fitted to experimental data.15
| Control Variable | Description | Value |
|---|---|---|
| CLi,total | The total electrolyte concentration of Li ions (mol/m3) | 6.01*104 |
| CLi,max and CLi,min | Maximum and minimum concentration of Li in the solid electrode (mol/m3) | 23300 and 11650 |
| DLi+ | Li-ion diffusion coefficient in solid electrolyte_Li3PO4 (m2/s) | 9*10−16 |
 |
Lis diffusion coefficient in positive electrode_LiCoO2 (m2/s) | 1.76*10−15 |
| δ | Fraction of mobile Li-ion at equilibrium | 0.18 |
| kd and kr | Rate constants for dissociation and recombination (mol/(m2·s)) | 2.13*10−5 and 9*10−9 |
| kpos and kneg | Rate constant for reactions (mol/(m2·s)) | 5.1*10−4 and 0.01 |
| αpos and αneg | Charge transfer coefficient for the reactions | 0.6 and 0.5 |
Incorporation of the loss of contact area in this 1-D model
As illustrated in Figure 1b, the imperfect contact at the solid electrolyte and positive electrode interface is considered. Although both electrode and electrolyte surfaces are rough, one can always reduce the contact to a flat surface with an effective rough surface. To represent the imperfect contact area, a contact factor, γ, is assigned varying
![Equation ([16])](https://content.cld.iop.org/journals/1945-7111/164/11/E3512/revision1/d0016.gif)
where A is the actual imperfect contact area, and A0 is the perfect contact area (cross section area). γ ranges between 0–1.
As mentioned in the introduction part, in liquid electroylte,52 Li-ion can diffuse through the porous electrode. Fracture and disconnection of particles will only cause disconnection electronically, which means less pathways for e− to react with Li+. However, for solid electrolyte, the disconnection would be even worse due to the fewer pathways for both of e− and Li+ to react. Therefore, the imperfect contact at the solid-electrolyte/electrode interface may cause part of the electrode material inaccessible, especially at a higher rate. The inhomogeneous Li distribution in LiCoO2, observed by in-operando elemental mapping of an all-solid-state battery,12 may be partially caused by imperfect contact as well. Therefore, in the worst case, the loss of contact between electrode and solid-electrolyte interface would cause the loss of LiCoO2 material, in which Li-ion cannot be stored. The region of the red color in Figure 1b means the area of loss of material. In this case, the imperfect contact area, A = γA0 is incorporated into this model at the interface of electrolyte/positive electrode. More specifically, Equations 13 is modified to represent the real contact area, as
![Equation ([17])](https://content.cld.iop.org/journals/1945-7111/164/11/E3512/revision1/d0017.gif)
Since constant current discharge process is simulated and the C-rate is fixed, the current density at the solid-electrolyte side of the interface is not affected by the loss of contact area, but the production rate of Li on the positive electrode side of the interface would be scaled to match the same current. Therefore, the Equation 15, which is the production rate of Li, should be adjusted by γ, as
![Equation ([18])](https://content.cld.iop.org/journals/1945-7111/164/11/E3512/revision1/d0018.gif)
Calculate the contact area (A) under an applied load at self-affine rough interfaces
Persson's multi-scale contact mechanics theory49 was used to establish the relationship between the contact stress and the real contact area, A, in order to provide the key parameter γ used in the above electrochemical model. The advantage of Persson's model is that it captures the fact that the real contact area depends on the observation length scale. For example, an interface may look like contact perfectly with uniform contact pressure at a macroscopic view, but at a microscopic view, the surface roughness will lead to non-perfect contact and non-uniform contact stress. By assuming that surface roughness has self-affined property,45–48 this model can calculate the real contact area at every length scale. Thus, it is important to define the length scales for the battery systems.
The contact mechanics is at multi-length scale, as shown in Figure 2a, where the largest contact area A0 and the corresponding length is L = A01/2, assuming isotropic in x-y direction. In the reciprocal space, the smallest wavelength is qL= 2π/L. Therefore, any wavelength, q, can be defined via a magnification, ξ, as q = ξqL. For the longest length scale and the smallest wave length, ξ is 1. The smallest length scale for contacting would be observed in the atomic scale, which sets the upper limit of wave length q.
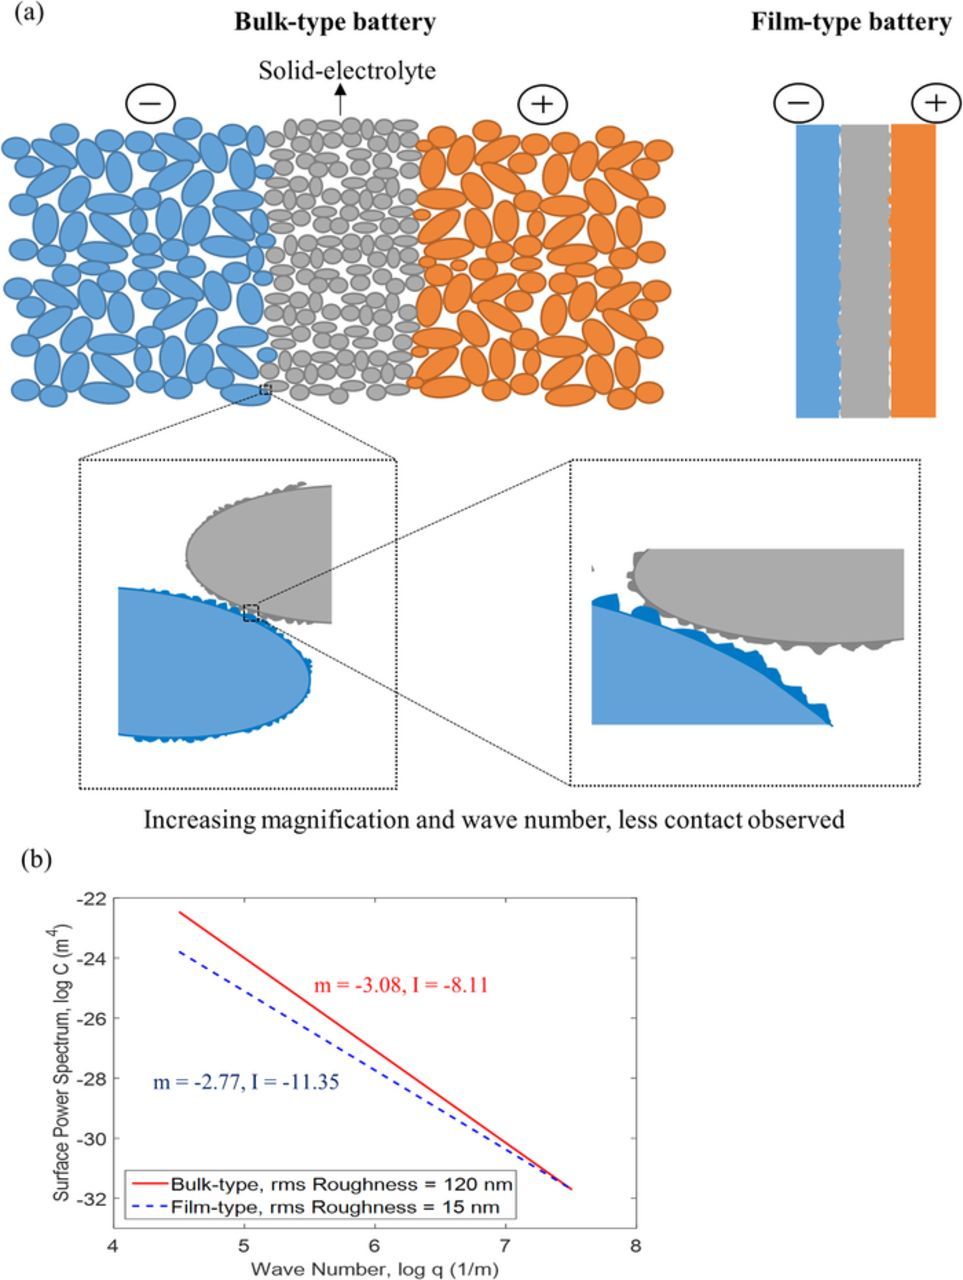
Figure 2. (a) Schematic of the interfacial contact for bulk-type and film-type batteries, and the contact area observed at different length scale. (b) Logarithm relationship between power spectrum and wave number at different RMS roughness.47 Only the self-affine region is shown.
The surfaces are composed of asperities for both the film-type or bulk-type battery. The surface roughness power spectrum can be calculated by the Fourier transform of the height-height correlation function:53
![Equation ([19])](https://content.cld.iop.org/journals/1945-7111/164/11/E3512/revision1/d0019.gif)
where C(q) is the power spectrum of wavelength q; h(x) is the height of the surface above a flat reference plane that is chosen for h(x) = 0. The angular bracket < · · · > is the ensemble averaging operator. Solid surfaces are approximately self-affine fractals, which means if observing the surface in different magnification, it looks the same because the surface pattern repeats. That being said, when the length scale changes in the self-affine region, C follows a power law of q, as C∝qm× 10I, as shown in Figure 2b, where m is the slope and I is the y-intercept. The lower limit of q or ξ defines the scale when the self-affine property is not held anymore. In this case, the self-affine property is considered to be non-distinguishable. For example if the diffusion-length of Li at 1 C rate is used to be the observed length scale, Li distribution can be considered as uniform at this scale, then the contact is not self-affined anymore. This length scale is estimated to be 3.6 μm, based on  . So the lower limit of the q is defined by the magnification ξ of around 2700 for A0 = 1 cm2 in this model. The contact area for this length scale was computed.
C(q) would be obtained from the surface information, such as root-mean-square (RMS) roughness and peak-valley value. As other research investigated the surfaces by atomic force microscopy (AFM), for the film-type cathode, such as LiMn2O4, LiCoO2, LiNi1/3Co1/3Mn1/3O2, the RMS roughness is around 10–20 nm.54–58 On the other hand, for the bulk-type cathode, the RMS roughness is around 100–200 nm, such as LiFePO4, CoO + Co3O4, and LiNi0.8Co0.2O2.59–61 Currently, C(q) is not available for all-solid-state battery electrode and solid-electrolyte surface yet. Therefore, we rationalize C(q) for the observed RMS based on the surface analysis by Flys et al.47 In their study, they have used AFM to investigate the surface profile and obtained C(q) for samples prepared with different RMS roughness, ranging from 2 to 120 nm. The result of C(q) at RMS roughness of 15 and 120 nm from the research of Flys et al. were chosen to represent the film-type and bulk-type cathode, respectively. Figure 2b shows the power spectrum-wavelength logarithm relationship for these two different RMS roughness. Also, it indicates that the rougher surface, which is the RMS roughness of 120 nm, has a larger slope, m, and smaller y-intercept, I.
Based on the Persson's contact mechanics theory,49 the stress distribution at the magnification, ξ, which refers to any arbitrarily chosen length scale, can be defined as
![Equation ([20])](https://content.cld.iop.org/journals/1945-7111/164/11/E3512/revision1/d0020.gif)
where P(σ, ξ) is the probability of stress distribution, σ(x, ξ) is the interface stress distribution at any position x in the spatial coordinate, and δ is the delta function. By this definition, the real contact area A, which is projected on the interface-plane, can be directly calculated from this stress distribution as the following
![Equation ([21])](https://content.cld.iop.org/journals/1945-7111/164/11/E3512/revision1/d0021.gif)
The integration of stress should be equal to the applied load. Therefore, the stress distribution can be obtained by solving,62
![Equation ([22])](https://content.cld.iop.org/journals/1945-7111/164/11/E3512/revision1/d0022.gif)
![Equation ([23])](https://content.cld.iop.org/journals/1945-7111/164/11/E3512/revision1/d0023.gif)
where E and ν are the effective Young's modulus and Poisson's ratio averaged from the two materials. C(q) is the power spectrum obtained from Equation 19.
![Equation ([24])](https://content.cld.iop.org/journals/1945-7111/164/11/E3512/revision1/d0024.gif)
where subscript 1 and 2 refer to the two solid materials. In this research, the solid electrolyte material Li3PO4 and LGPS; and the cathode materials LiCoO2 and TiS2 are chosen to be calculated. Their elastic properties are listed in Table III.
Table III. Elastic properties for solid electrolyte and cathode materials.
| Li3PO4 | LiCoO2 | LGPS | TiS2 | |
|---|---|---|---|---|
| Young's Modulus (GPa) | 103.436 | 17137 | 21.767 | 22868 |
| Poisson Ratio | 0.2636 | 0.269 | 0.3767 | 0.1168 |
The different properties of the contact, such as elastic contact, adhesion or elastoplastic contact can be addressed by changing the initial and boundary conditions of Equation 22. Since both Li3PO4 and LiCoO2 are ceramic materials, the contact is considered to be elastic without adhesion in this study. For the initial condition, which means the lowest magnification ξ = 1, the contact area would be the cross-section area and looks like a flat and full contact. So the stress distribution P(σ,1) = δ(σ–σ0), σ0 represents the applied pressure. There are also two other boundary conditions along the σ-axis are necessary. For elastic contact, P(σ, ξ) would be 0 when σ → ∞, when σ < 0 the P(σ, ξ) should be 0 as well since there is no adhesion. With the initial and boundary conditions, the stress distribution of Equation 22 can be solved, and the real contact area in Equation 21 can be further obtained by
![Equation ([25])](https://content.cld.iop.org/journals/1945-7111/164/11/E3512/revision1/d0025.gif)
![Equation ([26])](https://content.cld.iop.org/journals/1945-7111/164/11/E3512/revision1/d0026.gif)
Results and Discussion
The effect of the loss of contact area causing accumulation of Li on electrode surface
In this simulation, the battery is discharged at a constant current, and the cell voltage is the potential difference between the positive electrode and negative electrode. Since the negative electrode is grounded, the potential, φs, neg, is maintained as 0. The cell voltage is determined by the potential at positive electrode, φs, pos, which is affected by the equilibrium potential of positive electrode, φeq, the over potential and the solid-electrolyte potential. The local Li concentration at the solid-electrolyte/cathode interface decides the equilibrium potential, φeq. Therefore, it is necessary to first check the concentration of Li on the cathode surface when the contact area is not perfect.
Figure 3a and 3b shows the variation of the local concentration of Li,  , with time at the Li3PO4/LiCoO2 interface (x = 1500 nm) under different contact area and two separate discharge rates, 1 C and 10 C, respectively.
Comparing Figure 3a and 3b, at the same discharging time, the concentration of Li is higher at 10 C than at 1 C, since higher C-rate means larger current, which causes more Li produced on the LiCoO2 surface. If the diffusion rate is not as fast as the production rate, Li is accumulated at the LiCoO2 surface. In both rates, at the same discharging time, the local concentration of Li in LiCoO2 (Lis) at the cathode surface increases when the contact area is reduced. It is because the constant current imposed the same amount of Li produced at LiCoO2 surface, so the local concentration of Li is higher when the contact area is reduced. The local Lis concentration would then be continuously increased to the maximum Li concentration, which is 23000 mol/m3 for LiCoO2.
When the local concentration of Li on LiCoO2 surface increases with reduced contact area, it results in the reduction of OCV and the potential of LiCoO2. Therefore, the battery voltage will reduce due to the loss of contact area, this is further analyzed in the cell discharge voltage vs. capacity plot.
The effect of the loss of contact area on the discharge voltage and capacity
Figure 4 shows the results of discharging curves, comparing the effects of the different discharging rate ranging from 0.1 to 20 C and the contact area, which is expressed by contact factor, γ, varying from 1 to 0.75. The cutoff range of 3.7–4.2 V for the battery voltage is used because most of the batteries operate between these values. Qout is the discharging capacity per unit area, which is calculated by
![Equation ([27])](https://content.cld.iop.org/journals/1945-7111/164/11/E3512/revision1/d0027.gif)
where t is the discharging time (s). The dashed line stands for the critical capacity, which is defined as 80% of the maximum capacity since typically the battery for transport application would be seen as "end of life" when the capacity is less than 80%.
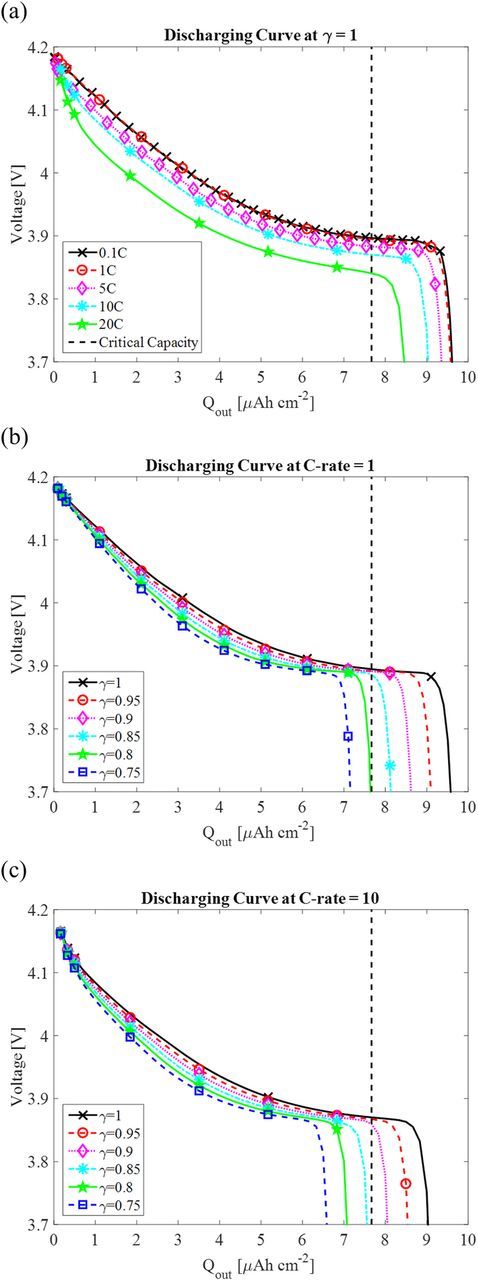
Figure 4. Discharge curves at (a) γ = 1 and different C-rate, (b) C-rate = 1 and different γ, (c) C-rate = 10 and different contact factor, γ.
Figure 4a shows the discharge curves with the perfect contact (γ = 1) at different C-rates. It shows the discharge curves for 0.1 C and 1 C are very similar. With increasing discharging rate, both the cell voltage and capacity are reduced. This result is similar to other models with perfect contact area.27,30 With the current model and parameter setting, the discharge capacity can still be maintained above 80% of the maximum capacity even at 20 C with perfect contact area.
Figure 4b and 4c show the discharge curves with imperfect contact at C = 1 and 10, respectively. At the same discharging rate, both the discharge voltage and capacity drop with the reduced contact factor, γ. The drop of voltage can be considered as the increase of interface resistance and ohmic loss due to loss of interface contact area. The decrease of capacity is rate dependent. For example, if discharging at 1 C, the battery would lose 20% of the capacity if the contact area is less than 80% of the cross-section area (γ = 0.8). If discharging at 10 C, the battery would be at the "end of life" if the contact area is less than 85%. This is because of the accumulation of Li on cathode surface due to reduction of contact area and the high rate. Since the diffusion rate of Lis is not as fast as the reaction rate, the high surface concertation of Lis leads to less utilized electrode particles at the cutoff voltage, thus lost contact area and higher C-rate give less discharge capacity.
The definition of discharging capacity depends on the cutoff voltages, which is also known as the depth of discharge of the battery. Figure 5 compares the capacity loss due to contact area loss at two cutoff voltages, namely 3.8 V and 4.0 V. Here, the 100% of remaining capacity stands for the capacity that is obtained at 0.1 C discharge. Both higher rate and loss of contact area reduce the capacity. Interestingly, the loss of capacity due to contact area loss shows almost a linear relationship. At the cutoff voltages of 3.8 V, the slopes of all the lines are almost 1; and at the cutoff of 4.0 V, the absolute value of the slopes are all smaller than 1. For example, the slope of 0.1 C is −0.34 and the slope of 20 C is −0.26. Thus, at the cutoff of 4.0 V, the magnitude of slope is larger at lower C-rate.
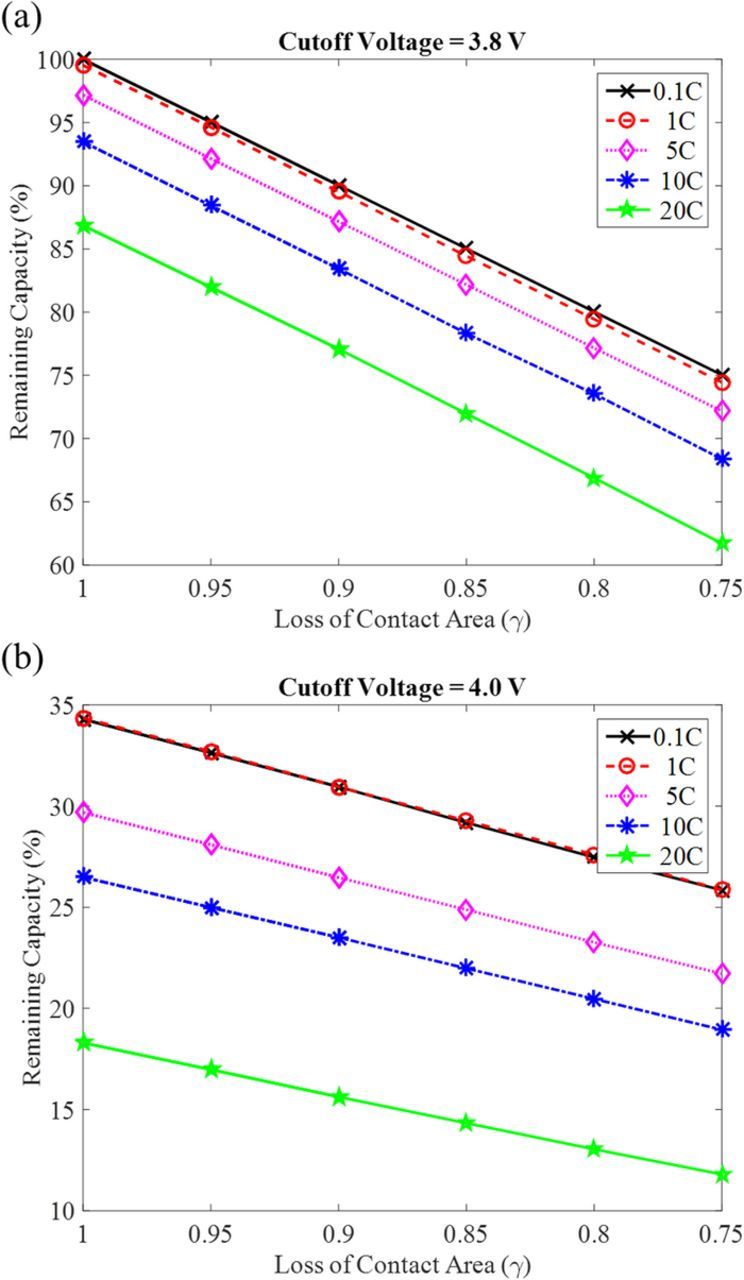
Figure 5. The relationship between the discharging capacity and the loss of contact area at cutoff voltage of (a) 3.8 V and (b) 4.0 V.
It can be seen from Figure 4 that the cutoff voltage of 3.8 V means the cathode surface is fully lithiated, the capacity does not change with voltage much anymore. Therefore, the remaining capacity at the cutoff voltage of 3.8 V is limited by the material available on the cathode surface. Since we have assumed loss of material due to the loss of contact area, the capacity loss drops with loss of contact area with a slope of 1. For the cutoff voltage of 4.0 V, the discharging capacity is still very sensitive to the voltage, which is related to the local Lis concertation. The local Lis concentration depends on the Li generation rate and diffusion rate, thus the capacity is not dominated by the amount of materials only. Therefore, the slopes for capacity drop due to loss of contact area are smaller than 1, and the slope for lower C-rate (like 0.1 and 1 C) is larger than the higher C-rate when the cutoff voltage is 4.0 V. At higher rate, less diffusion time, the role of loss contact area will be more dominating, such the slope decreases with increasing C rate.
The linear relationship may be due to the simplified 1D model and the assumption of worst scenario (losing accessible cathode material due to loss of contact), more sophisticated 2D and 3D models that can describe the local concentration change and the amount of accessible cathode material more accurately are being developed for further study. Nevertheless, the 1-D continuum model has directly correlated the loss of contact are with loss of capacity. So the next question if the loss of contact area can be recovered by the applied pressure, and how to calculate the necessary applied pressure. In the following part, calculations for the applied pressure will be discussed.
Estimation of needed pressure for recovering the loss of contact area
As introduced in the last section of Computational methods, for a given C(q), the contact area ratio, γ, can be calculated under different applied pressure, σ. Two all-solid-state batteries were considered, a film-type contact at Li3PO4/LiCoO2 interface, and a bulk-type contact at LGPS/TiS2, respectively. The previous battery discharge model is based on parameters fitted for the first case. It can be expected the predicted capacity loss due to contact area loss relationship is general for other all-solid-state batteries. In order to make a comparison with the experiments of Li et al.,26 the second case was modeled. As introduced in the last section of Computational methods and plotted in Figure 2b, the initial C(q) has been determined based on measured RMS roughness for the thin film type and bulk-type and relationship between C(q) and RMS discussed by Flys et al.47 After cycling, experimental studies54,56,58,63 have reported the RMS roughness would increase. Also, based on the study of surface morphology,45,46,64 the absolute value of m, of the plot in Figure 2b would increase, and the intercept, I, would be decreased when the RMS roughness is increased. (m, I) values were changed to mimic the effect interface roughening due to battery cycling.
Figure 6 shows the surface contact ratio as a function of the applied pressure. As Figure 6 shows, at low applied pressure, the increase of contact area with the applied pressure is nearly linear, which agrees with other contact models, such as the theories of Hertz,65 Greenwood-Williamson,43 and Bush.44 When the contact area ratio is greater than 60% (A/A0 = 0.6), it needs much more pressure to increase the contact area further. The two black lines stand for the contact area before cycling, where m = −2.77, I = −11.35 for film-type battery in Figure 6a and m = −3.08, I = −8.61 for the bulk-type batter in Figure 6b. Comparing the film-type and bulk-type all-solid-state batteries, at the same applied pressure the film-type has more contact area than the bulk-type. Both Figure 6a and 6b show that with increasing surface roughness (increasing m and decreasing I) due to cycling, the contact ratio decreased. Furthermore, increasing the applied pressure can increase the contact ratio.
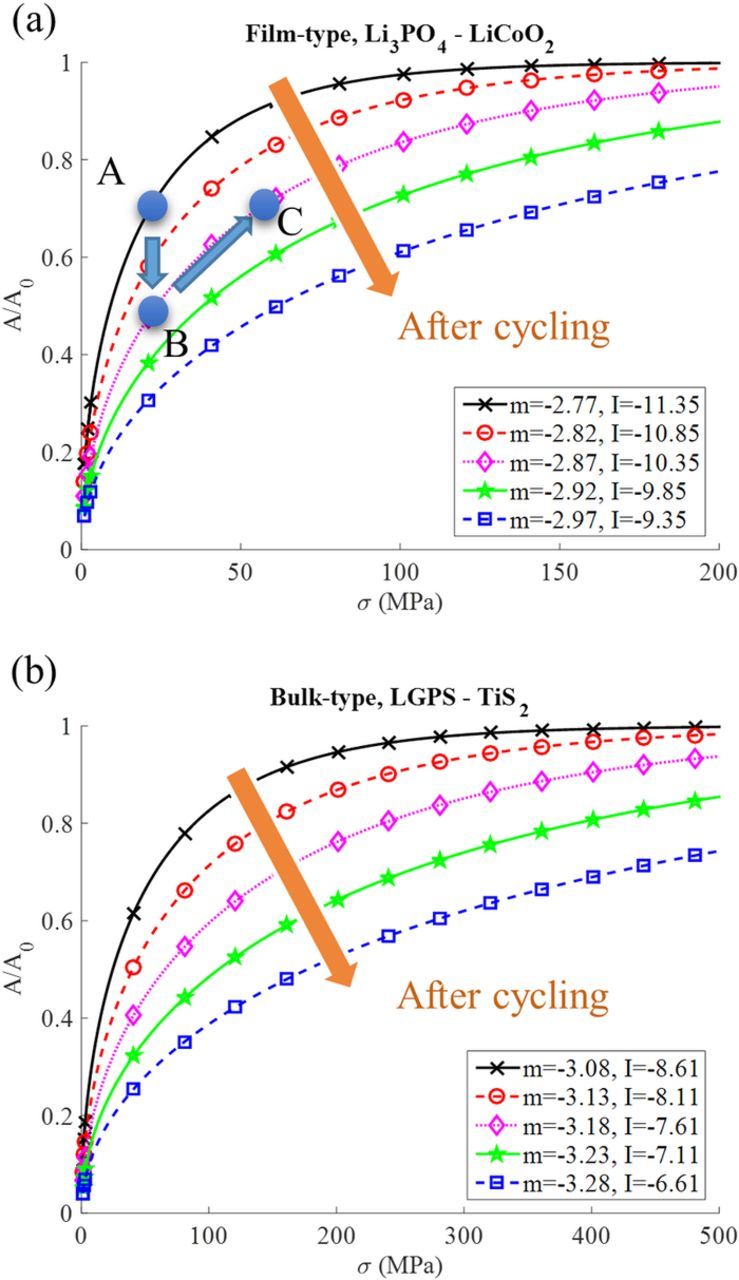
Figure 6. The relationship between the ratio of real contact area to the maximum contact area (A/A0) and the applied external pressure (σ) for the interface of (a) film-type and (b) bulk-type battery.
To demonstrate this model leads to reasonable contact area estimations, the results shown in Figure 6b can be compared with the experiments by Li et al.,26 in which they investigated an In-Li/LGPS/TiS2 all-solid-state Li-ion battery. They applied two different pressures, 19 and 230 MPa, for the fabrication process and during the operation of the battery. From the calculation, at 19 MPa, the contact area is only about 40%, which results in the poor capacity retention as shown in their experimental result. If increasing the pressure to 230 MPa, the contact area is estimated to be around 95%, and so they observed effectively enhanced capacity retention.
With this model, it is now possible to calculate the proper applied pressure for al-solid-state batteries. For example, if the initial condition for the film-type battery is under 20 MPa, as starting from point A in Figure 6a, the contact area is around 70%. After cycling, it may decrease to point B, since the surface becomes much rougher, it also means around 20% of the contact area is lost. Then to get the original contact area and the capacity back, it needs to follow the pink line, for instance, increasing the contract pressure to 60 MPa will recover the contact area to 70% again.
Therefore, based on Figure 5, the lost contact area can be estimated by the capacity drop. Then, based on Figure 6, the applied pressure needed to recover the contact area and capacity can be obtained. By connecting these two calculations, one could calculate how much contact area lost during cycling, and how much pressure should be applied to get the contact area back, to prevent the degradation of the all-solid-state Li-ion battery.
Conclusions
The imperfect contact between the solid electrolyte and the electrodes is not only due to the fabrication process but also the operation of the battery. During cycling, the contact area would be decreased continuously because of the volume change of the electrodes, and it results in the degradation of the battery. To study the effect of the loss of contact area on the performance of the battery, the imperfect contact is incorporated into a 1-D Newman battery model that simulates the discharging process of an all-solid-state battery. This model assumes the Li concentration will be localized at the reduced contact area, and it was solved by finite element analysis. It is found that the discharging voltage and capacity drop much faster due to loss of contact area at higher rate. The capacity drop was correlated with the contact area loss. At lower cutoff voltage (3.8 V), the correlation is almost linear with a slope of 1; while at higher cutoff voltage (4.0), the dropping rate is slower than 1 and the dropping rate decreases with increasing discharging rate.
To establish the relationship between the applied pressure and the contact area, Persson's contact mechanics theory was applied, as it uses self-affined surfaces to simplify the multi-length scale contacts in all-solid-state batteries. Taking measured surface roughness and elastic properties of solid electrolytes and electrodes, the contact area as a function of the applied pressure was calculated for film-type Li/Li3PO4/LiCoO2 and bulk-type Li/LGPS/TiS2 all-solid-state batteries. The results agree well with experimental observations of bulk type In-Li/LGPS/TiS2 all-solid-state batteries. The model is further applied to suggest how much pressures should be applied to recover the contact area and capacity loss due to cycling.
One limitation of the current 1D model is that it assumes the loss of contact area leads to inaccessible positive electrode materials, which is the worst scenario. For future work, 2-D or 3-D continuum models need to be developed to capture the 2-D and 3-D diffusion of Li in the positive electrode after losing contact. The Li concentration gradient due to contact area loss will be calculated more accurately, thus the amount of lost material inside the electrode can be correlated with the contact area loss.
Another limitation of the current 1D model is that it inherited many assumptions and electrochemical equations derived in liquid electrolyte systems. These approximations may not apply to all-solid-state batteries. For example, the ionic transport in solid and liquid electrolytes may be different. The ionic conductivity in solid electrolytes is carried by charged defects, such as vacancies or interstitials, whose concentration varies with the electrochemical Fermi level relative to the conduction and valance bands in the solid electrolyte.66 Near the electrode surface, liquid electrolyte can form double-layer structure, however the solid electrolyte will be polarized. The difference in the double layer structure may lead to different charge transfer kinetics described by Butler-Volmer equations. These relationships need to be further developed and validated for all-solid-state batteries.3
Acknowledgments
We acknowledge the support for degradation mechanism modeling as part of Nanostructures for Electrical Energy Storage (NEES), an Energy Frontier Research Center funded by the U.S. Department of Energy, Office of Science, Basic Energy Sciences under Award number DESC0001160.