Abstract
New sulfur-carbon composite positive electrode materials were synthesized through sulfurizing primary alcohols, and their electrochemical properties were examined. The sulfurized alcohol composites (SACs) showed relatively higher sulfur contents (more than 60 wt%) and were revealed to be an amorphous structure by high-resolution TEM observations. Raman and XAFS spectra showed the presence of S – S, C – S, and C – C bonds, and the C – C bonds mainly consisted of sp3 components, which makes a clear contrast to the previously reported organosulfur materials where the C – C bonds mainly consisted of sp2 components. The SAC positive electrode cells showed discharge capacities of more than 900 mAh·g−1 with relatively reduced cycle degradation.
Export citation and abstract BibTeX RIS

This is an open access article distributed under the terms of the Creative Commons Attribution Non-Commercial No Derivatives 4.0 License (CC BY-NC-ND, http://creativecommons.org/licenses/by-nc-nd/4.0/), which permits non-commercial reuse, distribution, and reproduction in any medium, provided the original work is not changed in any way and is properly cited. For permission for commercial reuse, please email: oa@electrochem.org.
Elemental sulfur is one of the promising cathode active materials for high-energy rechargeable lithium batteries because of its high theoretical capacity (ca. 1670 mAh·g−1) and relatively low cost.1–3 However, this active material has some disadvantages, such as low electronic/ionic conductivity and dissolution as polysulfides into electrolyte during electrochemical cycling (resulting in shuttling of polysulfides), both of which are responsible for limited rate capability and rapid cycle degradation in Li-S cells.4 Various attempts have been performed to solve these problems, and the major improvements have been made by forming composites with carbon matrix (S-C composites), whereby sulfur was physically confined with fine-structured carbon.4–10 Despite the improved electrical transfer and the suppressed shuttling of polysulfides, these S-C composite cells still showed gradual capacity degradation with prolonged cycling. This would be originated from the low binding energy between sulfur and carbon matrices.4
Another type of S-C composites has been developed, based on the concept of embedding sulfur into a conducting polymer matrix in a molecular level, and one of the promising results was reported for the composites using polymerized poly(acrylonitrile) (PAN).11–16 In this organosulfur material (sulfurized PAN, referred to as SPAN), sulfur is covalently bound to the polymer chain or interconnects the PAN network as a cross-linking agent.11–16 Such sulfur-carbon framework effectively suppressed the dissolution of polysulfides into the electrolyte, resulting in the excellent cycle stability of the cells. Although the efficient sulfur-carbon frameworks have been developed, there still remain challenges for exploring other organosulfur materials, for example, with higher sulfur contents, using inexpensive and non-toxic reagents; the typical SPAN showed the sulfur content of 50–55 wt%, resulting in the specific capacity of ca. 600–800 mAh·g−1, which could be expectedly enlarged to ca. 1000 mAh·g−1 by increasing the sulfur content up to 65 wt%.11
In the present work, we have tried to prepare new type of organosulfur cathode materials with higher sulfur content using primary alcohol. The structure and the electrochemical properties of the obtained sulfurized alcohol composite (SAC) were examined and compared with those of the previously reported SPAN.
Experimental
Primary alcohol 1-CnH2n+1OH (n = 5–10) (Wako Pure Chemical Industries, Ltd., Japan) and elemental sulfur (Kishida Chemical Co., Ltd., Japan) were mixed in an 1: 5 weight ratio, and the mixture was transferred into a glass tube equipped in an electric furnace, which was heated at 400°C for 1 h under N2 flow to complete the refluxing reaction. After cooling to room temperature, the resulting powder was ground and then heated again at 300°C for 2 h under N2 flow in order to eliminate the residual elemental sulfur, to yield the SAC (n = 5–10) sample. We also prepared SPAN sample after the procedure reported previously.13
The phase purity of the sample was checked by X-ray diffraction (XRD) measurements (Rotaflex RU-200B/RINT, Rigaku, Japan) using monochromatic Cu Kα radiation within the 2θ range of 10–125°. The elemental composition of the sample was estimated by combustion analysis (model MT-6, Yanaco, Japan (for C, H, and N) and model AQF-100, Mitsubishi Chemical Analytech Co., Ltd. (for S)). The thermal stability of the sample was examined by thermogravimetry and differential scanning calorimetry (TG-DTA, Model DTG-60, Shimadzu, Japan). The local structures of the sample powders were examined by Raman spectroscopy measurements (model XploRA, Horiba, Japan). Morphology and elemental mapping of the sample was examined by transmission electron microscopy (TEM, JEOL JEM-ARM200F) and energy dispersive X-ray analysis (EDX, JEOL JED-2300). The local structure of C atoms of the sample was examined by C K-edge electron energy loss spectroscopy (EELS, GATAN Enfinium). The impedance of each sample was measured using a frequency response analyzer (SI 1260, Solartron Analytical), covering a frequency range from 0.1 Hz to 1 MHz with an applied voltage of 10 mV, after the sample powder was cold-pressed into a pellet with 10 mm diameter and 0.7 mm thickness. The valence state and local structure of S atoms for the sample electrodes were examined by S K-edge X-ray absorption fine structure (XAFS) measurements, which were carried out at the soft X-ray double crystal monochromator beamline, BL-10 of the Synchrotron Radiation Center, Ritsumeikan University.17 The total electron yield (TEY) method was used and the incident X-ray beam was monochromatized with a Ge(111) crystal (2d = 6.532 Å) pair. The photon energy was calibrated with the strong resonance of K2SO4 (S 1s → t2) appearing at 2481.7 eV.18 S, Li2S, and H2NCSCSNH2 (dithiooxamide; rubeanic acid) were used as references. All the samples were sealed in an argon-filled transfer vessel.17
The electrochemical lithiation/delithiation reactions were carried out using lithium coin-type cells. The working electrode consisted of a mixture of a 10 mg SAC sample and a 5 mg acetylene black (AB) powder with a 0.5 mg Teflon powder pressed into a 15 mm diameter tablet under a pressure of 10 MPa. The electrochemical test cell was constructed in a stainless steel coin-type configuration. The negative electrode was a 15 mm diameter and 0.2 mm thick disk of Li foil, and a separator was a microporous polyolefin sheet. The solution of 1 M LiPF6 in a 50: 50 mixture of ethylene carbonate (EC) and dimethylcarbonate (DMC) by volume (Tomiyama Pure Chemical Industries Ltd., battery grade) was used as the electrolyte. Each cell was assembled in an argon-filled globe box, and the electrochemical measurement was carried out at 30°C initially with discharging, after standing overnight on open circuit, using a TOSCAT-3100 (Toyo System) at a current density of 30 mA·g−1 between 3.0 and 1.0 V. The amount of sulfur dissolved in the electrolyte was measured by ion chromatography (ICA2000, DKK-Toa Co.) after the initial cycling of the cell.
Results and Discussion
The obtained SAC samples were black in color irrespective of the initial primary alcohol (1-CnH2n+1OH; n = 5–10), and the XRD patterns showed no significant peaks, similar to the previously reported SPAN.11,13,16 Figure 1a shows the typical high resolution TEM micrographs for the SAC (n = 9) sample. The sample powder consisted of the agglomerated particles with the size of several tens nanometers, and any lattice fringes originated from the long-range ordering of the constituent atoms were not observed even in the most enlarged scale, indicating that the sample was in an amorphous state. The EDX mapping, Fig. 1b, showed that carbon and sulfur were homogeneously distributed throughout the sample.
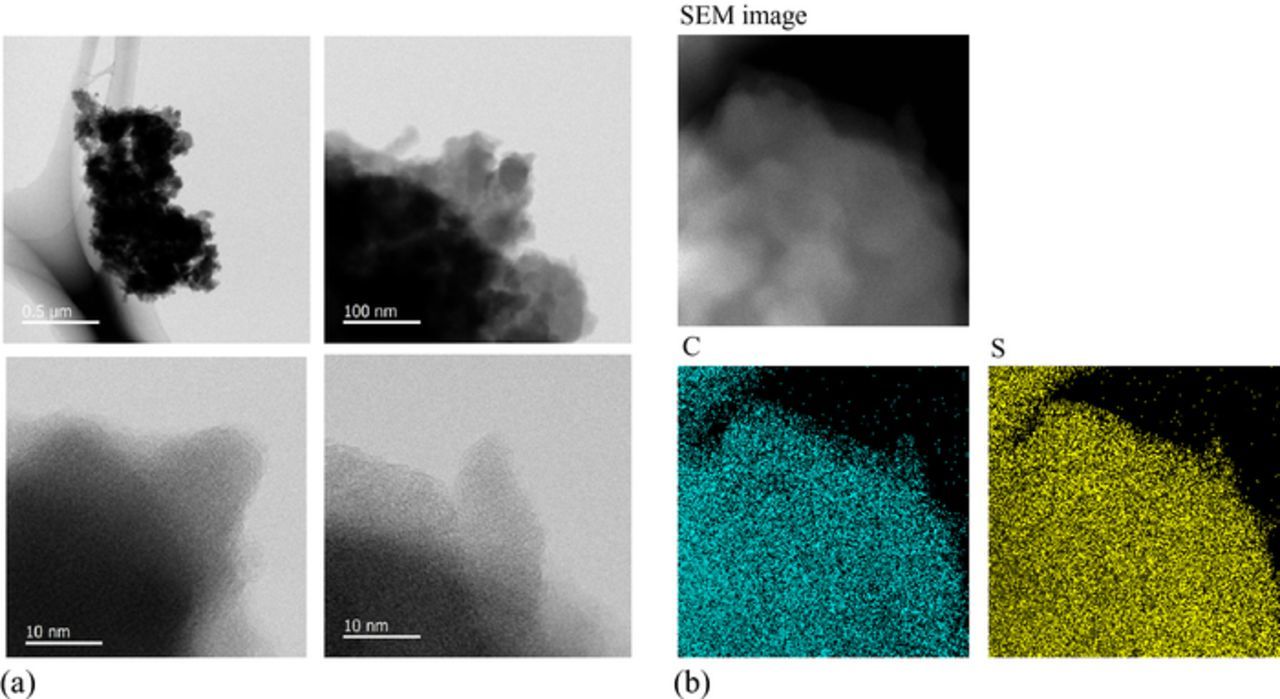
Figure 1. (a) High resolution TEM images and (b) elemental mappings of C and S atoms by EDX for the SAC (n = 9) sample.
Figure 2 shows the typical C K-edge EELS spectrum for the SAC (n = 9) sample, as well as the spectra for amorphous carbon, graphite, and diamond for comparison. The SAC sample showed similar spectrum to that of amorphous carbon. This is consistent with the above-mentioned high resolution TEM observation. Two characteristic peaks, assignable to π* and σ* bands,19 indicate that the C–C bonds in the SAC sample consisted of both sp2 and sp3 components. Since the C–C bonds in the initial primary alcohol consisted of only sp3 components, some graphitization proceeded partly in the SAC sample during the refluxing reaction, resulting in the formation of sp2 components partly in the SAC samples.
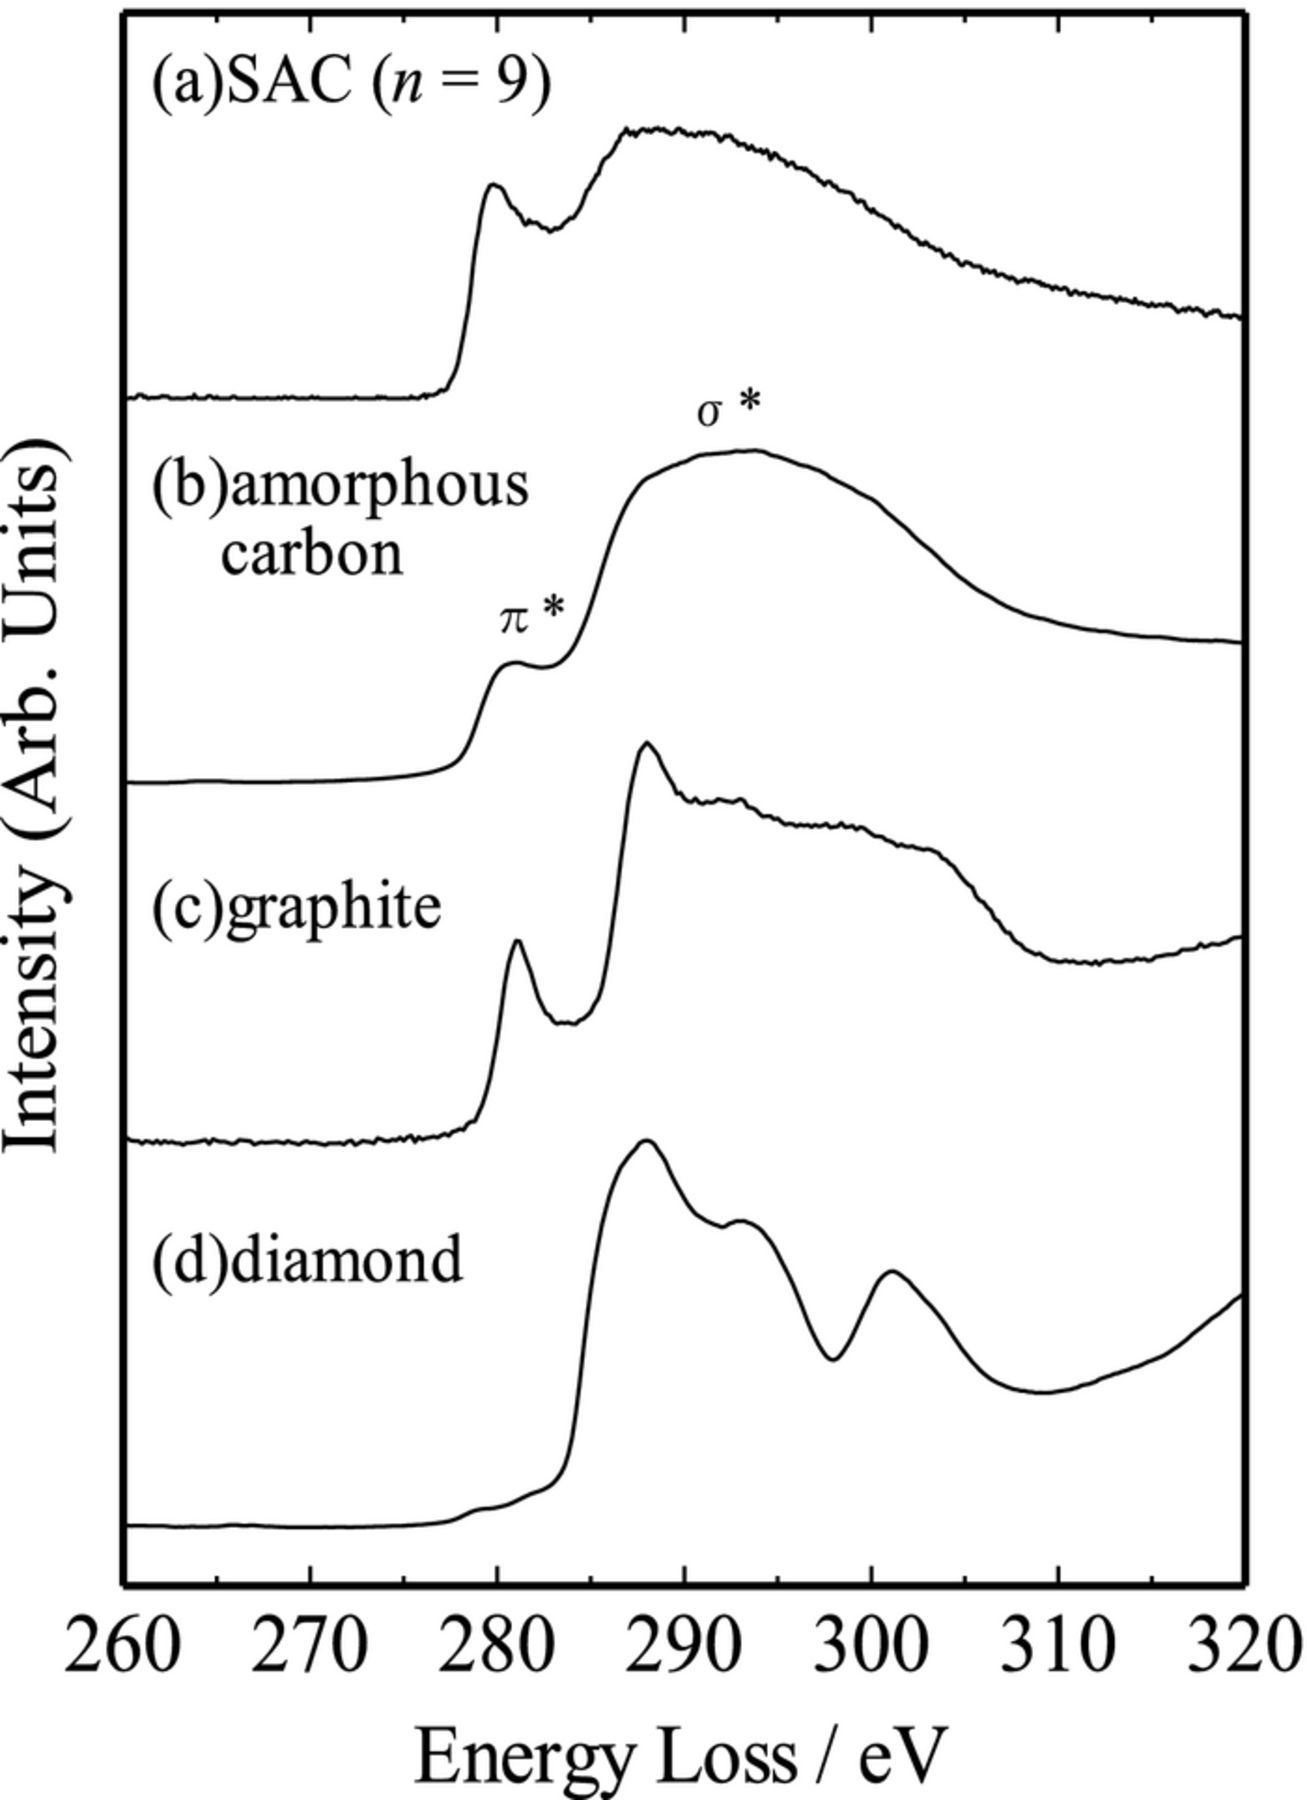
Figure 2. K-edge EELS spectrum for the SAC (n = 9) sample. Amorphous carbon, graphite, and diamond were used as references.
Table I lists the elemental contents (C, S, H, N, and O), estimated by combustion analyses, in the SAC (n = 5–10) samples. Typical data for SPAN samples11,14 were also listed as references. The SAC samples contained C (33–37 wt%), S (60–66 wt%), and H (0.2–0.4 wt%), and their amounts seemed nearly no dependence on the initial primary alcohol. Although the reaction pathway was not clarified, partial graphitization proceeded during the refluxing reaction might require given numbers of carbon and sulfur atoms to form the present organosulfur compounds, and the extra carbon and sulfur might be vaporized to be removed from the reaction mixture. Indeed, electrochemically active organosulfur compounds often consisted of specified components such as 5- and/or 6-membered sulfur-containing cyclic hydrocarbons,12 and such components would also construct partly the present SAC samples, thereby containing similar amounts of sulfur and carbon irrespective of the starting primary alcohol. The sulfur contents were larger than that of SPAN samples (44–53 wt%),11,14,15 suggesting that the SAC sample cells were anticipated to show higher electrochemical capacity. And the N contents, which were less than the detection limit, make a clear contrast to the SPAN samples (10–13 wt%), where sulfur atoms were uniformly distributed in a carbon host composed of N-containing graphene structure (polyacrylonitrile).11,14,16 This is suggestive of the different carbon host in the SAC sample; the initial organic compound (primary alcohol or acrylonitrile) would be responsible for the structure of the carbon host, as well as the sulfur content, in the S-C composite.
Table I. Elemental contents (carbon, sulfur, hydrogen, nitrogen, and oxygen; wt%), estimated by combustion analyses, in the SAC samples (n = 5–10). Typical data for SPAN samples11,14 were also listed as references.
| Sample | C | S | H | N | O |
|---|---|---|---|---|---|
| SAC (n = 5) | 34.89 | 62.61 | 0.23 | 0.00 | 0.00 |
| SAC (n = 6) | 33.84 | 66.06 | 0.20 | 0.00 | 0.00 |
| SAC (n = 7) | 36.24 | 63.29 | 0.28 | 0.00 | 0.00 |
| SAC (n = 8) | 34.39 | 65.72 | 0.39 | 0.00 | 0.00 |
| SAC (n = 9) | 36.34 | 60.59 | 0.31 | 0.00 | 0.00 |
| SAC (n = 10) | 37.22 | 62.20 | 0.45 | 0.00 | 0.00 |
| SPAN11 | 30.92 | 53.41 | 0.89 | 10.73 | - |
| SPAN14 | 35 | 51 | 0.5 | 13 | 2.5 |
Thermal stability of the SAC samples was examined by TG-DTA measurements. As shown typically in Fig. 3, the SAC sample showed no weight loss until ca. 350°C and began to decompose above it. And the DTA curve showed no endothermic peak originated from the melting of elemental sulfur, indicating that the SAC sample contains no isolated elemental sulfur; principally the sulfur atoms would make some covalent bonds with carbon or sulfur atoms in the SAC samples.
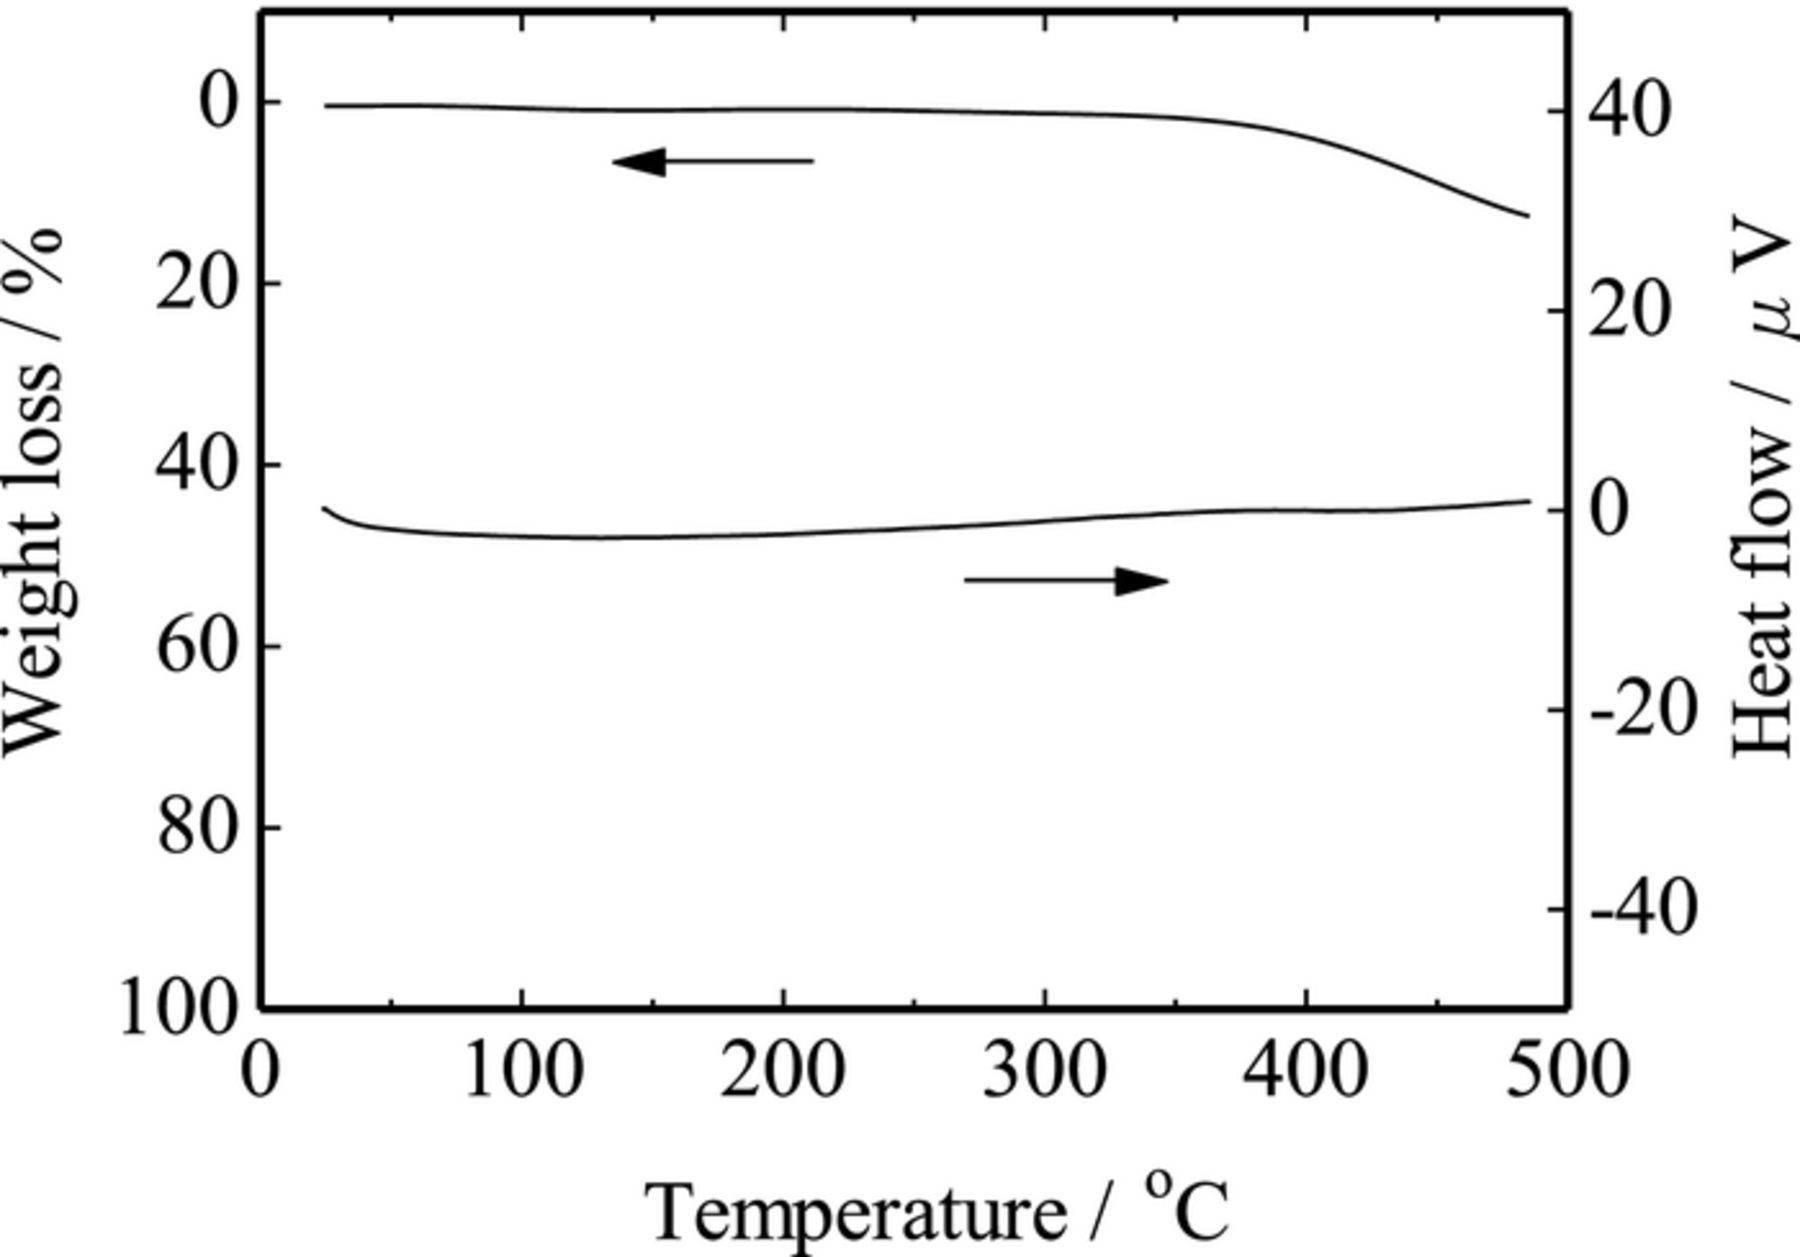
Figure 3. G-DTA curve for the SAC (n = 9) sample.
The structural differences were also examined by Raman and XAFS measurements. Figure 4a showed the Raman spectra for the SAC (n = 5–10) samples. The spectrum for the SPAN sample was also shown for comparison. The SAC samples showed similar spectra irrespective of the initial primary alcohol, suggesting that the SAC samples were very similar each other. This is consistent with the results of the elemental contents listed in Table I. Rather weak, broad peaks at 380 and 470 cm−1, which were also observed in the SPAN sample, were assigned to S–S deformation and C–S stretching vibrations,13,14 respectively, indicating the presence of S–S and C–S bonds in the SAC samples. These chemical bonds would be formed by the refluxing reaction of elemental sulfur and primary alcohol. The most significant difference between the SAC and SPAN sample spectra was the carbon D and G bands around 1000–1700 cm−1. This is indicative of the different structure of the carbon host in these S-C composites. For clarifying the carbon structure, we applied a standard peak deconvolution procedure; four Gaussian-Lorentzian bands were necessary to account for the observed Raman features with minimum error.20 These four bands were located at 1194, 1347, 1510, and 1585 cm−1, which were assigned to the tetrahedral carbon (D-band sp3), the A1g mode associated with the breakage of symmetry occurring at the edges of graphite sheets (D-band sp2), the sp3-type material (G-band sp3), and the E2g graphite mode (G-band sp2), respectively.20 As shown in Fig. 4b, the C–C bonds in the SAC samples mainly consisted of the G-band sp3 component, as well as minor contribution from the G-band sp2 and D-band sp3 components. This makes a clear contrast to the SPAN sample, where C–C bonds mainly consisted of the D- and G-band sp2 components. Such difference would be originated from the degree of graphitization of the initial organic compound; acrylonitrile is easily graphitized by the thermal treatment under the reduced atmosphere, resulting in the formation of S-C composite with mostly sp2-type carbon configuration,16 while the primary alcohol gave rise to the S-C composite with mainly sp3-type carbon configuration.
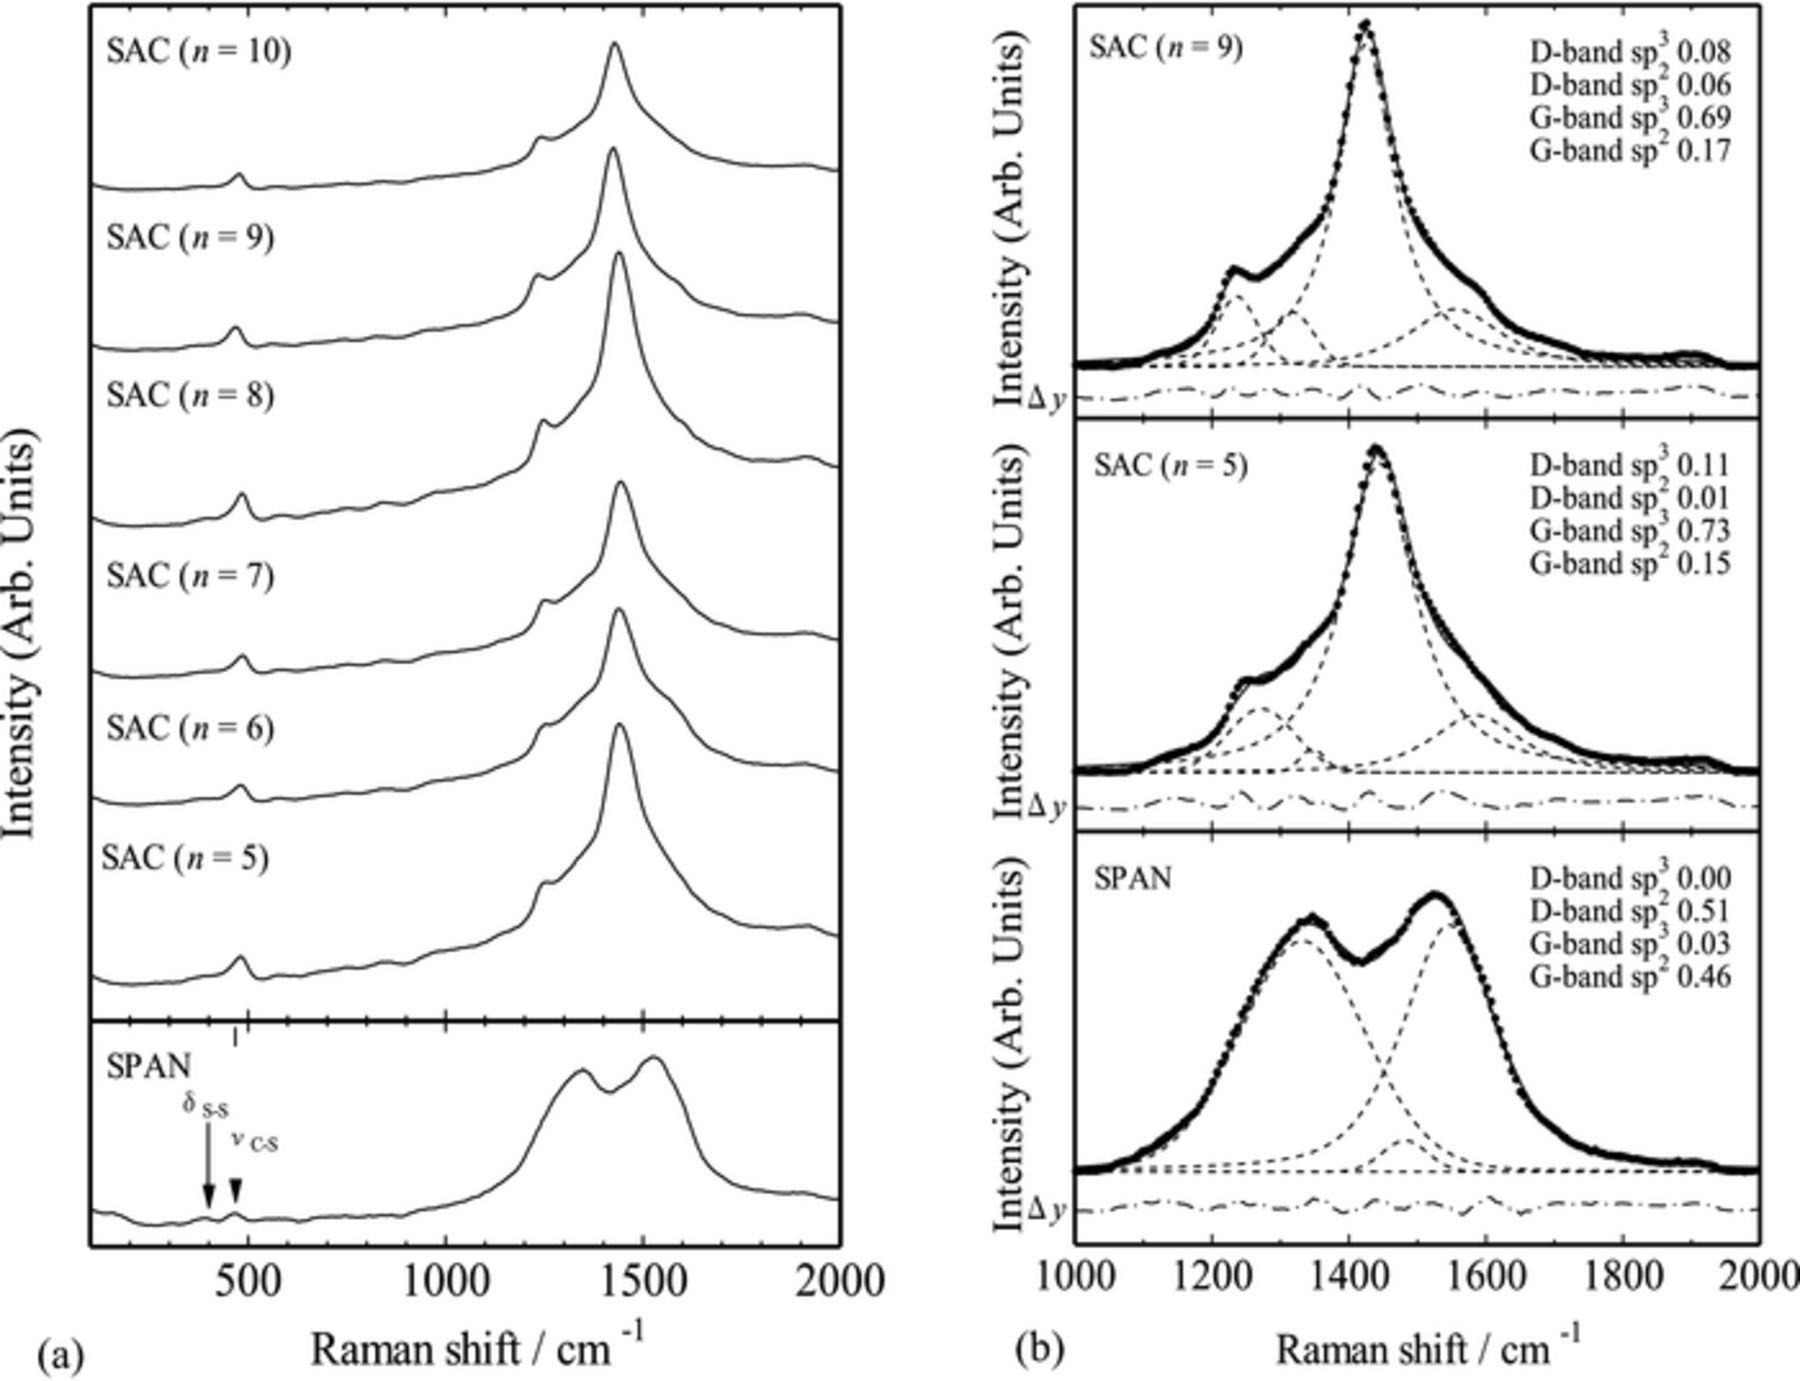
Figure 4. (a) Raman spectra for the SAC (n = 5–10) samples. SPAN was used as reference. (b) Deconvolution of the carbon D and G bands into four Gaussian-Lorentzian bands (dashed lines) for the SAC (n = 5 and 9) and SPAN samples (• measured). The differences between the measured and the calculated data are shown as dotted-dashed lines.
XAFS spectra also exhibited the difference between the SAC and SPAN samples. Figure 5 shows the S K-edge X-ray absorption near-edge structure (XANES) spectra for the SAC (n = 5, 7, 9) and SPAN samples, as well as those of S, Li2S, and H2NCSCSNH2 (dithiooxamide; rubeanic acid) for comparison. The SAC samples showed similar XANES spectra irrespective of the initial primary alcohol, and they were different from that of the SPAN sample. This is indicative of the similar local structures around S atoms in the SAC samples, and they were different from that of the SPAN sample. The XANES spectra of the SAC samples showed characteristic absorption peaks at 2469, 2472, and 2473 eV. By comparing with the reference spectra and the previous reports,21–23 these peaks could be assigned to the S 1s → π* resonance in the S=C double bond, S 1s → 3p electronic transition in the S–S bond, and the S 1s → σ* resonance in the S–C bond, respectively. Relatively higher intensity at 2473 eV and lower intensity at 2469 eV for the SAC samples, as compared with those for the SPAN sample, might suggest the reduced amounts of π-conjugated S=C double bond in the SAC samples. Since the carbon host in the SPAN sample consisted of mostly sp2 components, sulfur atoms might be incorporated partly in the π-conjugated carbon network (graphene cluster) to form –C=C–C=S bond in the SPAN sample, while such π-conjugated network would be less developed in the SAC samples.
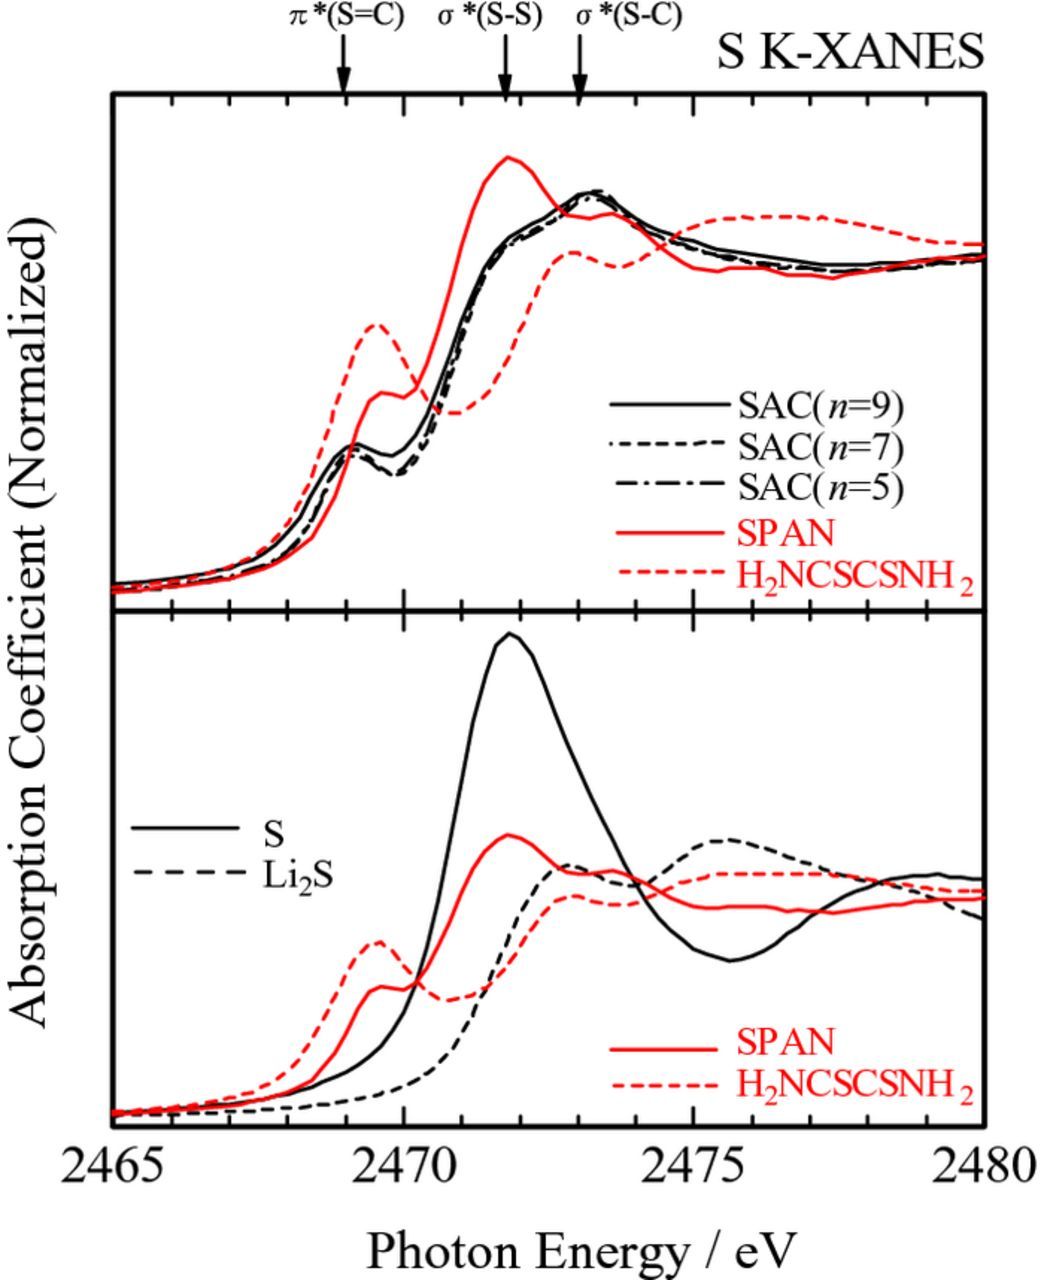
Figure 5. S K-edge XANES spectra for the SAC (n = 5, 7, 9) and SPAN samples. S, Li2S, and H2NCSCSNH2 (dithiooxamide; rubeanic acid) were used as references.
The charge and discharge curves for the SAC (n = 5, 7, 9) sample cells are shown in Fig. 6a. Each sample cell showed relatively higher discharge capacity of ca. 900–1000 mAh·g−1 on the basis of the mass of the SAC (that is, normalized by the total weight of the composite active material, which corresponds to ca. 1400–1600 mAh·g−1-S on the basis of the mass of sulfur only), irrespective of the initial primary alcohol, and it is larger than that of the SPAN sample cell (ca. 600–800 mAh·g−1).11,13–15 Relatively higher discharge capacity would be originated from the higher sulfur contents as compared with that of the SPAN sample, as listed in Table I. Although there observed large irreversible capacity (ca. 200–300 mAh·g−1) in the first cycling, the SAC sample cells showed relatively lower cycle degradation thereafter, as shown in Fig. 6b; the capacity retention after the 50th cycling was ca. 82% against the second cycling.
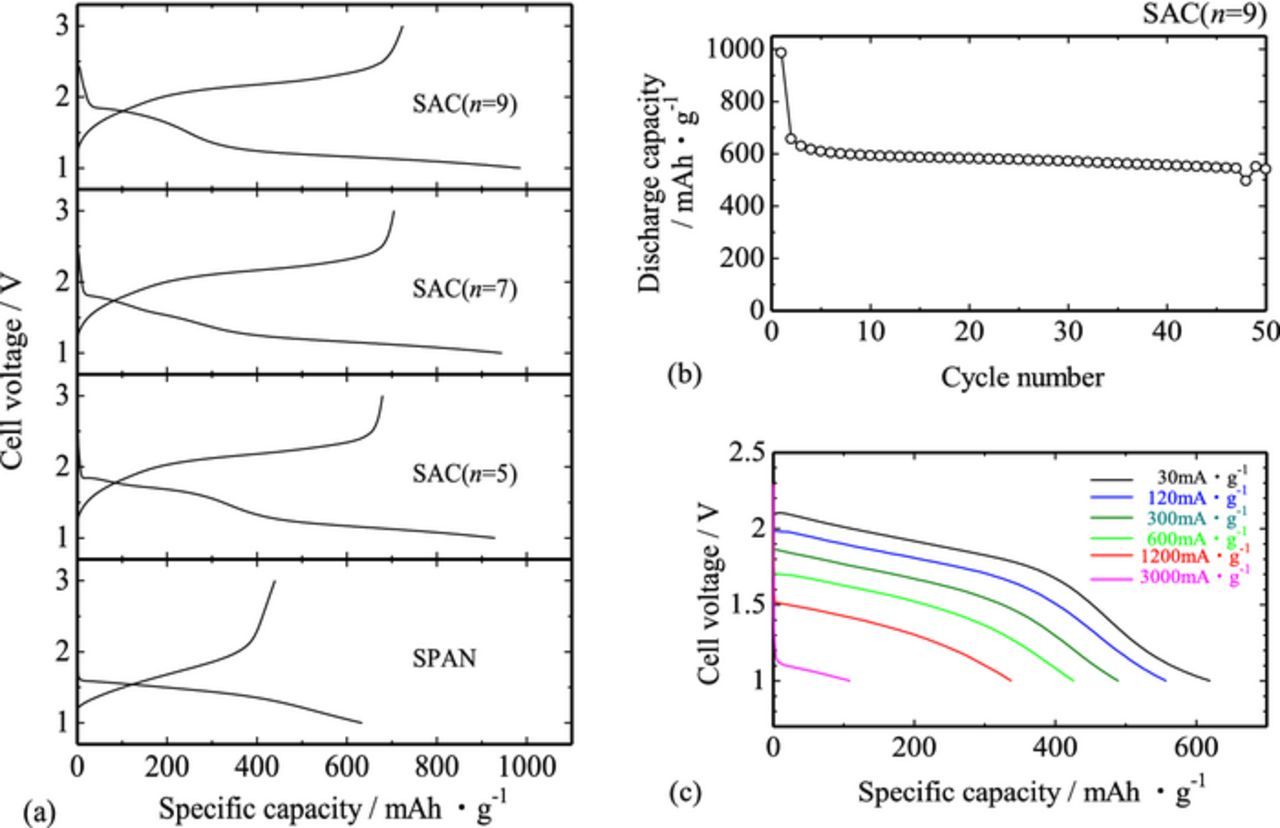
Figure 6. (a) Charge and discharge profiles for the SAC (n = 5, 7, 9) sample cells at 30 mA·g−1. The specific capacity was calculated on the basis of the mass of the SAC. Corresponding profiles for the SPAN sample cell are also shown for comparison. (b) Cycle capability for the SAC (n = 9) sample cell at 30 mA·g−1. (c) Rate capability for the SAC (n = 9) sample cell. The measurement was carried out after 5 cycles at 30 mA·g−1.
According to the previous report,20 higher utilization of the positive electrode material was attained for the decreased Raman intensity ratio of sp3 / sp2 coordinated carbon in the carbon-coated LiFePO4 electrode cells. This trend can be interpreted in terms of the increased amount of larger graphene clusters in the very disordered carbon structure, and consequently, improved electronic conductivity of the carbon deposit.20 The SAC samples, of which carbon host consisted of mainly sp3 components, showed indeed relatively low electronic conductivity (ca. 10−8–10−9 S·cm−1), but the sample cells showed relatively higher discharge capacity, Fig. 6a. This "inconsistency" would be partly because the cell electrode contained higher amounts of AB (ca. 33%), as well as partly because the SAC samples consisted of very fine particles, Fig. 1a, which enables the Li+ migration path to the particle surface shortened to improve the utilization of the active material. Indeed, the SAC (n = 9) sample cells with 33% AB content showed comparable rate capability to that of the previously reported SPAN sample cells,13,14 as shown in Fig. 6c, but the SAC (n = 9) sample cells with reduced AB content (ca. 10%) showed very low discharge capacity (less than 400 mAh·g−1) at 30 mA·g−1. Therefore, the SAC samples have intrinsically superior electrochemical properties due mainly to their higher sulfur content and fine particle size, and such properties could be appreciated under the extrinsically conductive assistance.
The charge / discharge mechanism of the SAC sample was examined by ex-situ XAFS measurements. Figure 7a shows the XANES spectra for the SAC (n = 9) sample electrodes before electrochemical tests and after the 1st and 2nd cycling. After the initial discharge, the peak at 2469 eV decreased in its intensity, suggesting the breakage of S=C double bond to be replaced by –S (Li+) –C– single bond. Since the peak intensity at 2469 eV was nearly unrecovered thereafter, this breakage seemed an irreversible reaction; the S=C double bond, which was not incorporated in the π-conjugated carbon network in the SAC samples, would irreversibly change to S–C single bond after the initial lithiation reaction. Although the detailed structural change was not confirmed, one plausible model might be schematically illustrated as follows;
![Equation ([1])](https://content.cld.iop.org/journals/1945-7111/164/1/A6288/revision1/A6288equ1.jpeg)
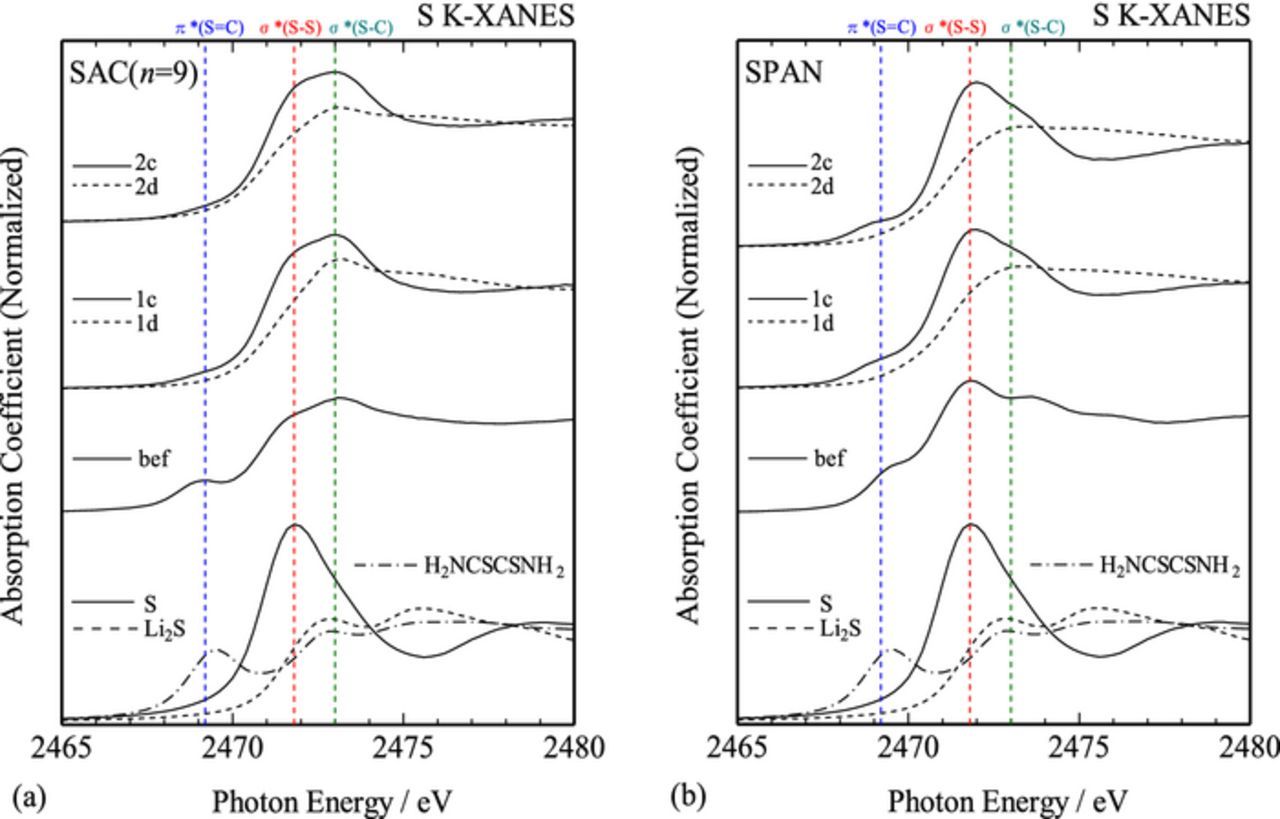
Figure 7. K-edge XANES spectra for the (a) SAC (n = 9) and (b) SPAN sample electrodes before electrochemical tests and after the 1st and 2nd discharge and charge cycling. S, Li2S, and H2NCSCSNH2 were used as references.
This irreversibility would be responsible for the relatively large irreversible capacity in the first cycling, Fig. 6a. We also checked the dissolution of the SAC sample as polysulfide species in the electrolyte during the initial cycling, and the measured sulfur content in the electrolyte was below the detection limit (less than 20 ppm, corresponding to less than 0.3% of the mass of the SAC). This signifies that the sulfurization of alcohol was effective in suppressing the polysulfide dissolution, and the initial irreversibility was not attributed to the dissolution of the SAC. This would be due to the absence of the isolated elemental sulfur in the SAC samples, revealed by the DTA measurement, Fig. 3. In the subsequent charge and discharge, the peaks at 2472 and 2473 eV changed their intensities reversibly, suggesting the delithiation/lithiation reactions at S–C and S–S single bonds.22 Although the detailed mechanism could not be confirmed, the following charge/discharge reaction might be occurred partly in the SAC sample;
![Equation ([2])](https://content.cld.iop.org/journals/1945-7111/164/1/A6288/revision1/A6288equ2.jpeg)
On the other hand, the SPAN sample showed rather different XANES spectra, Fig. 7b. The peak at 2469 eV was still evident after the 1st cycling, suggesting that the S=C double bond was recovered after the delithiation/lithiation reactions. Such higher reversibility would be because the S=C bond in the SPAN sample was incorporated in the π-conjugated carbon network. Although further investigation is still needed, the following electrochemical reaction might be occurred partly in the SPAN sample;
![Equation ([3])](https://content.cld.iop.org/journals/1945-7111/164/1/A6288/revision1/A6288equ3.jpeg)
Thus, in the SPAN sample, more amounts of sulfur atoms might be incorporated in the π-conjugated carbon network, and such structural feature gave rise to the different structural change for lithiation/delithiation reactions, resulting in the different charge/discharge profiles, as shown in Fig. 6a.
Acknowledgment
This work was financially supported partly by "Next-generation storage battery material evaluation technology development" project from the New Energy and Industrial Technology Department Organization (NEDO) in Japan.