Abstract
The growth of 3D printing has opened the scope for designing microstructures for solid oxide fuel cells (SOFCs) with improved power density and lifetime. This technique can introduce structural modifications at a scale larger than particle size but smaller than cell size, such as by inserting electrolyte pillars of ∼5–100 μm. This study sets the minimum requirements for the rational design of 3D printed electrodes based on an electrochemical model and analytical solutions for functional layers with negligible electronic resistance and no mixed conduction. Results show that this structural modification enhances the power density when the ratio keff between effective conductivity and bulk conductivity of the ionic phase is smaller than 0.5. The maximum performance improvement is predicted as a function of keff. A design study on a wide range of pillar shapes indicates that improvements are achieved by any structural modification which provides ionic conduction up to a characteristic thickness ∼10–40 μm without removing active volume at the electrolyte interface. The best performance is reached for thin (<∼2 μm) and long (>∼80 μm) pillars when the composite electrode is optimised for maximum three-phase boundary density, pointing toward the design of scaffolds with well-defined geometry and fractal structures.
Export citation and abstract BibTeX RIS

This is an open access article distributed under the terms of the Creative Commons Attribution 4.0 License (CC BY, http://creativecommons.org/licenses/by/4.0/), which permits unrestricted reuse of the work in any medium, provided the original work is properly cited.
Many studies in the literature have recognised the importance of the electrode microstructure in affecting the power density and the lifetime of solid oxide fuel cells (SOFCs).1–7 Significant enhancements in power density have been achieved through the statistical control of the microstructural properties by tuning porosity,8,9 volume fractions,2,8,10 particle size11–13 and even tortuosity of the phases.14 However, nowadays the design of the electrode microstructure can be optimised with unprecedented precision through the advent of 3D printing and additive manufacturing techniques.15–17
Additive manufacturing allows for the development of electrodes with 3D architectures, thus going beyond what conventional fabrication techniques, such as tape casting and screen printing, can produce. The exploitation of 3D additive manufacturing has been successfully applied by the battery community18–20 and the implementation of this approach to SOFCs is currently under investigation.15,21 One of the most promising applications consists of the insertion of ion-conducting pillars connected to the electrolyte15,22–25 as reported in Figure 1. Such a modification can be regarded as the mesoscale structural control of electrode microstructure, where the term mesoscale here refers to a dimension larger than the typical constituent particle size (<1 μm) but smaller than the characteristic length of the cell, that is, falling in the order of 5–100 μm.26 Ideally, 3D printing offers the opportunity to controllably manufacture pillars of any shape, with the desired geometric and spacing requirements, in order to provide a preferential pathway for ionic conduction.22,25 It is important to note that this mesoscale modification differs from the corrugation of the electrolyte,16,27 such as in the mono-block-layer built (MOLB) design,26,28 where any enhancement in power density is due to the increase in the geometric electrode-electrolyte interfacial area per unit of planar projected area.
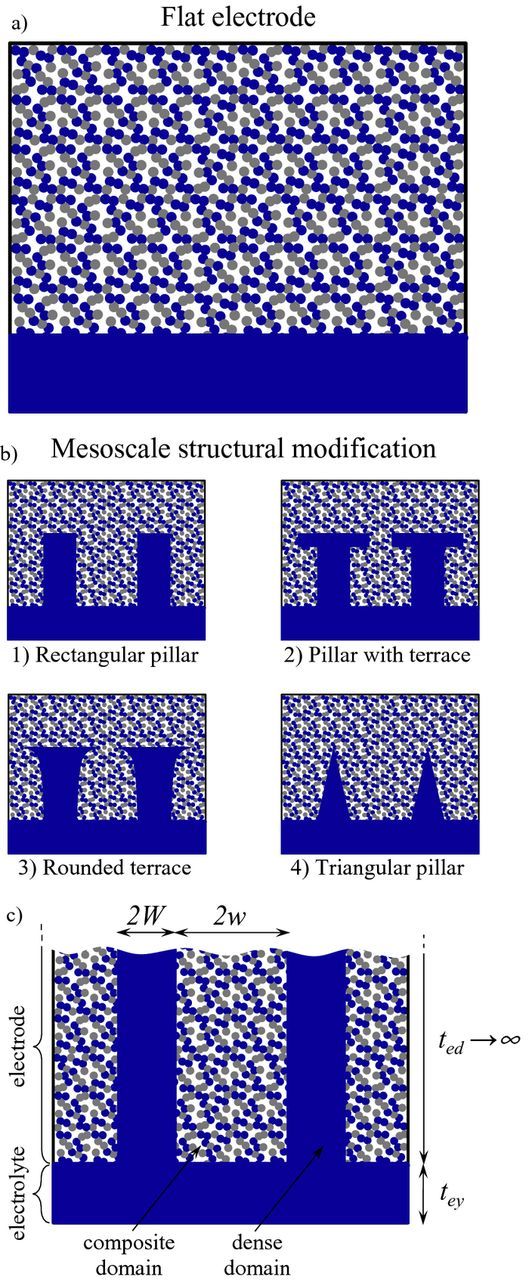
Figure 1. Concept of mesoscale structural modification. a) Flat electrode configuration, consisting of a porous composite electrode deposited onto a flat electrolyte. b) Mesoscale structural modification, consisting of ion-conducting pillars of different shapes connected to the electrolyte. c) Mesoscale structural modification in the limit case of semi-infinite electrode thickness. The ion-conducting phase is reported in blue, the electron-conducting phase in gray, the porous phase in white.
In the past, several experimental approaches have been adopted to produce a mesoscale structural modification as those reported in Figure 1b. Dai et al.29 reported a simple method which enables the production of dimples by spray depositing a slurry consisting of electrolyte particles and 20 μm microspherical pore formers. The method is simple and inexpensive, but it allows only for a coarse statistical control of the structural modification by varying the pore former content in the slurry. A more accurate design of the electrode-electrolyte interface was reported by Konno et al.,24 who realized deep grooves (about 200 μm * 200 μm) via a blasting method into a thick electrolyte. This technique was improved by Nagato et al.,30,31 who used an excimer laser to produce trenches and pillars 5–40 μm wide. However, nowadays much wider possibilities in producing complex architectures have been opened by 3D printing as recently reported by Farandos et al.15 who used inkjet 3D printing to grow cylindrical pillars with minimum feature resolution of 35 μm in plane and 1.2 μm in height.
These experimental activities have been followed by modelling studies. Konno et al.24 reported a 2D numerical model, solving the mass and charge conservation equations in idealised structures with rectangular grooves. Their simulation results were in qualitative agreement with the experimental electrochemical data. A similar model was adopted by Delloro and Viviani22 and by Geagea et al.,23 who focused on pillar shape and on the operational regimes for which the mesoscale structural control has beneficial effects on the electrode performance. More recently Shimura et al.25 performed a three-dimensional numerical simulation to assess the effect of a pillar, virtually inserted into tomographic data, on the local nickel connectivity and three-phase boundary (TPB) distribution.
Despite these seminal studies, there is still a lack of fundamental understanding in this area. For example, a proper performance indicator to compare flat and structurally-modified electrodes has not yet been defined. Moreover, the fundamental reasons why the mesoscale structural modification i) enhances the power density, ii) for what microstructural architectures it is beneficial, and iii) how the shape and geometric characteristics of the pillar can be rationally designed have not been comprehensively addressed yet. This is particularly important because modelling is expected to guide the electrode design and to set the minimum requirements for the next generation of 3D printing and other manufacturing techniques.15,16,21,27
In this paper, a mathematical model is proposed in the Modelling section to provide guidelines for the rational design of the mesoscale structural modification of SOFC electrodes. The model is kept as simple as possible to get analytical solutions whenever possible, which are helpful to predict the upper bounds of performance and relate them to the microstructural properties of the composite electrode. In addition, a comprehensive numerical study on the pillar shape and geometry provides indications on how to intelligently design the pillars (Results and discussion section). The conclusions of the study, along with the connection with practical applications, are summarised in the Conclusion section.
Modelling
The model takes into account only the most significant electrochemical phenomena occurring within the functional layer of a SOFC porous composite electrode.
Consider a classic porous anode made of a homogeneous mixture of electron-conducting particles (e.g., Ni) and ion-conducting particles (e.g., yttria-stabilized or scandia-stabilized zirconia, YSZ and ScSZ, respectively) placed on the top of an electrolyte as in Figure 1a. Both the fuel and electronic current enter the anode from the top surface, moving through the pores and the connected electronic paths, respectively (note that the sign of the current is conventionally taken as opposite to the electron and ion flow). The electronic current is converted into ionic current at the three-phase boundaries (TPBs) spread within the electrode.32,33 The ionic current is carried by the ion-conducting particles dispersed within the electrode and reaches the electrolyte, where current is then transferred to the cathode. No electrochemical reaction occurs within the dense electrolyte phase.
The electrochemical model, developed in the next section, mathematically describes the transport and conversion of current within the electrode and the electrolyte according to the following assumptions based upon well-established behaviors from the literature:
- steady-state conditions;
- uniform temperature;22,26
- no mixed ionic-electronic conduction in each solid phase. In addition, the electronic conductivity of the electron-conducting phase is neglected, being several orders of magnitude larger than the ionic conductivity of the electrolyte phase (i.e., σe >> σO);22,34,35
- the charge-transfer reaction occurs at the percolating TPBs distributed within the composite electrode volume. The kinetic expression relating the current density to the activation overpotential is linearised35,36 in order to obtain an analytical solution of the model for flat electrodes (see Analytical solution for a flat electrode section);
- the gas transport in the stagnation layer and within the pores is neglected since the contribution of concentration losses is generally minor within the functional layer of electrodes.35–39 For example, for the anodes considered in this study, this assumption holds for pores larger than 0.1 μm and porosity larger than 30%: in the worst case scenario, the current would be ∼2% lower when considering gas transport for a 20 μm-thick flat functional layer;
- the microstructure of the composite electrode domain is not explicitly resolved and is regarded as a continuum,22,34,40 characterized by its effective microstructural properties (i.e., the TPB density and the effective ionic conductivity factor) which are determined with appropriate microstructural models12,41 or tomographic reconstruction;42–44
- only a 2D cross section is simulated to reduce the computational requirements of the numerical model22,24,26,35 although the mesoscale structural modification may have a three-dimensional geometry. This choice does not affect the general trends predicted by the model, so that the dimensionless output is readily transferable to 3D structures of the same nature (see Rectangular pillars section for the verification of this assumption).
Incidentally, these assumptions may make the model look similar to the fin model developed by Tanner et al.35 However, in Tanner et al. model the charge-transfer reaction is assumed to take place at the electrolyte interface without any contribution from the composite electrode domain, which makes their fin model more appropriate to simulate infiltrated electrodes45 rather than 3D manufactured electrodes.
Although model assumptions seem restrictive, in practice most of the electrodes commonly used in SOFC technology are consistent with these assumptions, such as Ni/YSZ and Ni/ScSZ anodes as well as LSM/YSZ cathodes (LSM stands for strontium-doped lanthanum manganite). A successful application of a similar modelling approach based on the same assumptions is reported by Bertei et al.39 for SOFC composite anodes. Therefore, with these assumptions the model is representative of the main electrochemical phenomena that determine the electrode performance in functional layers while being simultaneously simple enough to allow for a fundamental insight and, whenever possible, useful analytical solutions.
Model equations
The model is based on the continuity equation for the ionic current, solved in both the porous composite domain and the dense domain (see Figure 1c), as follows:
![Equation ([1])](https://content.cld.iop.org/journals/1945-7111/164/2/F89/revision1/d0001.gif)
The ionic current density iO is calculated according to the Ohm's law:33,34
![Equation ([2])](https://content.cld.iop.org/journals/1945-7111/164/2/F89/revision1/d0002.gif)
where VO and σO are the potential and ionic conductivity of the ion-conducting phase, respectively. keff represents the effective (or relative) conductivity factor of the ion-conducting phase within the composite domain. keff is defined as the ratio between the effective conductivity of the ionic phase and its bulk conductivity,9,46 that is, keff = σO,eff/σO. Sometimes keff is defined as the ratio between the volume fraction and the tortuosity factor of the ion-conducting phase in the composite domain,47,48 which is a definition equivalent to that adopted in this study. This dimensionless factor is always smaller than 1 and depends on the microstructural properties of the composite electrode, in particular on the volume fraction, connectivity, tortuosity and neck size of ion-conducting particles,49 while being independent of the bulk conductivity σO. Eq. 1 considers another microstructural parameter of the composite electrode domain, which is the TPB length density LTPB. The TPB density depends on porosity, composition and particle size of the composite domain.9,12,41
The current density per unit of TPB length iTPB in Eq. 1 is calculated according to a linear electrochemical kinetic expression:50
![Equation ([3])](https://content.cld.iop.org/journals/1945-7111/164/2/F89/revision1/d0003.gif)
where the term in brackets represents the activation overpotential while F, R and T are the Faraday constant, the gas constant and the absolute temperature, respectively. i0TPB is the exchange current density per unit of TPB length and represents the kinetic constant of the charge-transfer reaction. More generally, Eq. 3 represents a linear local current-voltage relationship, which is often more appropriate for SOFCs than a non-linear Butler-Volmer kinetic expression.51
The mathematical problem is closed by boundary conditions. Symmetric boundary conditions (i.e., no flux) are applied at the lateral boundaries. A no flux condition is applied at the top of the composite domain, indicating that the current enters the electrode in electronic form only. A Dirichlet boundary condition VO = –ηtot is applied at the bottom of the computational domain,22 representing the interface of the electrolyte with the cathode. Such a boundary condition sets the overpotential ηtot applied to the system composed by electrode and electrolyte. This set of equations and boundary conditions therefore implicitly ensures that the electronic current is completely converted into ionic current within the composite electrode domain.
A numerical solution of Eqs. 1–3 is required for complex 2D geometries as those represented in Figure 1b. The total current density itot converted within the electrode is numerically calculated by integrating for the ionic current density leaving from the bottom of the computational domain.35 Note that since model equations are linear in VO, itot scales linearly with ηtot.
Analytical solution for a flat electrode
In a flat electrode (Figure 1a), the ionic potential VO can be assumed uniform in each planar cross section48,52,53. In such a case, the mathematical problem represented by Eqs. 1–3 becomes one-dimensional, allowing for an analytical solution of the ionic potential along the thickness of the electrode as reported in other studies, for example, by Costamagna et al.36,54
The total current density iflattot is determined by considering the electrode resistance Red and the electrolyte resistance tey/σO in series as follows:
![Equation ([4])](https://content.cld.iop.org/journals/1945-7111/164/2/F89/revision1/d0004.gif)
where tey is the electrolyte thickness.
By solving Eqs. 1–3, the electrode polarisation resistance Red is equal to:
![Equation ([5])](https://content.cld.iop.org/journals/1945-7111/164/2/F89/revision1/d0005.gif)
where the minimum electrode resistance Rmin ed and the dimensionless Thiele modulus Γ are calculated as follows:
![Equation ([6a])](https://content.cld.iop.org/journals/1945-7111/164/2/F89/revision1/d0006.gif)
![Equation ([6b])](https://content.cld.iop.org/journals/1945-7111/164/2/F89/revision1/d0007.gif)
![Equation ([6c])](https://content.cld.iop.org/journals/1945-7111/164/2/F89/revision1/d0008.gif)
In Eq. 6b, ted is the electrode thickness while t*ed is the characteristic thickness of the coupled reaction/conduction process.55 Both the Thiele modulus and the characteristic thickness are typically defined in coupled reaction/diffusion problems in chemical engineering.36,56,57 In particular, the characteristic thickness t*ed depends on transport properties (σO), kinetic properties (i0TPB) and microstructural characteristics of the composite electrode (LTPB and keff), while being independent of the electrode thickness (note that the electrode thickness ted can arbitrarily be smaller, equal or larger than t*ed). The characteristic thickness t*ed can be regarded as the decay factor of the electrode resistance Red as a function of electrode thickness ted according to Eqs. 5 and 6b. More practically, t*ed is an indicator of the characteristic distance from the electrolyte interface required for electrochemical reaction and ionic conduction to take place in ideal conditions. For an ideal semi-infinite electrode (i.e., ted → ∞), which provides the upper bound of total current, the current converted within the characteristic thickness t*ed is equal to the 63.2% (i.e., 1–e–1) of the total current converted in the electrode.
Average approximation for semi-infinite electrodes with mesoscale modification
The analytical solution for a flat electrode reported in Eqs. 4–6 can be applied to estimate the resistance in the limit case of semi-infinite electrode thickness even for electrodes with mesoscale structural modification.
The geometric ratio ω is defined as:
![Equation ([7])](https://content.cld.iop.org/journals/1945-7111/164/2/F89/revision1/d0009.gif)
where W is the half-width of pillars and w is the half-distance between pillar walls, see Figure 1c. In the limit of ted → ∞, in 2D ω is equal to the volume fraction of pillars, while in 3D the volume fraction of pillars is equal to ω = W2/(W + w)2. In this condition the electrode can be regarded as a homogeneous continuum, with average microstructural properties, identified with a bar sign, evaluated as follows:
![Equation ([8a])](https://content.cld.iop.org/journals/1945-7111/164/2/F89/revision1/d0010.gif)
![Equation ([8b])](https://content.cld.iop.org/journals/1945-7111/164/2/F89/revision1/d0011.gif)
Eq. 8a indicates that the average TPB density  is weighted for the volume fraction of composite electrode domain 1–ω, that is, the volume fraction of electrode wherein the electrochemical reaction can take place. Similarly, the average effective conductivity factor of the ion-conducting phase
  is calculated according to the Wiener equation58,59, by averaging for the effective conductivity factor of the dense pillars, equal to 1, and the effective conductivity factor of the composite electrode domain, equal to keff.
These average microstructural properties are used to calculate approximate values of the electrode resistance and current density with mesoscale structural modification in the limit of semi-infinite thickness, as follows:
![Equation ([9a])](https://content.cld.iop.org/journals/1945-7111/164/2/F89/revision1/d0012.gif)
![Equation ([9b])](https://content.cld.iop.org/journals/1945-7111/164/2/F89/revision1/d0013.gif)
Eqs. 9a and 9b are formally equal to Eqs. 6a and 4, respectively, derived previously for a flat electrode, however with the use of the average microstructural properties  and
and  as defined in Eq. 8.
The values obtained from the application of Eqs. 7–9 are an approximate solution of the 2D model reported in the Model equations section. However, Eqs. 7–9 allow for a quick estimation of the current density by analytical means, providing also an accurate assessment of the upper bound of performance as discussed later.
Results and Discussion
Flat electrode: the benchmark
It is worth analysing the electrochemical performance of a flat electrode because any improvement provided by a mesoscale structural modification must be evaluated in comparison with the current density that a benchmark flat electrode would exhibit in the same conditions.
In this study, unless otherwise specified, the reference conditions for all the simulations are those reported in Table I. These conditions refer to the best porous composite Ni/ScSZ anode produced and tested by Somalu et al.,10 which showed the lowest polarisation resistance in a series of flat electrodes fabricated with different Ni volume fractions and porosities. The choice of materials, i.e., Ni and ScSZ, is particularly indicated for operation at intermediate temperature,60,61 which is set to 973 K. The thickness of the electrolyte, made of ScSZ, is set to 10 μm, which is typical for anode-supported planar SOFCs.2,32,62,63 Material-specific and microstructural properties were evaluated by Bertei et al.39 Although the absolute value of the results depends on the choice of this specific set of parameters, the emergent trends and the scaling laws discussed afterwards are general and highly applicable to a wide range of conditions and materials.
Table I. Reference conditions considered in all the simulations. These conditions refer to the best Ni/ScSZ composite anode produced by Somalu et al.,10 that is, the anode that showed the lowest polarisation resistance. Microstructural and material-specific parameters can be found in Bertei et al.39
| Parameter | Value |
|---|---|
| Operating conditions | |
| T | 973 K |
| ηtot | 0.1 V |
| Material-specific parameters | |
| i0TPB | 4.60·10−5 A m−1 |
| σO | 4.833 S m−1 |
| Microstructural parameters | |
| keff | 0.18 |
| LTPB | 3.8·1012 m m−3 |
| tey | 10·10−6 m |
Figure 2 shows the current density predicted by Eqs. 4–6 as a function of electrode thickness for a flat configuration. The current density monotonously increases as the thickness increases, approaching an asymptotic value iflat, asympttot in the limit of semi-infinite electrode thickness (ted → ∞).35 The Figure also reports the characteristic thickness t*ed, equal to 20.4 μm. Note that in a hypothetical electrode showing the same minimum electrode resistance Rmin ed with halved keff and doubled LTPB, the characteristic thickness t*ed is smaller by a factor 2 and equal to 10.2 μm, see the dashed line in Figure 2. Indeed, the minimum electrode resistance Rmin ed scales with  while the characteristic thickness t*ed scales with
  according to Eqs. 6a and 6c, respectively.
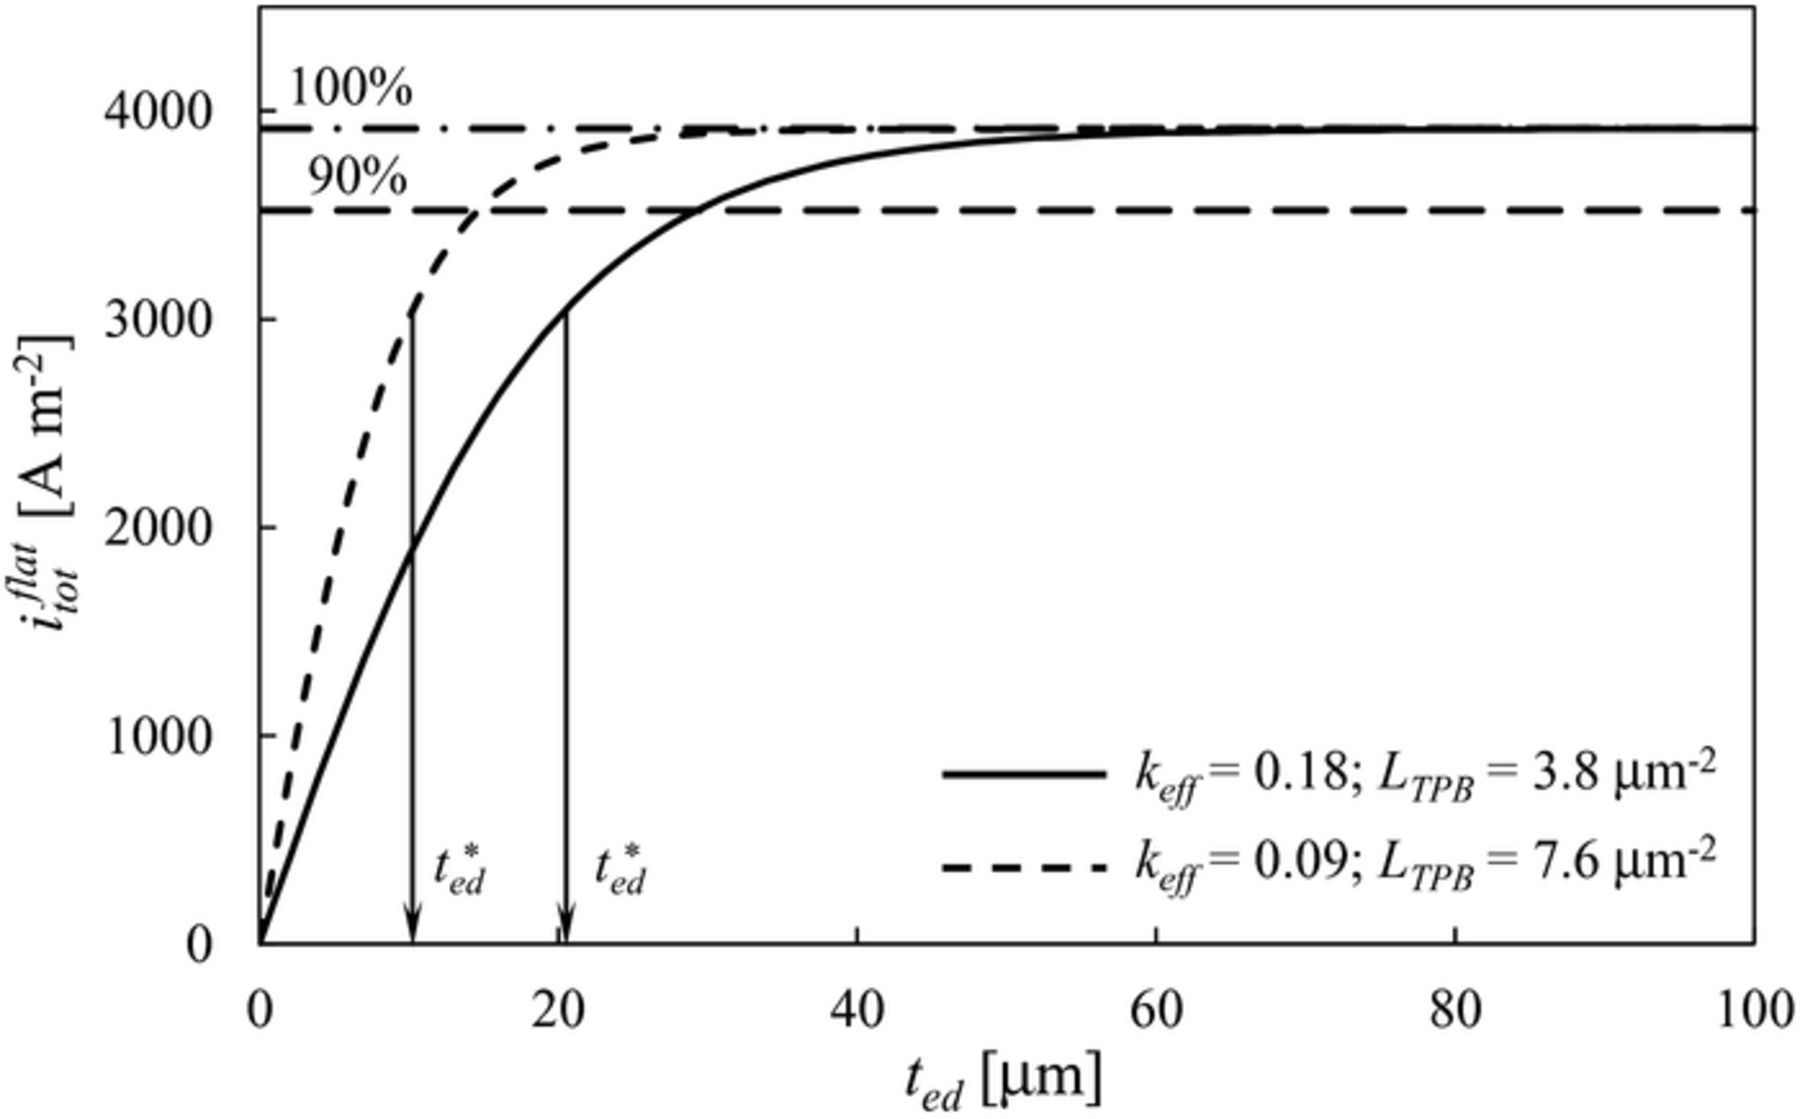
It is also interesting to note that, in the asymptotic limit, the electrolyte area specific resistance is tey/σO = 2.07·10−6 Ω m2 while the electrode polarisation resistance is equal to Rmin ed = 2.35·10−5 Ω m2. The ratio of the two resistances, equal to the fuel cell Biot number BiFC = (tey/σO)/Rmin ed as defined by Konno et al.,24 is equal to 0.088. This means that the dominant resistance is from the electrode, thus the whole cell performance would be significantly enhanced by focussing on the reduction of the electrode polarisation resistance, such as through a mesoscale structural modification.
Any improvements produced by a mesoscale structural modification of the electrode must be compared with a benchmark current density of the flat electrode evaluated in the same conditions. The asymptotic current density iflat, asympttot is a well-defined and unambiguous benchmark. Thus, the performance indicator proposed in this study to quantify the improvement due to mesoscale structural modification is the relative increase in current density δitot, defined as follows:
![Equation ([10])](https://content.cld.iop.org/journals/1945-7111/164/2/F89/revision1/d0014.gif)
where itot is the total current density produced in the electrode with mesoscale modification. Note that defining δitot in this way allows one to quantify any improvements against the maximum current density that a flat electrode can theoretically yield.
It is worth mentioning that such an asymptotic value iflat, asympttot is approached if electronic ohmic losses and gas transport limitations are neglected,9,35,36 as assumed in this study (see Modelling section). However, as the thickness increases, these assumptions are no longer met in real electrodes. This is not a problem for the practical application of Eq. 10: instead of the asymptotic current density iflat, asympttot, the 90% of its value might have been considered as a benchmark for the definition of the performance indicator δitot. As shown in Figure 2, the 90% of iflat, asympttot is met for relatively thin electrodes, where both electronic ohmic losses and gas transport limitations are typically negligible.36,64,37,39 Thus, the applicability of Eq. 10 can be extended by considering any desired benchmark value for the flat electrode, provided that such a benchmark is well-defined and kept constant. In this study, the asymptotic current density iflat, asympttot is used to quantify the relative improvement δitot according to Eq. 10 because, in such a case, δitot shows the improvement over the maximum current density that a flat electrode can ideally exhibit.
Rectangular pillars
The first mesoscale structural modification analyzed in this study is the insertion of rectangular pillars as in the first sketch in Figure 1b. Rectangular pillars have been tested in a few experimental studies.15,30 Figure 3a shows the computational domain in greater detail: th is the pillar thickness, W is the half-width and w is the half-distance between pillar walls.
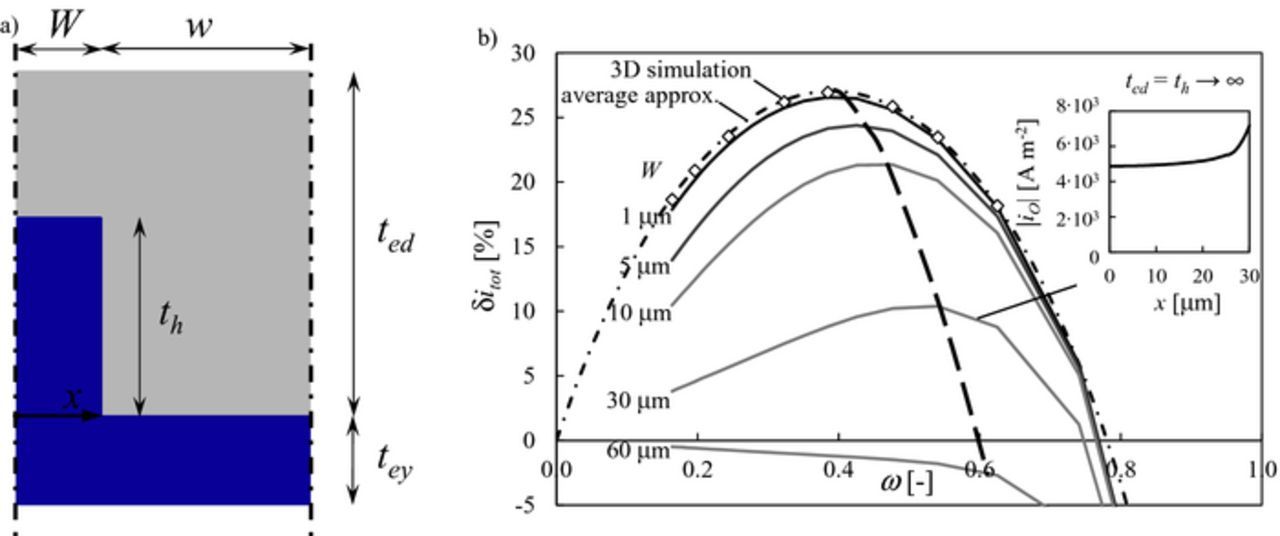
Figure 3. a) Geometry of the rectangular pillar: the dense electrolyte phase is reported in blue, the porous composite electrode is reported in gray. b) δitot as a function of the geometric ratio ω for different values of W in the limit of ted → ∞ and th → ∞ as obtained from the numerical solution of the model (Eqs. 1–3). The analytical result of the average approximation (Eqs. 8–9) is reported with a dot-dashed line. Results from a 3D simulation in the limit of W → 0 are reported with open diamonds (note that in 3D ω is defined as ω = W2/(W + w)2). The inset reports the magnitude of ionic current density distribution at the base of the pillar along the coordinate x depicted in a) for W = 30 μm and ω = 0.6.
Figure 3b shows the relative improvement in current density δitot as a function of the geometric ratio ω defined in Eq. 7 for different values of W in the limit of semi-infinite electrode thickness (ted → ∞) and semi-infinite pillar thickness (th → ∞) as obtained from the numerical solution of Eqs. 1–3. The Figure shows that δitot exhibits a parabolic behavior with a defined maximum as a function of ω. This is not surprising because as ω approaches 0 the electrode becomes flat, while as ω approaches 1 the composite electrode volume drops to zero and no electrochemical reaction occurs. The maximum improvement in current density over the flat electrode performance is 27% for ω ≈ 0.4.
As W increases, the general improvement given by the mesoscale structural modification drops. This is explained by analysing the inset in Figure 3b, which shows that the ionic current is not evenly distributed within the pillar width for large values of W: since the inner region of the pillar is no longer optimally exploited for ionic conduction, δitot decreases. Accordingly, the maximum of δitot shifts to larger values of ω as W increases (see dashed line in Figure 3b) to compensate for the lower utilisation of the pillar width. For W > 60 μm, pillars are detrimental for performance as δitot ≤ 0 in the whole range of ω, thus such structures should be avoided under the conditions used for this study.
A dimensionless factor ΛW can be defined as:
![Equation ([11])](https://content.cld.iop.org/journals/1945-7111/164/2/F89/revision1/d0015.gif)
Such a dimensionless factor, which compares the pillar half-width with the characteristic thickness of the composite electrode domain, is useful to identify two regimes of ionic conduction within the pillar width. For ΛW << 1 the whole width of the pillar is utilised for conduction and the ionic current density distribution is uniform, while for ΛW >> 1 the inner region of the pillar is not optimally utilised. Interestingly, this means that the maximum improvement in current density is achieved for ΛW << 1 while for ΛW >> 1 the mesoscale structural modification can in fact be detrimental, in agreement with the numerical results in Figure 3b. This outcome is supported by published studies, for example by Nagato et al.,30 who proved experimentally that pillars with smaller width result in higher power density than wider pillars. In addition, similar predictions were reached by Tanner et al.35
Interestingly, the dot-dashed line in Figure 3b shows that the average approximation reported in Eqs. 8 and 9 reproduces remarkably well the trend of δitot as a function of ω for ΛW ≤ 0.1. In addition, results of a 3D simulation in the limit of W → 0, reported with open diamonds, lie on the curve predicted with the analytical average approximation, confirming that 2D simulations are representative of the general trends of a three-dimensional structural modification. Thus, the upper bound of performance and the optimal ω (i.e., the optimal pillar spacing) can be analytically predicted by using Eqs. 8–9 as a function of electrode microstructural and material properties. This is a useful result for a rapid short-cut assessment and design of mesoscale structural modifications.
Figure 4 shows the effect of the pillar thickness th on δitot in the limit of ted → ∞ for two representative cases: W = 5 μm (i.e., ΛW < 1, Figure 4a) and W = 30 μm (i.e., ΛW > 1, Figure 4b). For any values of th, δitot shows a maximum as a function of ω, as already reported in Figure 3b in the limit of th → ∞. More importantly, for both ΛW < 1 and ΛW > 1 the improvement over flat electrode δitot decreases as the pillar thickness th decreases. Similarly to Eq. 11, another dimensionless factor can be defined as follows:
![Equation ([12])](https://content.cld.iop.org/journals/1945-7111/164/2/F89/revision1/d0016.gif)
which compares the pillar thickness with the characteristic thickness of the electrode. Figure 4 shows that, for any value of W and ω, Λh must be much larger than 1 in order to maximise δitot. When both ΛW and Λh are considered together they help determine the maximum performance improvement caused by the mesoscale modification as discussed later.
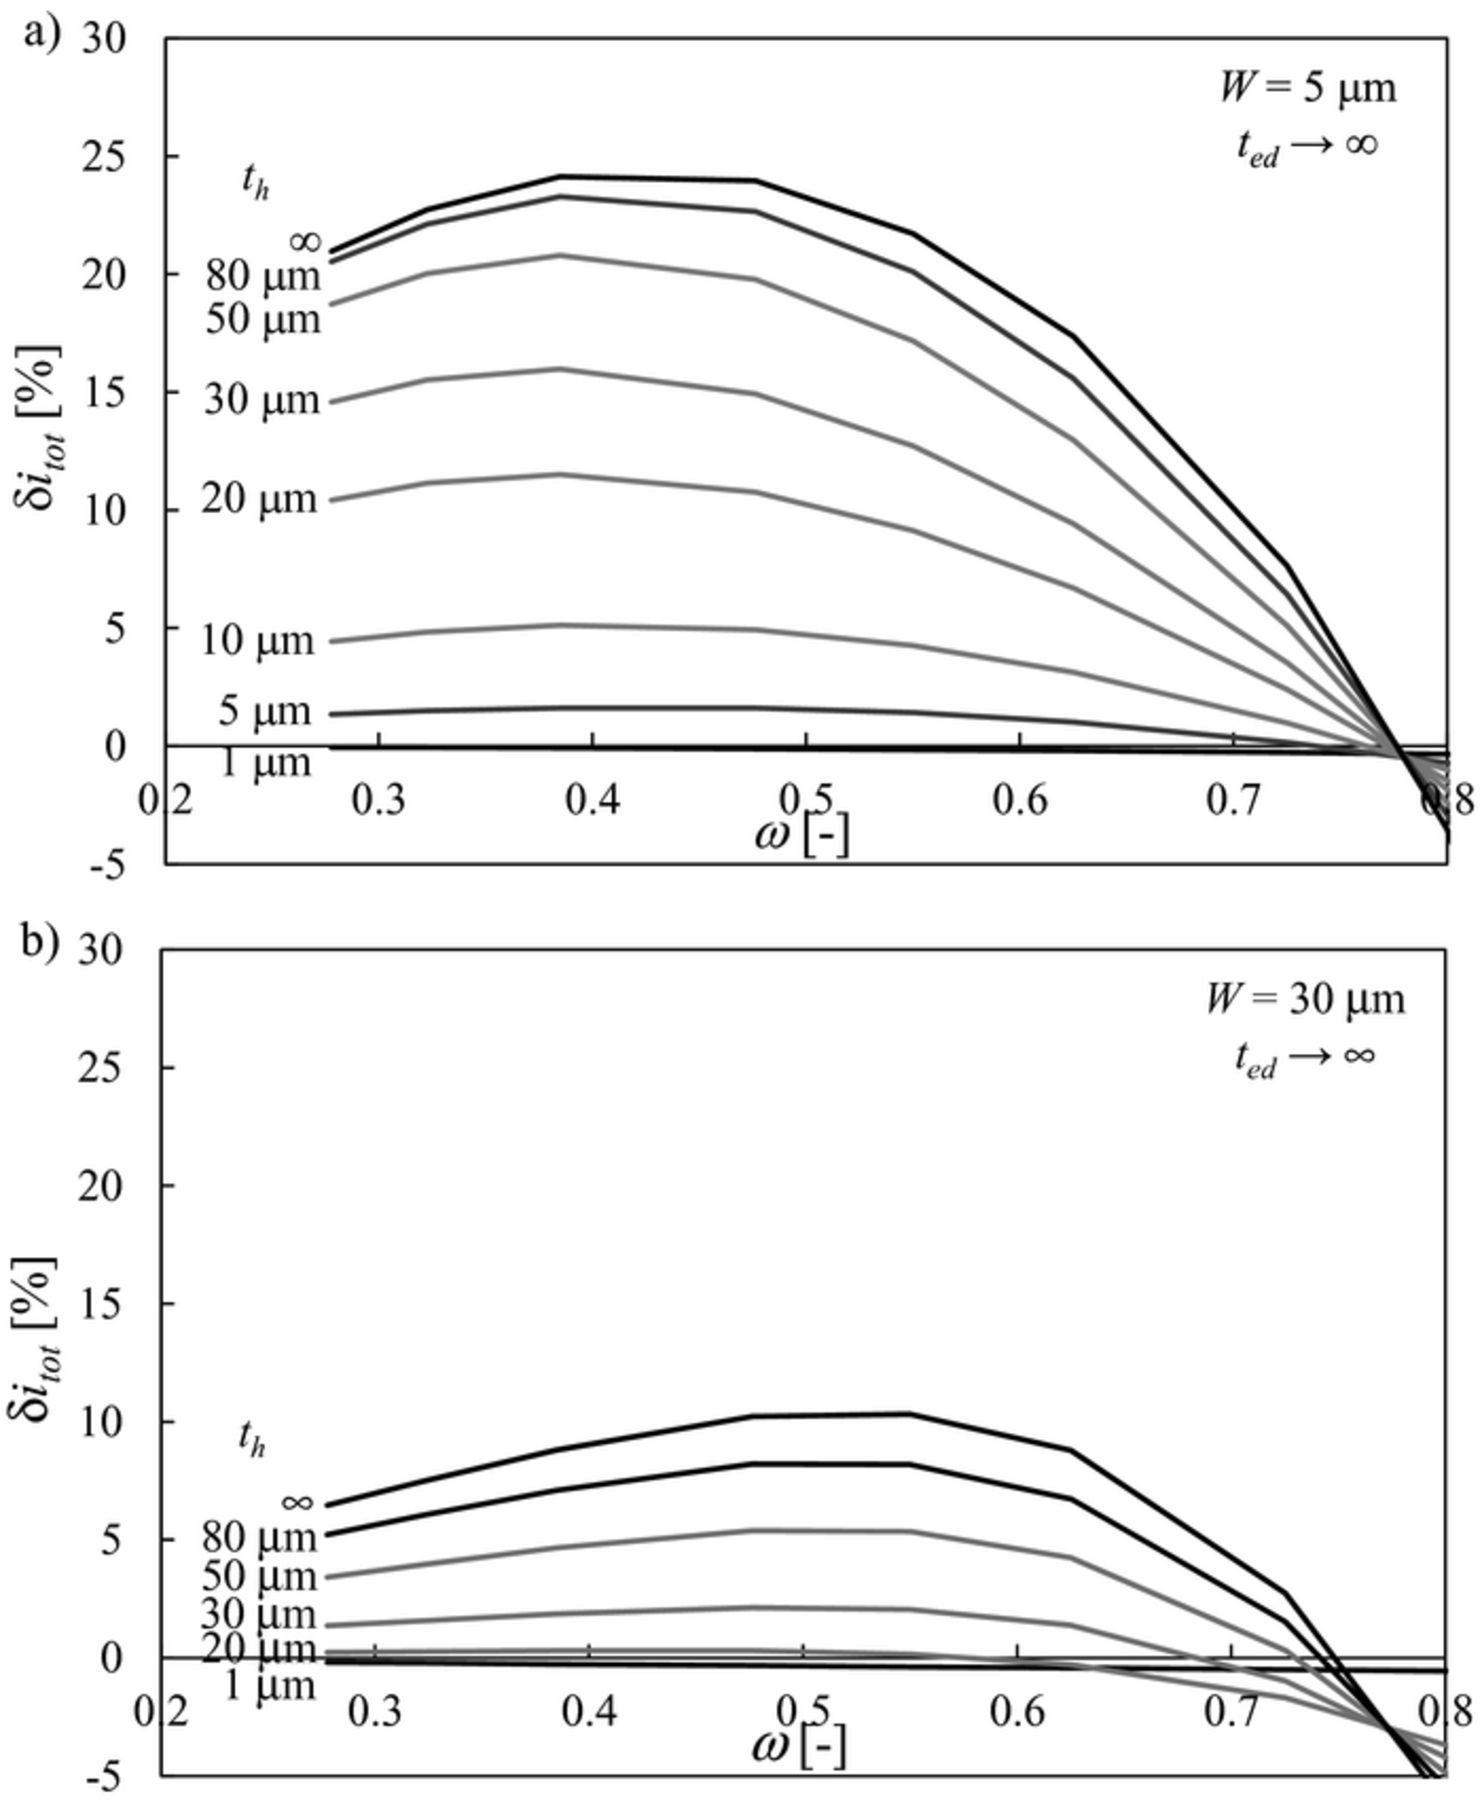
Figure 4. Effect of pillar thickness th on δitot as a function of ω for a rectangular pillar in the limit of ted → ∞: a) W = 5 μm, b) W = 30 μm.
The effect of the electrode thickness ted on δitot is reported in Figure 5 for a representative case W = 5 μm, w = 8 μm and th = 20 μm. Figure 5 shows that δitot increases as ted increases and approaches an asymptotic value in the limit ted → ∞. Therefore, given the pillar geometric parameters, while a small electrode thickness can be even detrimental for performance as δitot < 0 for ted < 40 μm, there is no significant improvement in making the electrode thicker beyond ted ≈ 4·th.
Figure 5. Effect of electrode thickness ted on δitot for a rectangular pillar (W = 5 μm, w = 8 μm and th = 20 μm).
In summary, the results reported in Figures 3–5 lead to the following key outcomes informing design guidelines:
- the mesoscale structural modification produces the largest improvement in performance in the limit of thin and long pillars, that is, for ΛW = W/t*ed < 0.1 and Λh = th/t*ed >> 1. Eventually, this matches the concept of scaffold electrodes,65–70 that is, electrodes fabricated with a porous ionic backbone which is infiltrated with electron-conducting particles or even a mixture of electron-conducting and ion-conducting particles. In other words, the optimal 3D printed electrode with rectangular pillars results in the production of a scaffold with well-defined geometry;
- the upper bound in performance can be analytically predicted through the approximated model reported in Eqs. 8 and 9. This represents an effective rapid method for the optimisation of the mesoscale structural modification.
Microstructural properties of the composite electrode domain
The microstructural properties of the composite electrode domain, keff and LTPB, play a significant role in determining the electrochemical performance of a flat electrode, as already discussed above. Similarly, the electrode microstructural properties are crucial also when a mesoscale structural modification is applied. As demonstrated in the previous section, the upper bound of improvement is achieved in the limit of ted = th → ∞ and is accurately predicted by the average approximation described in Eqs. 8 and 9. Hence, the effect of the microstructure of the composite electrode domain on δitot is addressed in this section through the average approximation model.
As already discussed in the previous section, the maximum improvement in performance δitot occurs in the limit ted = th → ∞ for a specific value of ω, that is, for an optimal volume fraction of pillars ωopt. Such an optimal condition, which represents the upper bound of performance that the mesoscale structural modification can yield, can be calculated by substituting Eq. 8 in Eq. 9a and solving for  , thus leading to:
![Equation ([13a])](https://content.cld.iop.org/journals/1945-7111/164/2/F89/revision1/d0017.gif)
![Equation ([13b])](https://content.cld.iop.org/journals/1945-7111/164/2/F89/revision1/d0018.gif)
where Rmin ed is the minimum polarisation resistance of the flat electrode (see Eq. 6a) and  is the minimum polarisation resistance of the electrode with mesoscale modification corresponding to the upper bound of improvement in δitot (i.e., calculated for ω = ωopt). Note that Eq. 13 is valid only for keff ≤ 0.5. For keff > 0.5
  does not show any minimum as a function of ω and the equation
  does not have any real solution.
Figure 6 shows ωopt and the ratio  as a function of the effective conductivity factor of the ion-conducting phase in the composite electrode domain keff. As keff increases from 0 to 0.5, the optimal volume fraction of pillars ωopt decreases from 0.5 to 0 while the ratio
  increases from 0 to 1. Note that the lower the ratio
  , the larger the improvement δitot over the flat electrode in accordance with Eqs. 9b and 10.
Figure 6. Effect of the microstructure of the composite electrode on the optimal conditions of mesoscale structural modification according to Eq. 13 in the limit ted = th → ∞. Ratio between optimal electrode resistance and minimum resistance of flat electrode (left axis) and optimal volume fraction of pillars (right axis) as a function of the effective conductivity factor of the composite electrode domain.
Several considerations can therefore be drawn from the analysis of Eq. 13 and Figure 6:
- the optimal volume fraction of pillars ωopt depends only on keff (see Eq. 13a). Other microstructural or material parameters, such as LTPB, σO or i0TPB, do not play any role in determining the optimal volume fraction of the pillars under the current assumptions: the decision of introducing or not a mesoscale modification depends solely on the effective conductivity factor of the ion-conducting phase in the composite electrode domain;
- the mesoscale structural modification is beneficial only for keff ≤ 0.5, while it is always detrimental for keff > 0.5, because the minimum resistance of the electrode with pillars
 exceeds the resistance of the benchmark flat electrode Rmin ed (see Figure 6). Thus, for keff > 0.5 the improvement of electrode performance must be achieved by different means other than mesoscale structural modification;
 - as keff decreases, the optimal volume fraction of pillars ωopt increases (see Figure 6), meaning that pillars are required to compensate for the lower effective ionic conductivity of the composite electrode domain;
- the mesoscale structural modification is particularly beneficial for electrodes with low effective ionic conductivity factor keff, since the reduction in electrode resistance , in comparison with the benchmark flat electrode Rmin ed, is relatively more significant (see Figure 6). However, assuming that the other parameters remain constant (in particular LTPB), since the resistance of the flat electrode Rmin ed scales with (see Eq. 6a), a flat electrode with low effective ionic conductivity is not a good benchmark as it would show poor performance. Thus, a useful framework to improve performance is i) the microstructure of the flat electrode should be improved first, and then ii) an optimal mesoscale structural modification can be applied to further enhance the performance;
- the improvement of the microstructure of the composite electrode domain envisaged in the previous point must be done rationally. Since Rmin ed scales with (see Eq. 6a), the microstructure of the composite electrode domain could be modified in order to reduce keff and proportionally increase LTPB to keep the same Rmin ed. By doing so, the benefits of a mesoscale modification would be amplified, since decreases as keff decreases (see Figure 6). This implies that a composite electrode intended for mesoscale structural modification should be optimised for maximum TPB density rather than for maximum keff, because the effective ionic conduction is provided by the ion-conducting pillars. As an additional consequence, the microstructure of a composite electrode optimised for flat electrode configuration may not be the best one to be used as a basis for a mesoscale structural modification.


The last two points highlight the importance of a proper design of the microstructure of the composite electrode domain even when a mesoscale structural modification is adopted. In addition, the accurate quantification of the effective conductivity factor is of a paramount concern and appropriate methods,71,72 based on the tomographic reconstruction of the microstructure, must be employed to avoid any incorrect evaluation.
Shape of the mesoscale structural modification
In the previous sections, rectangular pillars were considered in the analysis. Although this is the pattern currently produced with different techniques,15,24,30,31 additive manufacturing can potentially print pillars with unique and different shapes,21 going beyond the capability of existing manufacturing methods such as screen printing and tape casting.
The introduction of a terrace of width Wt and thickness tt onto a rectangular pillar, as reported in Figure 7a, is the first shape modification analyzed in this section. Figure 7b shows on the left axis the increase in current density beyond the benchmark flat electrode, as a function of the pillar thickness th, for a pillar with terrace of dimensions Wt = tt = 5 μm (δiterrtot, solid line). For comparison, the result for a rectangular pillar without terrace is reported (δino terrtot, dashed line). The difference between the relative improvement given by the terrace beyond an equivalent rectangular pillar, i.e.,  , is reported on the right axis. The two insets show the distribution of current density converted per unit of TPB iTPB in the active volume for two cases, th = 20 μm and th = 40 μm.
Figure 7. a) Geometry of the pillar with terrace: the dense electrolyte phase is reported in blue, the porous composite electrode is reported in gray. b) δitot as a function of pillar thickness th for a rectangular pillar (dashed line) and a pillar with terrace (solid line) for W = 5 μm, w = 20 μm, Wt = tt = 5 μm. On the right axis, the difference  between pillars with and without terrace is reported. c) Difference
  as a function of terrace thickness tt for W = 5 μm, w = 20 μm, Wt = 5 μm, th = 25 μm. The insets in b) and c) show the distribution of current density converted per unit TPB iTPB in the active volume: dark blue corresponds to iTPB = 0 while the colour turns into red as iTPB increases.
The insets in Figure 7b show that the electrochemical reaction takes place close to the electrode/electrolyte interface, being distributed mainly within a distance roughly equal to the characteristic thickness t*ed. This current distribution matches what expected in a flat electrode configuration.36 The mesoscale structural modification makes the iTPB distribution distorted toward the pillar, allowing for more current to be converted in the proximity of the pillar up to a thickness slightly larger than t*ed. Such an effect, consistent with the work reported by Delloro and Viviani,22 is due to the enhanced conduction that the pillar provides, thus opening a faster ionic conduction path toward the electrolyte.
When the terrace is placed at th ≈ t*ed, such an extra lateral fin boosts additional current conversion, leading to an improvement in current density δiterrtot larger than that obtained without terrace δino terrtot, as shown by the right axis in Figure 7b. On the other hand, placing the terrace too far above from the active region does not make any difference with the case with no terrace:  decreases and approaches 0 as th increases beyond t*ed in Figure 7b. Similarly, placing the terrace too close to the electrolyte interface (i.e., th << t*ed) produces detrimental effects as
  becomes negative, meaning that more current is produced when there is no terrace. This detrimental effect is due to the fact that the terrace removes electrochemically active volume from the composite electrode domain, thus placing the terrace too close to the electrolyte interface, exactly where more current iTPB is produced, reduces the active region wherein current is converted, leading globally to a lower performance.
Figure 7c, which shows the difference  as a function of the terrace thickness tt, provides an additional insight. As tt increases, the improvement in current density over the pillar without terrace increases and reaches as maximum, beyond which
  decreases and becomes negative. There is a simple reason behind this trend. For small tt values, the terrace is too thin to provide an effective conduction path to the main body of the pillar and to collect ionic current from the reacting zone in the composite electrode domain. As tt increases, the terrace acts as a horizontal conducting fin, effectively providing ionic conduction. However, as the terrace thickness increases, more active volume is removed in the composite domain, especially closer to the electrolyte interface where electrode volume is required by the electrochemical reaction to take place. Thus, the beneficial effect of a more effective lateral ionic conduction is quickly counterbalanced by the removal of active volume in the composite domain.
Hence, the results of Figure 7 provide a clear insight into the role of the terrace and, more generally, on the pillar shape. The terrace is useful when it provides ionic conduction far from the electrolyte interface, especially at a distance comparable with the characteristic thickness t*ed, in order to collect more ionic current and thus provide a faster conduction pathway toward the electrolyte. Meanwhile, the mesoscale structural modification shall not remove active volume in the composite electrode domain, especially at the electrolyte interface where there is the maximum current conversion rate. In other words, the mesoscale structural modification must provide ionic conduction where needed, that is, farther from the electrolyte interface, without removing active electrode volume where needed, that is, at the electrolyte interface.
The proper balance of these two opposite requirements is a golden rule for the rational design of the pillar shape. In particular, maximising the ionic conduction farther from the electrolyte interface without removing active volume points toward a pillar shape which has to mimic the ohmic overpotential profile along the electrode thickness. In a flat electrode the ohmic overpotential profile is opposite to the activation overpotential distribution,36 being 0 at the electrolyte interface and increasing exponentially along the electrode thickness.36,54 Such an exponential profile is mathematically mimicked by the following equation:
![Equation ([14])](https://content.cld.iop.org/journals/1945-7111/164/2/F89/revision1/d0019.gif)
which is used in Figure 8a to draw the outline of the pillar, resulting in a rounded terrace shape which resembles the ohmic overpotential distribution in a flat configuration.36,54 In Eq. 14, tr is a roundness characteristic length: the smaller tr, the sharper the outline.
Figure 8. a) Geometry of the pillar with rounded terrace according to Eq. 14: the dense electrolyte phase is reported in blue, the porous composite electrode is reported in gray. b) Optimal δitot and tr for a rounded terrace as a function of Wt for W = 5 μm, w = 20 μm, th = 25 μm. The insets show the distribution of current density iTPB in the active volume for three representative cases.
Figure 8b shows the results of a design study on parameters Wt and tr for W = 5 μm, w = 20 μm and th = 25 μm. In particular, given a value Wt, the right axis reports the value of tr corresponding to the maximum δitot, which is reported on the left axis. As Wt increases, δitot increases until a broad maximum is reached. Notably, the values of δitot obtained for an electrode with rounded terrace are larger than the maximum values provided by rectangular pillars with and without terrace for the same geometric parameters, although the improvement in δitot is only minor, in the order of 1% or less. On the other hand, the roundness characteristic length tr continuously decreases, meaning that the optimal shape becomes sharper as Wt increases as depicted in the insets of Figure 8b.
The results of the rounded pillar shape further confirm the role of the terrace: the mesoscale structural modification must provide conduction farther from the electrolyte without removing active volume at the electrolyte interface, leading to a rather sharp optimal shape which enhances the performance obtained by rectangular pillars. In accordance with this, the triangular shape depicted in the fourth sketch in Figure 1b is expected to be the worst design among the series analyzed, since it removes composite electrode volume at the electrolyte interface without providing any improvement through a conducting fin into the active region within a distance t*ed from the electrolyte.
Such a rounded terrace shape is an ideal design paradigm, which can be practically mimicked by fabricating dimples according to the method proposed by Dai et al.29 In practice, in a 3D structure the terraces can even touch each other (i.e., Wt = w), provided that the third dimension z (i.e., the through-plane direction in Figure 8a) is exploited to provide gas and electronic current underneath the terrace. In addition, the ability to produce and the mechanical requirements of such a sharp shape are something which needs to be addressed, especially during operation and fabrication if additive manufacturing is to be employed.15 While clearly of practical importance, these aspects are out of the scope of the current study. The main point of the design analysis on the pillar shape is the underlying rationale that should guide the optimisation of the mesoscale structural modification, which is producing a shape that is capable of providing ionic conduction farther from the electrolyte up to a thickness in the order of t*ed without removing active volume at the base of the pillar. Hierarchical and fractal-like structures resembling trees or human lungs can be foreseen as well,73 provided the feasibility in producing mechanically stable dense features at the small resolution required by the coupled reaction/conduction process, which has a mesoscale characteristic length equal to t*ed.
Conclusions
In this study, the rational design of the electrode/electrolyte interface, here referred as mesoscale structural modification, in SOFC porous composite electrode functional layers was addressed through modelling means for the limit case of negligible electronic resistance and no mixed ionic-electronic conduction. A simple 2D numerical model, taking into account ionic conduction and electrochemical conversion of current, was developed and applied to simulate the enhancement in current density beyond what a benchmark flat electrode can provide. In addition, an analytical approximation was proposed to predict the upper bound in performance improvement. All the results provide key insight for the rational design of electrodes through to a series of characteristic parameters, such as the characteristic active thickness of the coupled reaction/conduction process t*ed, the effective conductivity factor of the ion-conducting phase in the composite electrode domain keff, the ratio between pillar half-width and half-distance among pillar walls ω corresponding to the pillar volume fraction, and dimensionless factors ΛW and Λh comparing pillar width and pillar thickness with the characteristic thickness.
The main conclusions of the study can be summarised as follows:
- the fundamental reason why the mesoscale structural modification enhances the electrochemical performance stems from the enhanced ion-conducting pathway provided by pillars;
- the mesoscale structural modification is beneficial only for keff ≤ 0.5, while it is detrimental for keff > 0.5 under the assumptions of this study. The optimal volume fraction of pillars ωopt, which depends on keff only, as well as the upper bound in performance can be predicted analytically according to Eq. 13;
- a composite electrode intended for mesoscale structural modification must be optimised for maximum TPB density rather than for maximum effective ionic conductivity;
- the mesoscale structural modification produces the largest improvement in performance in the limit of thin and long pillars (ΛW < 0.1 and Λh << 1). This means that the optimal mesoscale modification tends toward the concept of scaffold electrodes with well-defined geometry;
- the shape of the mesoscale structural modification should be chosen in order to provide ionic conduction farther from the electrolyte up to a distance of about t*ed without removing active volume at the electrolyte interface. This resembles the distribution of ohmic overpotential.
The understanding of the fundamental reason about when and why the mesoscale structural modification is beneficial, the correlation between performance improvement and microstructure of the composite electrode, the definition of characteristic parameters as well as the analytical expressions for the prediction of upper bounds are useful tools to guide the rational design of the mesoscale modification of SOFC electrodes and to set the minimum requirements for any fabrication technique adopted for such a scope, such as additive manufacturing. There are still some points that deserve further investigation in the future, such as the mesoscale structural design of electrodes with finite electronic resistivity, with mixed ionic-electronic conduction or with limiting gas transport losses and, more importantly, the mechanical requirements of the optimal shapes during electrode fabrication and operation.
List of Symbols
| F | Faraday constant (C mol−1) |
| iO | ionic current density (A m−2) |
| itot | total current density converted within the electrode (A m−2) |
| iTPB | current density per unit of TPB length (A m−1) |
| i0TPB | exchange current density per unit of TPB length (A m−1) |
| keff | effective conductivity factor of the ion-conducting phase in the composite domain (-) |
| LTPB | TPB length per unit volume of composite domain (m−2) |
| R | gas constant (J mol−1 K−1) |
| Red | polarisation resistance of the electrode (Ω m2) |
| Rmin ed | minimum polarisation resistance of the electrode (Ω m2) |
| ted | electrode thickness (m) |
| t*ed | characteristic thickness of the coupled reaction/conduction process (m) |
| tey | electrolyte thickness (m) |
| th | pillar thickness, see Figures 3a, 7a, 8a (m) |
| tr | roundness characteristic length, see Figure 8a (m) |
| tt | terrace thickness, see Figure 7a (m) |
| T | absolute temperature (K) |
| VO | potential of the ion-conducting phase (V) |
| w | half-distance between pillar walls, see Figures 1c, 3a, 7a, 8a (m) |
| W | half-width of pillars, see Figures 1c, 3a, 7a, 8a (m) |
| Wt | terrace width, see Figures 7a, 8a (m) |
| Γ | Thiele modulus (-) |
| δitot | improvement in current density relative to flat electrode, see Eq. 10 (-) |
| ηtot | applied overpotential (V) |
| Λh | dimensionless factor comparing pillar thickness and characteristic thickness (-) |
| ΛW | dimensionless factor comparing pillar half-width and characteristic thickness (-) |
| σO | bulk conductivity of the ion-conducting phase (S m−1) |
| ω | ratio between pillar half-width and half-distance between pillar walls (Eq. 7) (-) |
Superscripts
| — | variables calculated according to the average approximation (Eqs. 8 and 9) |
| asympt | asymptotic value for semi-infinite thickness in flat electrode |
| flat | calculated in flat electrode |
| max | maximum |
| no terr | without terrace (i.e., rectangular pillar) |
| terr | with terrace |
Subscripts
| opt | optimal conditions (i.e., upper bound of performance) |
Acknowledgments
This project has received funding from the European Union's Horizon 2020 research and innovation programme under the Marie Skłodowska-Curie grant agreement No 654915 and the EPSRC grant EP/M014045/1. Helpful discussions with Dr. Samuel J. Cooper and Nick Farandos (Imperial College London) are gratefully acknowledged.
Data underpinning this publication is available at: https://doi.org/10.5281/zenodo.193016.
Disclaimer: the European Commission Research Executive Agency is not responsible for any use that may be made of the information this paper contains.